Sample Category Title
Trade Idea Update: GBP/USD – Buy at 1.2325
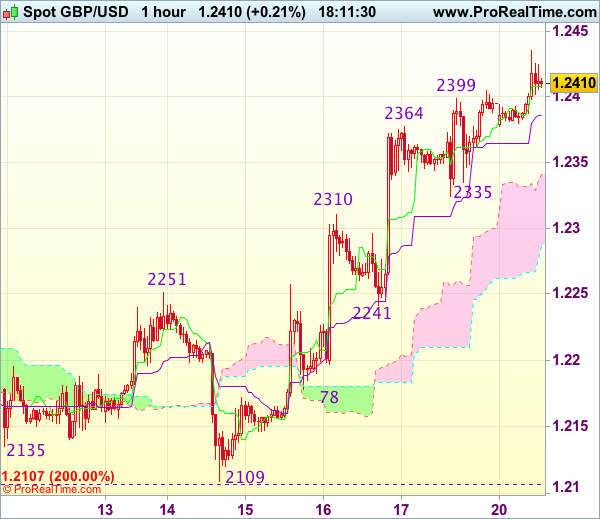
GBP/USD - 1.2407
Original strategy :
Buy at 1.2325, Target: 1.2445, Stop: 1.2290
Position : -
Target : -
Stop : -
New strategy :
Buy at 1.2325, Target: 1.2445, Stop: 1.2290
Position : -
Target : -
Stop : -
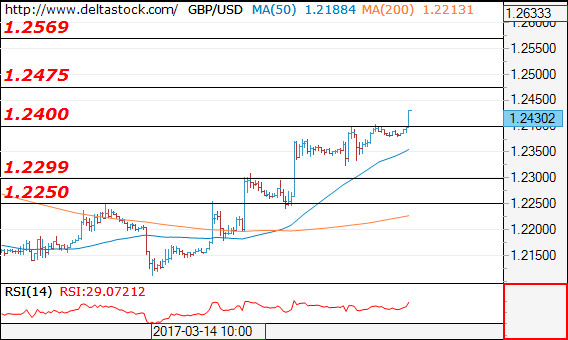
As cable has risen again after finding renewed buying interest at 1.2335, suggesting recent upmove from 1.2109 (this month’s low) is still in progress and may extend further gain to 1.2445-50, however, loss of near term momentum should prevent sharp move beyond previous resistance at 1.2479, risk from there has increased for a retreat to take place later.
In view of this, would not chase this move from here and we are looking to buy cable on pullback as said support at 1.2335 should limit downside and bring another rise. Below previous resistance at 1.2310 would defer and suggest top is possibly formed, risk correction to 1.2265-70 but price should stay above indicated support at 1.2241.
Trade Idea Update: EUR/USD – Buy at 1.0710
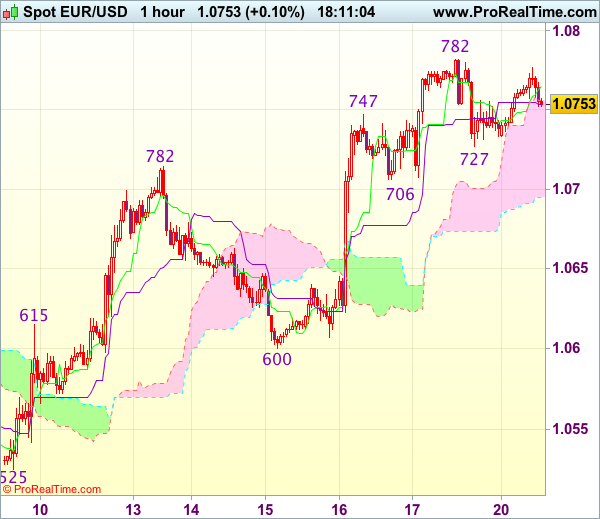
EUR/USD - 1.0751
Original strategy :
Buy at 1.0710, Target: 1.0810, Stop: 1.0675
Position : -
Target : -
Stop : -
New strategy :
Buy at 1.0710, Target: 1.0810, Stop: 1.0675
Position : -
Target : -
Stop : -
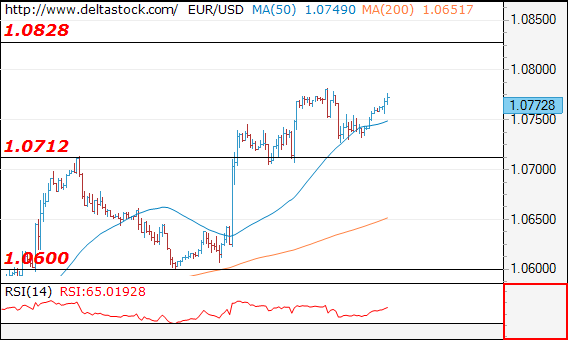
As the single currency has maintained a firm undertone after last week’s rally, suggesting recent erratic upmove from 1.0493 low is still in progress and may extend further gain towards previous chart resistance at 1.0829, however, loss of near term upward momentum should prevent sharp move beyond 1.0850-60 and price should falter well below 1.0890-00, risk from there has increased for a retreat to take place later.
In view of this, would not chase this rise here and we are looking to buy euro on subsequent pullback as 1.0706 support should limit downside and bring another rise later. Below 1.0675-80 would defer and suggest top is possibly formed, risk weakness to 1.0640 (previous resistance now support) but still reckon indicated support at 1.0600 would remain intact.
Trade Idea Update: USD/JPY – Sell at 113.50
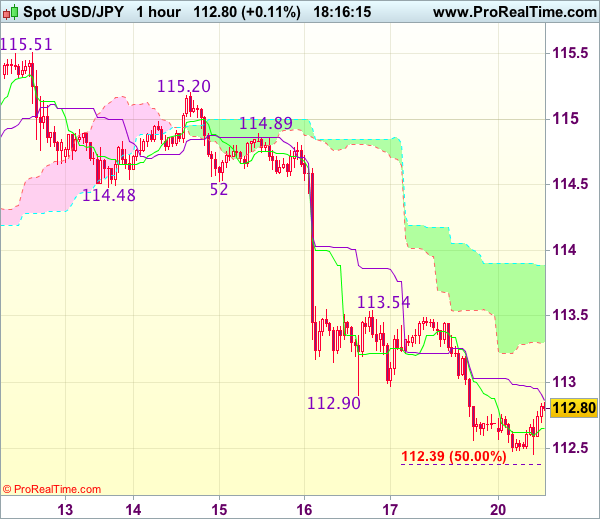
USD/JPY - 112.84
Original strategy :
Sell at 113.50, Target: 112.40, Stop: 113.85
Position : -
Target : -
Stop : -
New strategy :
Sell at 113.50, Target: 112.40, Stop: 113.85
Position : -
Target : -
Stop : -
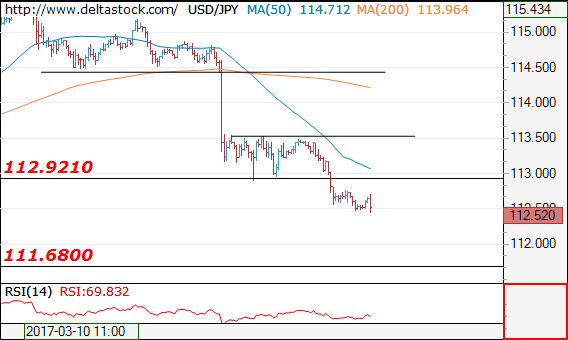
As the greenback has remained under pressure after meeting renewed selling interest at 113.54, suggesting recent decline from 115.51 is still in progress and may extend further weakness to 112.35-40 (50% projection of 115.20-112.90 measuring from 113.54), then 112.10-15 (61.8% projection), however, loss of downward momentum should prevent sharp fall below previous support at 111.69, risk from there has increased for a rebound to take place later.
In view of this, would not chase this fall here and would be prudent to sell dollar on subsequent recovery as said resistance at 113.54 should limit upside, bring another decline later. Only above the upper Kumo (now at 113.90) would abort and signal low is formed instead, bring rebound to 114.20-25 later.
Euro Traders Turn Their Gaze to French Polls; Debates Kick Off Today
The common currency gave back some of its recent gains on Friday, following the release of a poll on the French presidential election. The poll showed that although the far-right Eurosceptic candidate Marine Le Pen is still expected to lose the 2nd voting round, she has recovered some ground on her main rival, Emmanuel Macron. EUR/USD slid after it hit resistance near the 1.0775 (R1) level, but the slide was stopped near 1.0735 (S1). However, the pair recovered all of its aforementioned losses during the Asian morning Monday, perhaps due to a poll released on Sunday showing that Macron would lead the first round, and also beat Le Pen in the second round by a larger margin than previous polls showed. At the time of writing, the rate looks to be headed for another test near the 1.0775 (R1) resistance, where a clear break is possible to aim for a test near the very important territory of 1.0800 (R2).
We think that the common currency is likely to become increasingly more responsive to fresh polls heading into the ballots, considering that polls released a few weeks ahead of the elections may bear more importance in the eyes of investors. What's more, today the first French presidential debate between the 5 most popular candidates is set to take place. Depending on who the market sees as the winner of the debate, there could be an impact on the common currency. A strong showing by Le Pen could add momentum to her campaign and considering her anti-European views, it may prove a cause for euro weakness. Given that EUR/USD is trading close to the key resistance of 1.0800 (R2), this could encourage the bears to take advantage of that zone and initiate new short positions. On the other hand, if Macron is seen as emerging victorious, market participants could price out some probability of European disintegration. This is likely to fuel further the latest recovery in EUR/USD and it could even prove the catalyst for a clear break above the 1.0800 (R2) zone. Zooming out to the daily chart, we see that the 1.0800 (R2) critical resistance is also the neckline of a possible inverted head and shoulders formation. As such, a clear close above 1.0800 (R2) and the downtrend line taken from the peak of the 3rd of May 2016 could signal the completion of the pattern, and in combination with a potential defeat of Le Pen in the second round, it could lead to a medium-term trend reversal.
EUR/GBP got hit by Friday's poll as well and slid from 0.8725 (R1) to hit support at 0.8660 (S1), near the downside resistance line drawn from the peak of the 11th of October. The fact that the rate is still trading above that line leaves the door open for the bulls to enter the market and push the pair higher. Nevertheless, we would like to see a decisive break above the upper bound of the falling wedge that has been in place since the 10th of March before we get confident on such a rebound. The trigger for such a break could be a poor showing by Le Pen in today's debate.
G20 drop commitment to resist protectionism
Over the weekend, the financial leaders of the G20 nations did not reiterate a long-standing pledge to resist protectionism in their statement, amid opposition from the US. Even though there was no major FX market impact, this highlights the risk that the Trump administration could pursue a more protectionist approach on trade policy, in line with what the US President vowed on the campaign trail. In our view, this increased risk of global protectionism could have an impact on the rhetoric of the RBNZ and the RBA, considering that both of those economies are heavily export-oriented. In particular, at the latest RBNZ meeting Governor Wheeler indicated that one of the biggest risks he sees is US President Trump's potential protectionist trade policies. As such, we believe that this could fuel an even more cautious stance from the Bank when it meets on Wednesday (see below).
Today's highlights: The European day is particularly light, with no major events or indicators due to be released.
Besides the French presidential candidates, we have two more speakers on today's agenda: BoE Chief Economist Andy Haldane and Chicago Fed President Charles Evans.
As for the rest of the week, on Tuesday, the UK will release its CPI data for February. The forecast is for both the headline and the core rates to have risen, which could heighten market expectations with regards to a potential reduction in BoE stimulus.
On Wednesday, late during the day, the RBNZ rate decision will be in the spotlight. Expectations are for no change in policy. At its latest gathering, the Bank retained its easing bias despite improving domestic economic data, indicating that numerous uncertainties persist, particularly in the global outlook. As was later explained by Governor Wheeler, this was a reference to the risks surrounding exports and the prospect of increased global protectionism. As such, given that global risks remain elevated as was confirmed by the G20 gathering, we expect the RBNZ to retain its dovish bias and leave the door open for further easing.
On Thursday, the only major indicator we get is UK retail sales for February.
On Friday, we get the preliminary manufacturing and services PMIs for March from several European nations and the Eurozone as a whole. From the US, we get durable goods orders for February and from Canada, CPI figures for February.
EUR/USD
Support: 1.0735 (S1), 1.0710 (S2), 1.0675 (S3)
Resistance: 1.0775 (R1), 1.0800 (R2), 1.0830 (R3)
EUR/GBP
Support: 0.8660 (S1), 0.8635 (S2), 0.8590 (S3)
Resistance: 0.8725 (R1), 0.8760 (R2), 0.8790 (R3)
Spot Gold – Bulls Are Looking For Next Strong Barrier At $1237, Thick Hourly Cloud Underpins
Spot Gold probed above last week's high at $1233on extension of strong rally from $1197 that was sparked by Fed.
Gold is holding firm bullish tone in the near-term and eyeing next strong barrier at $1237 (Fibo 61.8% of $1263/$1195 pullback), break of which would generate fresh bullish signal.
Overbought slow stochastic warns of consolidation / correction ahead of $1237 barrier, with top of thick hourly cloud (spanned between $1215 and $1227), seen ideally containing dips).
Alternative scenario sees violation of strong supports at $1218/15 (daily cloud top / hourly cloud base) as bearish signal for stronger losses.
Res: 1235, 1237, 1244, 1247
Sup: 1229, 1227, 1224, 1218
EUR/USD Elliott Wave Analysis
EUR/USD – 1.0754
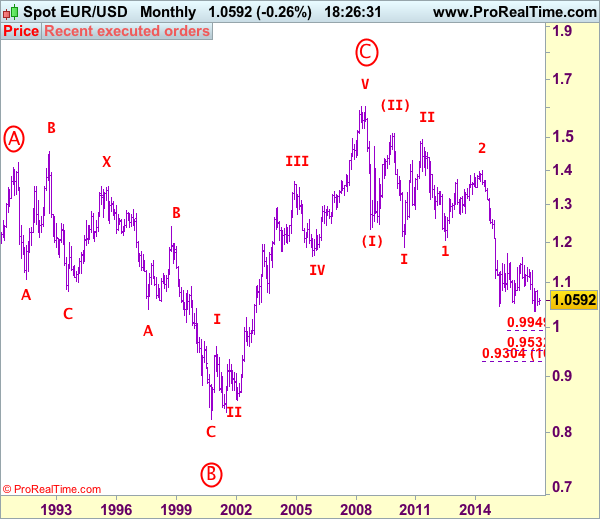
EUR/USD: Wave (c) of 2 ended at 1.3993 and wave 3 of III has commenced for weakness to 1.0411 (1.236 of wave 1), then 1.0000.
The single currency found decent demand at 1.0600 last week and has rallied again, dampening our bearishness and suggesting the erratic rise from 1.0493 is still in progress, hence upside risk remains for gain towards resistance at 1.0829, however, break there is needed to signal another leg of corrective rise from 1.0340 low is still in progress for further gain to resistance at 1.0873 but still reckon upside would be limited to 1.0930-35 (61.8% Fibonacci retracement of 1.1300-1.0340) and 1.1000 should hold from here, bring another decline in Q2.
Our preferred count on the daily chart remains that a wave (II) from 1.2329 ended at 1.5145 with A-leg ended at 1.4720, followed by wave B at 1.2457, the wave C from there was also a 3 legged move and is labeled as (a): 1.3739, (b): 1.2885, the wave iii of the 5-waver (c) from 1.2885 has ended at 1.4339 and wave iv is a triangle ended at 1.3878 and wave v formed a top at 1.5145. The decline from there is a 5-waver (C) with minor wave (i) of I of (C) ended at 1.4218 with wave (ii) ended at 1.4580, wave (iii) ended at 1.3267 and wave (iv) ended at 1.3692 and wave (v) ended at 1.1876, this is also the low of wave I of (C) and wave II ended at 1.4940, hence wave III is now in progress with a diagonal wave 1 ended at 1.2042, the breach of previous support at 1.1876 (wave I trough) adds credence to our view that the wave 2 has ended at 1.3993, wave 3 has commenced for further weakness to 1.0411, then towards 1.0000.
On the downside, whilst pullback to 1.0700-10 cannot be ruled out, reckon downside would be limited to 1.0650-60 and said support at 1.0600 should hold, bring another rise later. Only a daily close below this level would signal the rebound from 1.0493 low has ended, bring further fall to 1.0550 but break of 1.0525 support is needed to revive bearishness for retest of 1.0493. A drop below 1.0493 support would add credence to previous view that the rebound from 1.0340 has ended and bring further fall to indicated key support at 1.0454. A sustained break below this level would suggest the rebound from 1.0340 has ended, bring subsequent decline to 1.0390-00, then towards said recent low at 1.0340.
Recommendation: Exit short entered at 1.0740 and stand aside for this week.
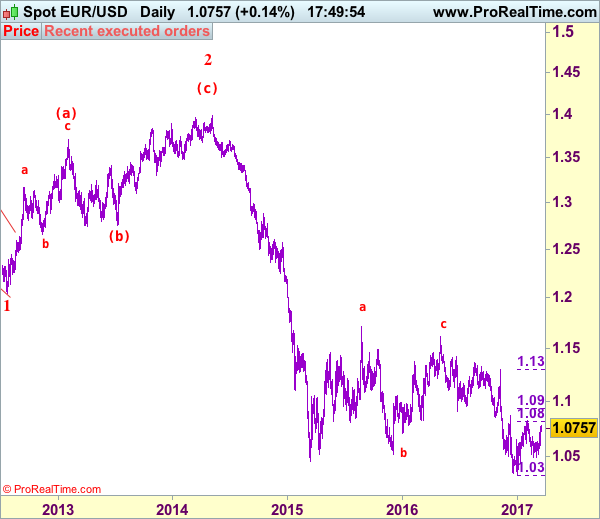
Euro's long-term uptrend started from 0.8228 (26 Oct 2000) with an impulsive structure. The rise from 0.8228 to 0.9593 (5 Jan 2001) is labeled as wave I, the retreat to 0.8352 (6 Jul 2001) is wave II and the rally to 1.3670 (31 Dec 2004) is wave III. Wave IV from there ended at 1.1640 (15 Nov 2005), the subsequent upmove to 1.6040 (July 15, 2008) is treated as wave V, the major selloff from the record high of 1.6040 to 1.2329 (October 27, 2008) signals a reversal has taken place with (I) leg ended at 1.2329 and once (II) ended at 1.5145, wave (III) itself is an extended move with I: 1.1876 and complex wave II ended at 1.4902, wave III has commenced with wave 1 and 2 ended at 1.2042 and 1.3993 respectively, wave 3 of III is now unfolding for weakness towards parity.
Forex Technical Analysis
EUR/USD
Current level - 10772
The pair is currently testing the previous peak at 1.0780 and a failure here will result in an intraday slide towards 1.0710 support zone. The overall bias on the senior frames remains positive above 1.0600, for a rise towards 1.0870.
| Resistance | Support | ||
| intraday | intraweek | intraday | intraweek |
| 1.0780 | 1.0870 | 1.0712 | 1.0600 |
| 1.0870 | 1.0945 | 1.0600 | 1.0490 |
USD/JPY
Current level - 112.52
The bias is negative below 112.90, for a slide towards 111.60. Crucial on the upside is 113.50 hurdle
| Resistance | Support | ||
| intraday | intraweek | intraday | intraweek |
| 112.90 | 115.65 | 111.60 | 111.60 |
| 114.50 | 118.65 | 111.60 | 110.30 |
GBP/USD
Current level - 1.2430
Despite the positive bias, my outlook here is rather negative, for a break through 1.2376 crucial low, towards 1.2300 and even 1.2250 support zone.
| Resistance | Support | ||
| intraday | intraweek | intraday | intraweek |
| 1.275 | 1.2570 | 1.2376 | 1.2107 |
| 1.2570 | 1.2570 | 1.2250 | 1.1984 |
USD/JPY Elliott Wave Analysis
USD/JPY - 112.81
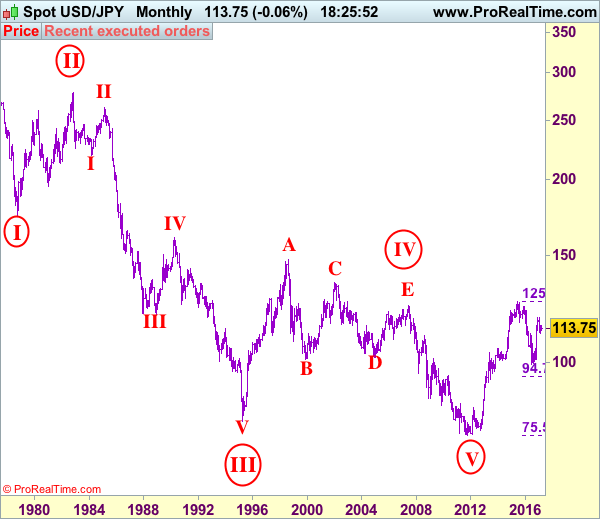
USD/JPY – Wave V of larger degree circle V has possibly ended at 75.31 and major correction has commenced and already met indicated target at 125.00.
As the greenback ran into strong resistance at 115.51 earlier this month and has retreated sharply, suggesting top is formed there and consolidation with downside bias is seen for further fall to 112.00 but break there is needed to signal the rebound from 111.59 has ended, bring further fall towards this level. Looking ahead, dollar needs to penetrate indicated support at 111.36 to retain bearishness and extend the fall from 118.66 (2016 high) for retracement of recent upmove to 110.90-00, then 109.90-95 (50% Fibonacci retracement of 101.19-118.66) but downside should be limited to 109.50 and price should stay above 109.00, bring rebound later.
Our preferred count is that, triangle wave IV (with circle) ended at 101.45 and the circle wave V brought dollar down to the record low of 75.31 in 2011 and the subsequent rebound signal major correction has commenced with A leg ended at 84.19, followed by wave B at 77.14 and impulsive wave C is now unfolding (indicated upside target at 125.00 had been met) for gain towards 127.00 level. In the event dollar drops below support at 99.01, this would confirm medium term decline from 125.86 top (2015 high) has resumed for subsequent weakness to 98.00 and possibly 97.00.
Under this count, this wave C is unfolding as impulsive waves with (1) (2), 1 2 ended at 80.67, 79.07, 82.84 and 81.69 respectively, hence the extended wave 3 has ended at 103.74 and wave 4 correction of recent upmove should bring weakness to 92.57, then towards 90.88 but psychological support at 90.00 should limit downside and bring another rally later in wave 5, indicated target at 125.00 had been met and gain to 127.00 cannot be ruled out but reckon price would falter below 130.00.
On the upside, whilst initial recovery to 113.40-50 cannot be ruled out, price should falter below 114.00 and bring another decline later. Above 114.45-50 would abort and prolong choppy trading, risk rebound to 115.00 but only;y break of indicated resistance at 115.51-62 would signal the erratic rise from 111.59 low is still in progress and may extend further gain to 116.00-10, break there would suggest the pullback from 118.66 has ended, then headway to resistance at 116.87 would follow. Looking ahead, a sustained break above there would signal early upmove has resumed for further gain to another previous resistance at 117.53 next.
Recommendation: Sell at 113.50 for 111.50 with stop above 114.50.
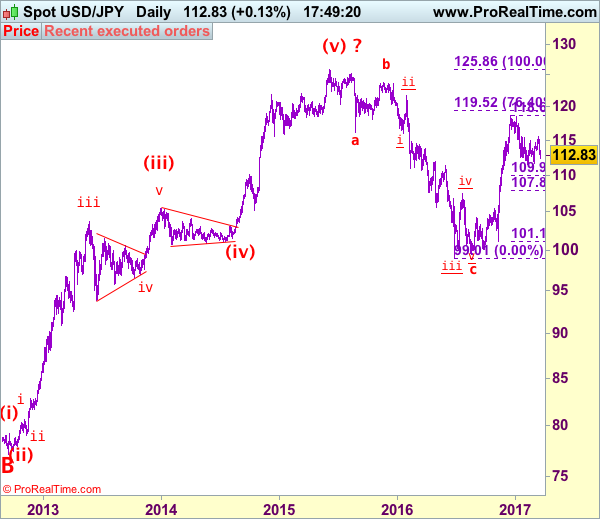
On the monthly chart, we have changed our preferred count that an impulsive wave is unfolding with major wave III with circle ended at 79.75, then followed by wave IV with circle and is labeled as a triangle with A: 147.64 (11 August, 1998), B: 101.25, C: 135.20, D: 101.67 and E leg ended at 124.14 to end the wave IV with circle. Hence, wave V with circle commenced from there and hit a record low of 75.31, however, the subsequent strong rebound signals this circle wave V has possibly ended there, hence gain to (indicated upside target at 122.00 and 125.00 had been met), the retreat from 125.86 suggests wave A of major correction has ended there and wave B correction back to 99.00, then 95.00 would be seen, however, reckon downside would be limited to 90.00, bring another rebound in wave C next year.
Manufacturing Sales Rise For Third Consecutive Month In Canada
'This was another good news report for the Canadian manufacturing sector, suggesting that the momentum in the sector that heated up in late-2016 carried over into the beginning of 2017.' - Michael Dolega, TD Bank senior economist
Manufacturing sales soared 0.6% in January, Statistics Canada reported on Friday. Growth remained positive for the third consecutive month. It was mainly driven by a 2.3% increase in non-durable goods sales, among which the main drivers were the petroleum, coal and chemical industries. The petroleum and coal industry nudged 7%, mainly because of higher volumes and higher prices. The chemical industry, in turn, advanced 2.5%, due to higher demand for pesticides and other agricultural products. Inventories climbed 1.1% in January. The largest inventories gains were registered in the petroleum and coal, machinery, primary metal and food industries, where inventories spiked 5.2%, 2.5%, 1.9% and 1.6%, accordingly. As a result, the inventory-to-sales ratio increased slightly from 1.30 to 1.31. Unfilled orders rose 0.3% after two months of declines. The increase was mostly attributable to the machinery industry, where unfilled orders hit a record high since March 2015 of C$7.3B. Furthermore, new orders rallied 4.6%, also following two consecutive months of declines. New orders mainly came from the aerospace and motor vehicle industries. In general, manufacturing sales rose in 14 of 21 industries, which represent 75.4% of the Canadian manufacturing sector.
US Manufacturing Production Shows Solid Growth Last Month, Consumer Sentiment Improves In March
'Factories are benefiting from greater consumer and business optimism since last fall's presidential election. Companies are spending more on big-ticket items such as industrial machinery, and Americans are buying cars at near-record levels. Overseas growth has spurred more exports.' - Forbes
US industrial production was unchanged last month, while market analysts anticipated an increase, official figures revealed on Friday. The Federal Reserve reported factory production came in at 0.0% in February, falling behind analysts' expectations for a gain of 0.3%. Meanwhile, January's initially reported drop of 0.3% was revised to a 0.1% fall. However, manufacturing production, which accounts for 75% of overall industrial output, posted a 0.5% increase in February that matched the preceding month's rise. A global economic recovery, stronger business investment in equipment and appropriate inventory levels allowed manufacturers to gain momentum over the last several months. The advance in manufacturing output was in line with analysts' forecasts. Data also showed utility output decreased 5.7%, following a 5.8% decline in January. The fall was mainly driven by unusually warm temperatures. Mining production rose 2.7% last month, boosted by oil and gas drilling. Business equipment output advanced 0.7% in February, compared to a 0.1% decline registered in the prior month, whereas production of construction supplies increased 1.3% after climbing 1.4% in January. Other data released on Friday showed mood of American shoppers jumped to 97.6 in March, according to the preliminary reading released by the University of Michigan.