Sample Category Title
GBP/USD Decision Zone At 1.24 Key Resistance Line
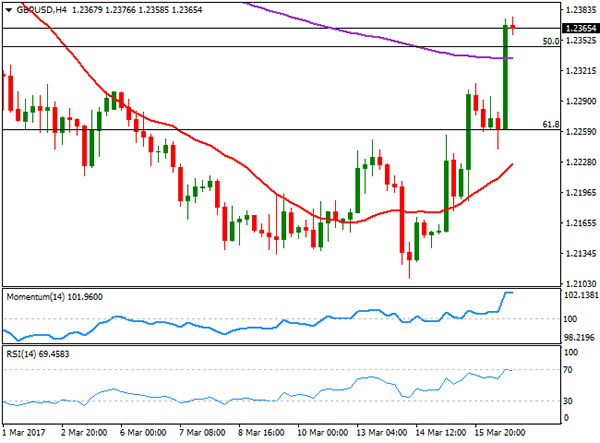
Currency pair GBP/USD
The GBP/USD bullish retracement is not showing any signs of exhaustion. A break above the resistance trend line (red), which is the bottom of wave 1 (blue), would invalidate the wave 4 (blue). In that case, price is probably building an ABC rather than a 123 (green).
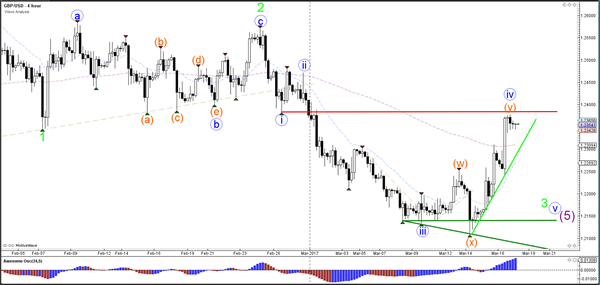
The GBP/USD has reached a critical decision zone where the breakout above resistance (red) or below support (blue/green) would indicate an uptrend or downtrend.
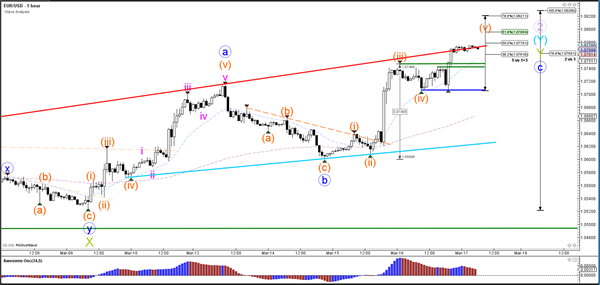
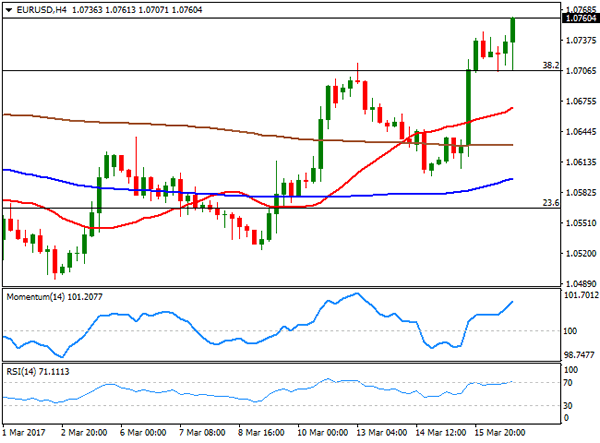
Currency pair EUR/USD
The EUR/USD has reached the 78.6% Fibonacci resistance level of wave 2 (purple). A potential break above the 100% level invalidates the current wave 1-2 (purple) structure. A break below support would confirm a new downtrend within waves 3 (brown/green).
The EUR/USD is facing a resistance trend line (red). A break below the support trend lines (green) could see price test the next support (blue).
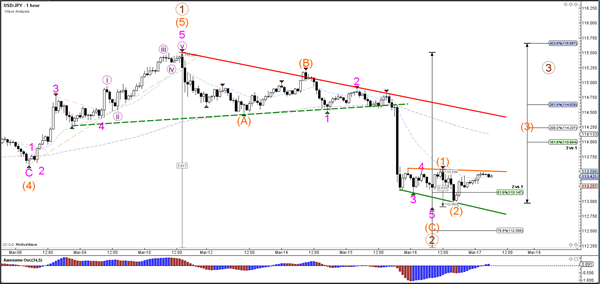
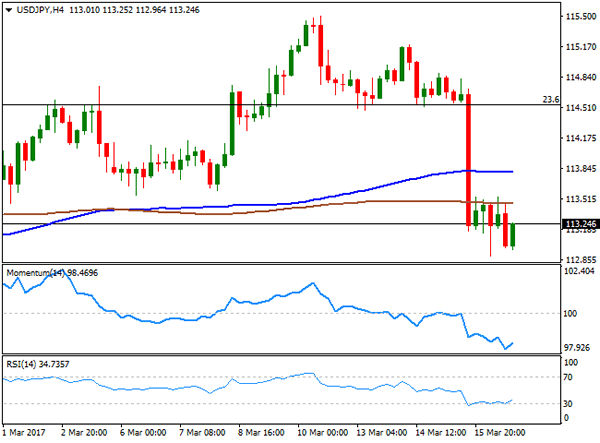
Currency pair USD/JPY
The USD/JPY uptrend stays intact if price manages to stay above the 100% Fibonacci level of wave 2 (blue/brown). The 61.8% and 78.6% Fibonacci levels of wave 2 (brown) are potential support levels.
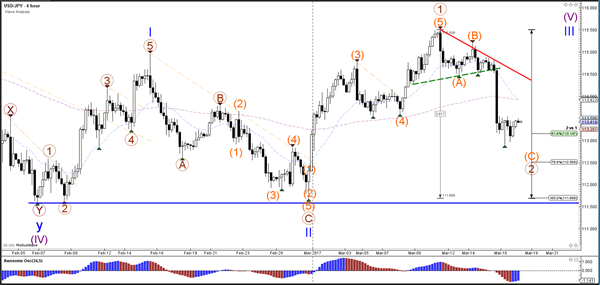
The USD/JPY could be building a bullish turn if price manages to break above resistance (orange).
Asian Market Update: Investors Digest Dovish Fed Hike, Hawkish BOE Hold, And Deleveraging Steps In China
Investors digest dovish Fed hike, hawkish BOE hold, and deleveraging steps in China
US Session Highlights
(US) FEB HOUSING STARTS: 1.29M V 1.26ME; BUILDING PERMITS: 1.21M V 1.27ME; increases in single family starts (highest since 2007) and permits offset declines in multifamily
(US) INITIAL JOBLESS CLAIMS: 241K V 240KE; CONTINUING CLAIMS: 2.03M V 2.05ME
(US) MAR PHILADELPHIA FED BUSINESS OUTLOOK: 32.8 V 30.0E; new orders rise to highest reading since 1987
(US) JAN JOLTS JOB OPENINGS: 5.626M V 5.56ME; quits rate 2.2% v 2.0% prior
(EU) ECB's Nowotny (Austria): ECB strategy for tightening policy will be different from the US Fed; ECB could raise rates before QE ends - Handelsblatt interview
US markets on close: Dow -0.1%, S&P500 -0.2%, Nasdaq flat
Best Sector in S&P500: Financials
Worst Sector in S&P500: Utilities
Biggest gainers: ORCL +6.2%, FTR +4.2%, NRG +2.5%, TDG +2.3%, BEN +2.1%
Biggest losers: BIIB -4.7%, ILMN -3.9%, NEM -3.8%, RIG -3.5%, INCY -2.8%
At the close: VIX 11.2 (-0.4 pts); Treasuries: 2-yr 1.34% (+3bps), 10-yr 2.52% (+1bps), 30-yr 3.14% (+3bps)
US movers afterhours
VSLR: Reports Q4 -$0.41 v -$0.42e, R$41.8M v $39.2Me; Guides Q1 MW installed 43-46 MWs- Guides FY17 MW installed 210-230 MWs; +7.3% afterhours
VRX: ValueAct bought 3M shares from $10.81-10.88/shr on March 14th, adding to existing position (stake increased to 5.2% from 4.4%); +4.3% afterhours
SXC: Said to explore a sale - financial press; +4.1% afterhours
ADBE: Reports Q1 $0.94 v $0.87e, R$1.68B v $1.64Be; +4.0% afterhours
VRAY: Reports Q4 -$0.25 v -$0.34e, R$16.1M v $13.7Me- Guides FY17 Rev $45-50M, primarily from 7 to 8 MRIdian Linac Systems; -3.0% afterhours
SNAK: Delays filing 10K; -8.3% afterhours
CAL: Reports Q4 $0.33 v $0.40e, R$639.5M v $632Me; Guides initial FY17 $2.10-2.20 v $2.39e, Rev $2.7-2.8BB v $2.71Be; -8.6% afterhours
STLD: Guides Q1 $0.77-0.81 v $0.62e; Raises dividend 11% to $0.155 (implied yield 1.7%)
Politics
(US) Pres Trump tweets: "Great progress on healthcare. Improvements being made - Republicans coming together!"
Asia Key economic data:
(NZ) NEW ZEALAND FEB BUSINESS MANUFACTURING PMI: 55.2 V 52.2 PRIOR (4-month high)
(NZ) NEW ZEALAND MAR ANZ CONSUMER CONFIDENCE INDEX: 125.2 V 127.4 PRIOR; M/M:-1.7% V -1.0% PRIOR
(SG) SINGAPORE FEB NON-OIL DOMESTIC EXPORTS M/M: +1.4% V -0.1%E; Y/Y: 21.5% V 12.5%E
(CL) CHILE CENTRAL BANK (BCCH) CUTS OVERNIGHT RATE TARGET BY 25BPS TO 3.00%; AS EXPECTED
Asia Session Notable Observations, Speakers and Press
Asian equities traded mixed, tracking a more subdued session in the US where some of yesterday's flows that followed less hawkish than anticipated Fed were reversed. After a slump in Financials on flatter post-FOMC yield curve, the sector outperformed, while Utilities came in. Australia stocks were weighed down by materials names, even as gold stocks tracked the price of the metal higher. Hang Seng outperformed on strength in gaming stocks.
FX majors were also relatively contained to narrow ranges. EUR/USD saw a pronounced move higher in late US session after comments from Australia Central Bank's Nowotny suggesting ECB could start to raise rates before its QE program is complete. GBP/USD consolidated its post-BOE spike as the decision mentioned price pressures. Dissenter Forbes also clarified his surprise call for a 25bp hike, noting growth and inflation data suggest BOE interest rates should rise. USD/JPY came off its recent lows with a 20pip rise after 3 days of declines. AUD and NZD were both up about 0.1% against USD, paring yesterday's sell-off after soft Australia employment and New Zealand GDP data.
In China, PBoC's reverse repo operations were more tame at CNY60B v CNY80B overnight, and the weekly net drain rose to CNY120B from CNY110B last week. Chinese press report indicates overnight 10bp increase in reverse repo and MLF rates is part of policymakers deleveraging efforts in key sectors of the economy that include steel, coal, non-ferrous metals, and real estate.
Russian aluminum giant Rusal was out with Q4 results that showed rising profitability and better margins, but lower anticipated aluminum demand growth for 2017 at 5.0% vs 5.5% in 2016. China demand forecast was a healthy 6.7% vs non-China's 3.3%.
US State Sec Tillerson kicked off his trip to Asia with a visit to the DMZ. Overnight, he noted that diplomatic efforts on North Korea of past 20 years have failed and a different approach is needed.
China
(CN) China National Energy Administration (NEA): Feb power consumption +17.2% y/y to 448.6B Kwh
(CN) China banks Feb net forex sales $10.1B for clients - Chinese press citing FX Regulator SAFE
(CN) Certain banks in Beijing City said to suspend housing mortgage - financial press
(CN) China final draft of its annual work report included pledge to contain rising home prices in 2017 - Chinese press
(CN) China said to start debt deleveraging in key sectors of economy, including steel, coal, non-ferrous metals, real estate - Chinese press
Australia/New Zealand
(NZ) Credit Suisse: RBNZ to begin removing accommodative policy settings starting in May 2018 - press
(NZ) ASB: Next week's RBNZ policy statement to remain neutral - press
Korea
(KR) BOK Dep Gov Jang: US interest rate is an important reference index, but our policy stance takes consideration of our own condition - Korean press
Asian Equity Indices/Futures (00:00ET)
Nikkei -0.4%, Hang Seng +0.3%, Shanghai Composite -0.2%, ASX200 +0.4%, Kospi +0.4%
Equity Futures: S&P500 +0.2%; Nasdaq +0.2%; Dax +0.6%; FTSE100 +0.2%
FX ranges/Commodities/Fixed Income (00:00ET)
EUR 1.0760-1.0775 JPY 113.25-113.50; AUD 0.7665-0.7685; NZD 0.6975-0.6990
Apr Gold -0.1% at $1,226/oz; Apr Crude Oil +0.3% at $48.87/brl; May Copper -0.2% at $2.67/lb
SPDR Gold Trust ETF daily holdings fall 2.3 tonnes to 837.1 tonnes; first decline since Mar 10th
(CN) PBOC SETS YUAN MID POINT AT 6.8873 V 6.8862 PRIOR
(CN) PBOC to inject combined CNY60B v CNY80B prior in 7,14, and 28-day reverse repos; Drains net CNY120B this week v drained CNY110B prior
(AU) Australia MoF (AOFM) sells A$700M in 3.25% 2029 Bonds; avg yield: 3.037%; bid-to-cover: 3.75x
(CN) China MOF sells 91-day bonds, avg yield 2.7441%
Asia equities / Notables / movers by sector
Consumer discretionary: SXL.AU Southern Cross Media Group -3.8% (Morgan Stanley cuts rating); MYR.AU Myer +5.3% (Macquarie raises rating); 1929.HK Chow Tai Fook Jewellery Group Ltd -0.6% (acquisition); 7453.JP Ryohin Keikaku Co. +2.1% (Muji cleared of China food claims); 9681.JPTokyo Dome Corp. -3.4% (FY16/17 result)
Financials: 000002.CN China Vanke Co +2.2% (agreement between China Evergrande and SZMC)
Industrials: 1366.HK Jiangnan Group +6.9% (FY16 result); 293.HK Cathay Pacific Airways +1.6% (cut costs); 2333.HK Great Wall Motor -6.9%, 000625.CN Chongqing Changan Automobile -0.8% (concern on deeper discounts weighing on earnings); 6448.JPBrother Industries +1.7% (Mitsubishi initiates with overweight); 4042.JPTosoh Corp. -2.0% (guidance)
Technology: 6502.JP Toshiba Corporation +5.0% (Japan govt not consider public fund for co); 903.HK TPV Technology +7.7% (FY16 result)
Materials: ORE.AU Orocobre +4.7% (sold projects from Argentine unit); 486.HK RUSAL +2.0% (Q4 result)
Energy: 1088.HK China Shenhua Energy +1.8% (Feb result)
Utilities: 9501.JP Tokyo Electric Power Co -1.4% (to decommission units)
Daily Technical Outlook And Review
A note on lower timeframe confirming price action...
Waiting for lower timeframe confirmation is our main tool to confirm strength within higher timeframe zones, and has really been the key to our trading success. It takes a little time to understand the subtle nuances, however, as each trade is never the same, but once you master the rhythm so to speak, you will be saved from countless unnecessary losing trades. The following is a list of what we look for:
- A break/retest of supply or demand dependent on which way you're trading.
- A trendline break/retest.
- Buying/selling tails ... essentially we look for a cluster of very obvious spikes off of lower timeframe support and resistance levels within the higher timeframe zone.
- Candlestick patterns. We tend to only stick with pin bars and engulfing bars as these have proven to be the most effective.
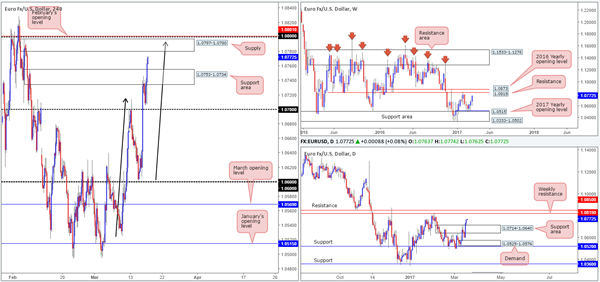
EUR/USD
The single currency is marginally stronger today after the pair endured and finally conquered the H4 supply zone at 1.0753-1.0734. In view of the unit's close proximity to a H4 supply at 1.0797-1.0780, what's likely in store for this major today? Well, the current H4 supply is a rather interesting barrier. Not only does it boast February's opening level at 1.0801 and the 1.08 handle a few pips above, but it also houses a possible H4 AB=CD (black arrows) bearish completion point (0.0793) taken from the low 1.0525.
What's also notable from a technical perspective is the weekly resistance hurdle drawn from 1.0819. This is, on both the weekly and daily charts, the next upside target in view. As such, for traders interested in shorting from the aforementioned H4 supply area will need to prepare for the possibility of a fakeout up to this weekly level!
Our suggestions: Rather than placing a pending sell order within our current H4 supply and setting a stop in order to try and cover the possibility of a fakeout, our desk has decided to wait and see if the fakeout occurs before entering this market. In the event that our analysis is correct and the fakeout does indeed take place, we may look to enter on the close of the fakeout candle and place stops beyond its high. It could prove to be one of those monster trades given that we're dealing with the weekly timeframe, so it is certainly worth the wait!
Data points to consider: US prelim UoM consumer sentiment at 2pm GMT.
Levels to watch/live orders:
- Buys: Flat (stop loss: N/A).
- Sells: 1.0797-1.0780 ([wait for price to fake above this area to 1.0819 before considering shorts] stop loss: ideally beyond the fakeout candle).
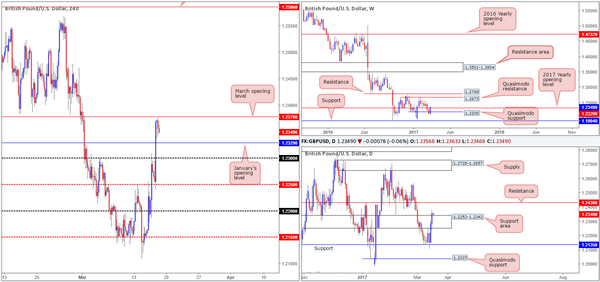
GBP/USD
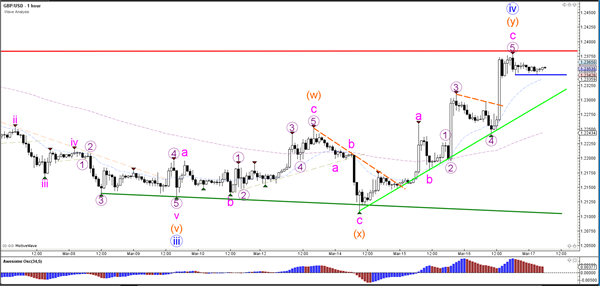
GBP bulls rose up and took charge after retesting the H4 mid-way level at 1.2250 during London's lunchtime. The explosive move from this number was fuelled by a surprisingly hawkish BoE. January's opening base line at 1.2329 was taken out in one fell swoop, with the pair only starting to show a sign of stabilizing once price came within striking distance of March's opening line at 1.2378. What this latest advance also accomplished was a close above the daily resistance area at 1.2252-1.2342 (now a potential support zone), which may open the gates for price to challenge daily resistance at 1.2430.
Our suggestions: Until we witness a weekly close beyond January's opening level, we are not giving the recent daily break much acknowledgment. However, at the same time we are not willing to risk trading short based on this! With that being the case, we feel it's best to remain on the sidelines today and reassess going into the new week.
Data points to consider: US prelim UoM consumer sentiment at 2pm GMT.
Levels to watch/live orders:
- Buys: Flat (stop loss: N/A).
- Sells: Flat (stop loss: N/A).
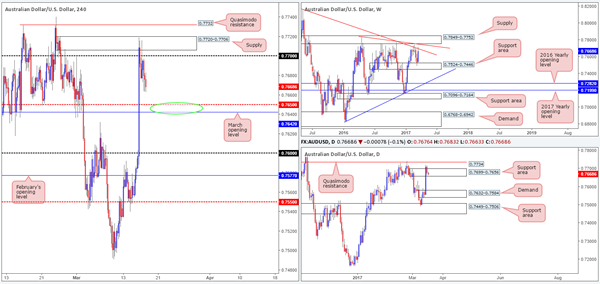
AUD/USD
Australian employment figures came in lower than expected yesterday, consequently sending the pair south. As a result of this, the H4 candles failed to sustain gains beyond the 0.77 handle, whilst the H4 supply at 0.7720-0.7706 remained intact.
Seeing as how daily action continues to trade within the walls of a daily support area seen at 0.7699-0.7656, and weekly price appears to be showing a sign of weakness after connecting with the weekly trendline resistance stretched from the high 0.8163, trading from current price is tricky, in our opinion.
While there's a possibility of a bounce being seen from the nearby 0.7642/0.7650 neighborhood (green circle – March opening line and H4 mid-way support), we still have a keen interest in the H4 Quasimodo resistance seen beyond the current H4 supply at 0.7732.
Our suggestions: 0.7732 converges closely with a daily Quasimodo resistance line at 0.7734, and is also positioned nearby weekly supply at 0.7849-0.7752, which happens to merge nicely with another weekly trendline resistance taken from the high 0.7835. As highlighted in yesterday's report, we would, dependent on the time of day, likely look to go in aggressive at 0.7732 and place stops above the apex high at 0.7740. However, given the current distance from this barrier, this may be a level for next week.
Data points to consider: US prelim UoM consumer sentiment at 2pm GMT.
Levels to watch/live orders:
- Buys: Flat (stop loss: N/A).
- Sells: 0.7732 (Stop loss: 0.7742).
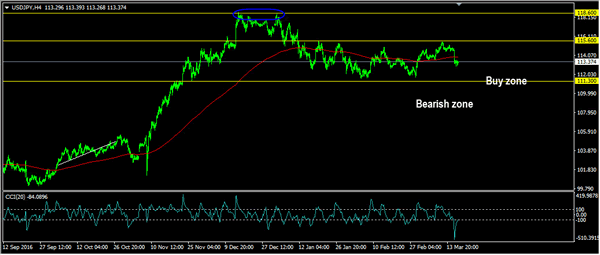
USD/JPY
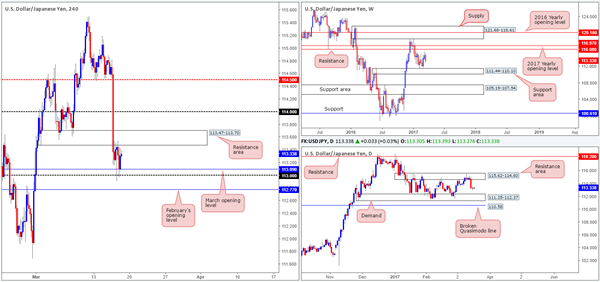
Despite Wednesday's aggressive selloff, the USD/JPY pair was reasonably lackluster during the course of yesterday's sessions. Looking at the H4 structure this morning, we can see that the H4 candles are capped between a H4 resistance area 113.47-113.70 and the 1.08 handle/ March opening level at 113.09. Looking over to the bigger picture, both the weekly and daily charts indicate room to extend lower this week. The closest support structure can be seen at 111.35-112.37: a daily demand zone which sits around the top edge of a weekly support area drawn from 111.44-110.10.
Our suggestions: Despite the higher-timeframe picture suggesting that shorts are the best bet, there's little wiggle room seen beyond the current H4 range as February's opening level at 112.77 sits nearby! Consequent to this, we do not see a lot to hang our hat on at the moment.
Data points to consider: US prelim UoM consumer sentiment at 2pm GMT.
Levels to watch/live orders:
- Buys: Flat (stop loss: N/A).
- Sells: Flat (stop loss: N/A).
USD/CAD
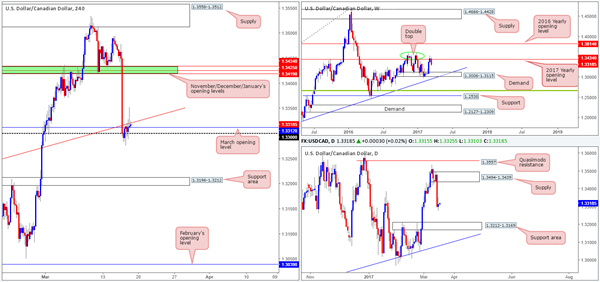
The USD/CAD took on more of a subdued stance yesterday, following Wednesday's aggressive selloff. Despite the pair catching fresh bids from the 1.33 neighborhood, the nearby H4 trendline resistance extended from the high 1.3171 has done a superb job in holding the unit lower.
As far as we're concerned, other than the 1.33 boundary, there's very little support structure seen in this market until we connect with the H4 support area coming in at 1.3196-1.3212 (fixed within a daily support area at 1.3212-1.3169). To that end, our team is ultimately looking to sell beyond 1.33 today.
Our suggestions: Supposing that we happen to see a H4 close print below 1.33 followed up with a retest as resistance, and a reasonably sized H4 bearish candle, we will be all over this, targeting the aforementioned H4 support area.
Data points to consider: US prelim UoM consumer sentiment at 2pm. Canadian manufacturing sales at 12.30pm GMT.
Levels to watch/live orders:
- Buys: Flat (stop loss: N/A).
- Sells: Watch for price to engulf 1.33 and then look to trade any retest seen thereafter ([waiting for a reasonably sized H4 bear candle to form following the retest is advised before pulling the trigger] stop loss: ideally beyond the trigger candle).
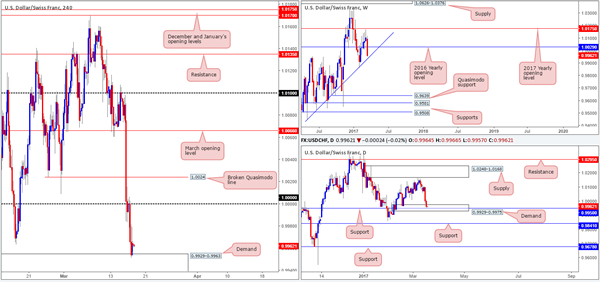
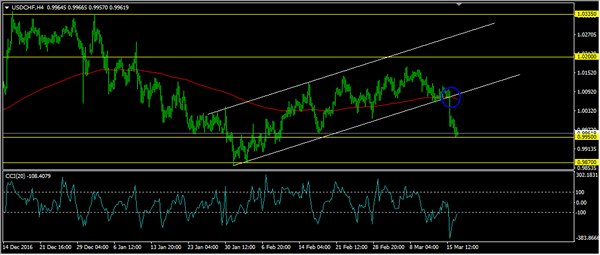
USD/CHF
Beginning with a look at the weekly chart this morning, price is currently seen within touching distance of the weekly trendline support etched from the low 0.9443. Along the same vein, daily flow recently came within an inch of connecting with daily support at 0.9950, which is seen fixed within daily demand at 0.9929-0.9975.
Swinging across to the H4 chart, we can see that price has also shaken hands with a H4 demand base coming in at 0.9929-0.9963. As this demand sits within the confines of the current daily demand which also intersects beautifully with the above noted weekly trendline support, we have a keen interest in buying this market.
Our suggestions: Ideally, before we look to press the buy button here, however, we'd like to see the weekly trendline support tested. Assuming that a reasonably sized H4 bull candle forms off this line, this will be our cue to enter long, as by that point all three timeframes will be trading in unison.
Data points to consider: US prelim UoM consumer sentiment at 2pm GMT.
Levels to watch/live orders:
- Buys: 0.9929-0.9963 ([waiting for a reasonably sized H4 bull candle to form off the current weekly trendline support is advised before pulling the trigger] stop loss: ideally beyond the trigger candle).
- Sells: Flat (stop loss: N/A).
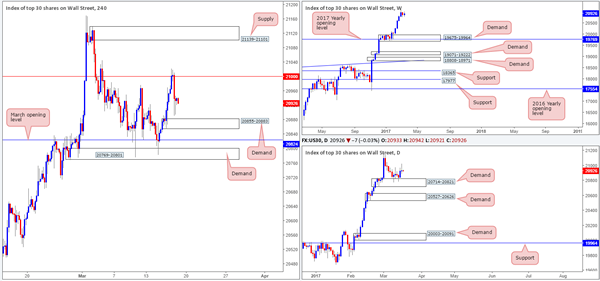
DOW 30
Although price closed marginally higher yesterday, US equities did selloff from the 21000 mark and came within an inch of clipping the top edge of a H4 demand base pegged at 20855-20883. Even though both the weekly and daily charts show little resistance on the horizon, we still cannot afford to buy this market just yet. Once, or indeed if, the 21000 H4 resistance is conquered, we will then have a relatively free run up until the H4 supply zone picked at 21139-21101.
Our suggestions: Quite simply, we're still watching for a H4 close to print beyond the 21000 perimeter. In the event that this comes into view, and price retests 21000 as support and prints a reasonably sized H4 bull candle, we would consider entering long from here, targeting the aforementioned H4 supply and possibly beyond.
Data points to consider: US prelim UoM consumer sentiment at 2pm GMT.
Levels to watch/live orders:
- Buys: Watch for price to engulf 21000 and then look to trade any retest seen thereafter ([waiting for a reasonably sized H4 bull candle to form following the retest is advised before pulling the trigger] stop loss: ideally beyond the trigger candle).
- Sells: Flat (stop loss: N/A).
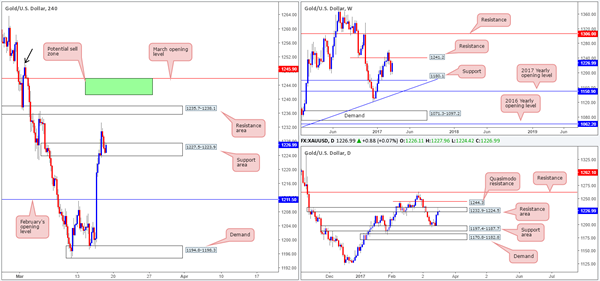
GOLD
In recent trading, the yellow metal sold off from a session high of 1233.4 and ended the day closing within the walls of a H4 support zone at 1227.5-1223.9. While it may be tempting to buy from this region, one must remain cognizant of the daily candles trading within a daily resistance area coming in at 1232.9-1224.5. On the other side of the ledger, nevertheless, weekly still price looks poised to extend north up to the 1241.2 resistance level.
Although a buy from the current H4 support area is not something we'd label high probability, a sell from the daily Quasimodo resistance level at 1244.3 most certainly is. Not only is this barrier a strong line in and of itself, let's also remember that it is positioned nearby a weekly resistance line seen a little lower at 1241.2 and March's opening level at 1245.9.With that being the case, we have a potential reversal zone fixed between 1245.9/1241.2 (green area on the H4 chart).
Our suggestions: 1245.9/1241.2 is our only area of interest this morning. To be on the safe side here, nonetheless we would strongly advise placing stops above 1250.5 (H4 supply high marked with a black arrow).
Levels to watch/live orders:
- Buys: Flat (stop loss: N/A).
- Sells: 1245.9/1241.2 region (stop loss: 1251.5).
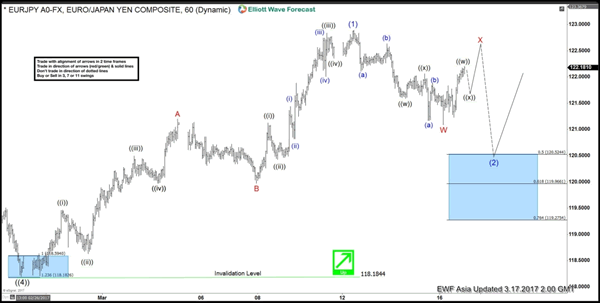
EURJPY Elliott Wave View: Correction In Progress
Short term Elliott Wave view in EURJPY suggests that the decline to 118.18 on 2/24 ended Primary wave ((4)). Primary wave ((5)) is currently in progress higher and the rally from Primary wave ((4)) low at 118.18 is unfolding as an ending diagonal Elliott wave structure where Intermediate wave (1) ended at 122.88. The subwaves of Intermediate wave (1) takes the form of a zigzag Elliott wave structure where Minor wave A ended at 121.19, Minor wave B ended at 119.97, and Minor wave C of (1) ended at 122.88.
Revised view suggests that Intermediate wave (2) pullback is still in progress in 7 swing or a double three structure where Minor wave W ended at 121.087. While Minor wave X bounce fails below 122.88, pair has scope to turn lower one more leg in Minor wave Y of (2) towards 119.27 – 120.52 area before the rally resumes. We don’t like selling the proposed pullback and expect buyers appear at 119.27 – 120.52 area for an extension higher or at least 3 waves bounce as far as pivot at 118.18 low stays intact. If pair breaks above 122.88 from here, that will suggest that Intermediate wave (2) has ended at 121.087 and pair has resumed the rally higher.
EURJPY 1 Hour Chart
ECB’s Nowotny Hints At Coming Rate Hikes For The Euro
Key Points:
- ECB Nowotny suggests rate hikes on the way for the Eurozone.
- Central Bank may increase deposit rates but leave prime unchanged.
- QE program likely to continue regardless of policy tightening.
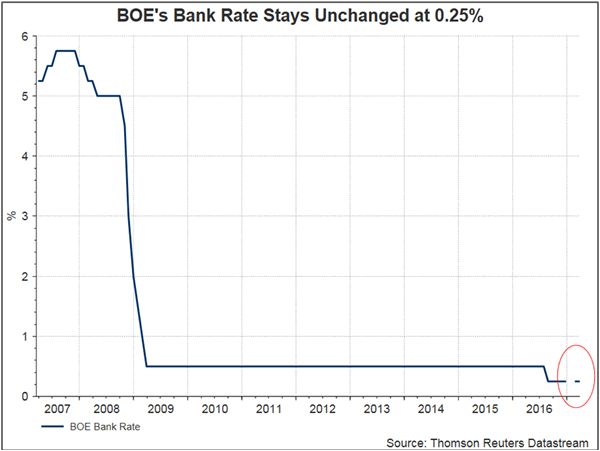
The last 24 hours has been an interesting watershed moment in monetary policy as the U.S. Federal Reserve raised the FFR 25bps and purportedly is now embarking on a cycle of tightening. In addition, the Bank of England, although holding rates steady at 0.25%, also heralded a significantly more hawkish than expected view. However, it was a surprising statement from the European Central Bank that caught the market by surprise as the ECB's Nowotny suggested that rate hikes could be on the way for the Eurozone.
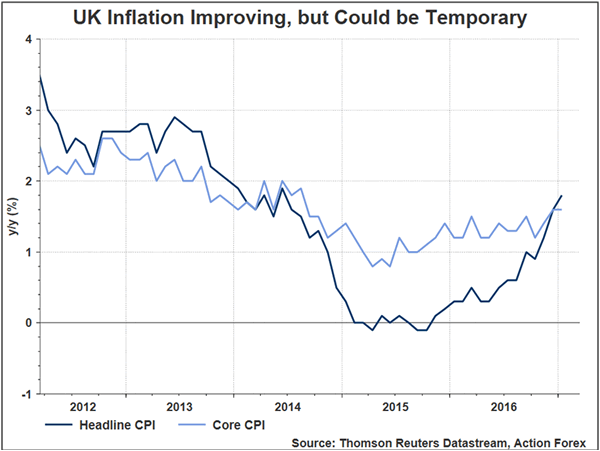
Subsequently, it would appear that after years of an extraordinary stimulus package that the Eurozone may be resuming a period of building inflation pressures. Certainly the latest round of CPI data seems to concur with the overall view that strong inflation is on the way with January and February posting 1.8%, and 2.0% gains respectively. However, GDP growth is still languishing behind the curve, with last quarter's anaemic 0.4% print, and will have to increase significantly to see the sort of gains that could support genuine inflationary pressures.
In addition, the EU's quantitative easing (QE) program is still ongoing and this is likely distorting much of the CPI data as the central bank continues to pump large amounts of money into the economy via bond markets. Subsequently, it would make little intuitive sense to raise rates whilst at the same time the ECB continues stimulating the economy.
The reality is that what most concerns the ECB currently is the malaise within the Eurozone's banking sector and potential risk that is ever present. Currently, most continental bank's margins are being squeezed by the central banks negative interest rate policy. The deposit rate presently sits at -0.40% and this is a cost that is typically unable to be passed on to consumers and is therefore absorbed. Subsequently, any move by the ECB to raise rates could help alleviate that profit gap for the big banks and allow them to recapitalise over a period of time, without the need for bailouts.
However, this sort of monetary policy mix of QE and rate hikes is not without its risks as expectations plays a critical role in the central bank's ability to shape forward expectations. In fact, any move to undertake a rate hike by stealth could back fire dramatically if the ECB gets the tone of their message wrong and business and consumer confidence takes a dive. Any such misfire of the policy mix could see things turn relatively toxic for the ECB and damage their ability to shape forward guidance in the future.
USDCHF Ready To Rebound
Key Points:
- A reversal is expected in the near-term.
- Ascending trend line is now coming into play.
- The pair has become highly oversold.
The Swissy's severe losses could be about to be put on pause if the technical bias is anything to go by. Specifically, the pair has moved into conflict with some robust support and a number of other technical readings are suggesting that a near-term reversal is now on the cards. Furthermore, the impending US data could provide the momentum needed to turn the USDCHF around in the final session of the week, making it worthwhilewatching this pair.
Starting with the technical bias, as mentioned above, one key reason a reversal is now forecasted for this pair is a strong zone of support around the 0.9951 level. Historically, this point has proven to be a reversal zone which will have the bears taking a more cautious approach moving ahead. Moreover, the bulls will be emboldened by the USDCHF's proximity to the ascending trend line which will likely begin to exert some buying pressure in the very near-term.
Some other technical readings that signal upsides are likely on the horizon are the stochastics and the Bollinger bands. Starting with the stochastic oscillator, this is highly oversold which will certainly be generating some buoyancy moving ahead. As for the Bollinger bands, the extreme selling pressure of the past few sessions has pushed price action below the lower band which should mean that the pair now seeks to regress back to the basis line.
Whilst the evidence for a reversal is quite robust, it is not expected that the entirety of the recent bearish price action is eroded. Predominantly, the presence of some dynamic resistance courtesy of the 100 day EMA and the 38.2% Fibonacci retracement suggests that gains will be capped around the 1.0050 mark. However, with an assist from some bullish fundamentals, the rally could extend beyond this point.
Speaking of which, the fundamental news to keep an eye on will largely come from the US front. Notably, the US Industrial Production and Preliminary Michigan Consumer Sentiment Figures are due out as the week winds down and could generate some buoyancy for this pair. Additionally, if Trump can avoid sparking any controversy as the week comes to an end, the Franc could weaken against the USD as the perceived political risks strengthening it subside.
Ultimately, the mix of fundamental and technical forces described above should see a rally in the next session or two so keep an eye on the Swissy. Specifically, that ascending trend line should come into play, especially if the fundamentals come in better than forecast. However, watch out for any potential breakouts that could result from political turmoil stemming from either Trump or the ongoing Brexit saga.
European Open Briefing
Global Markets:
- Asian stock markets: Nikkei down 0.30 %, Shanghai Composite fell 0.25 %, Hang Seng rose 0.30 %, ASX 200 gained 0.35 %
- Commodities: Gold at $1226 (+0.01 %), Silver at $17.30 (-0.20 %), WTI Oil at $48.90 (+0.25 %), Brent Oil at $51.80 (+0.15 %)
- Rates: German 10 year yield at 0.44, UK 10 year yield at 1.26, US 10 year yield at 2.54
News & Data:
- NZ ANZ Consumer Confidence (MoM) (Mar): -1.70% (prev -1.00%)
- NZ ANZ Consumer Confidence Index (Mar): 125.2 (prev 127.4)
- Wall Street slips with healthcare stocks, Nasdaq flat
- Oil prices mark time, set for small weekly rise
Markets Update:
The US Dollar came under further pressure overnight. While the Fed hiked rates on Wednesday, it did not signal that further hikes will follow soon and remained rather cautious. This triggered position covering from USD longs and brought the currency under pressure against most other G10 peers.
EURUSD rallied to 1.0780 overnight. Traders and investors were relieved about the election victory in the Netherlands, and seem now a little bit less worried about the upcoming French elections. This supported the Euro, and it rose against most other major currencies as well.
Meanwhile, the British Pound rallied. Despite the on-going Brexit worries, GBP caught a bid after the BoE meeting. It reached a high of 1.2357 in Asia. Should it break above that resistance level, the next big level to watch is 1.25.
Upcoming Events:
- 10:00 GMT – Euro Zone Trade Balance
- 14:15 GMT – US Industrial Production
- 13:15 GMT – US Manufacturing Production
- 14:00 GMT – US Michigan Consumer Sentiment
Daily Technical Analysis
EURUSD
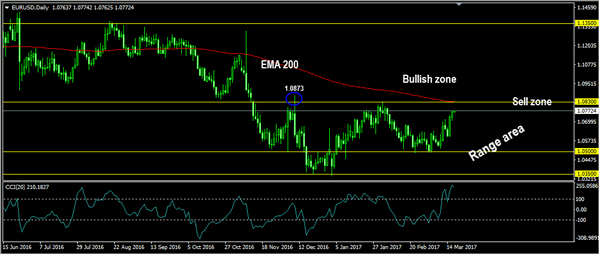
The EURUSD continued its bullish momentum yesterday topped at 1.0770. The bias remains bullish in nearest term testing 1.0830 area located at the daily EMA 200 as you can see on my daily chart below which is a good place to sell with a tight stop loss above 1.0873. Immediate support is seen around 1.0710. A clear break below that area could lead price to neutral zone in nearest term testing 1.0650 support area. On the upside, a clear break and daily/weekly close above 1.0830 – 1.0873 would activate my bullish mode.
GBPUSD
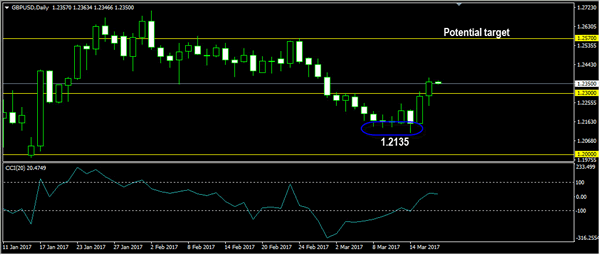
The GBPUSD continued its bullish momentum yesterday topped at 1.2376 as a part of the bullish scenario after bounced from triple bottom formation at 1.2135. The bias remains bullish in nearest term testing 1.2450 area. Immediate support is seen around 1.2300. A clear break below that area could lead price to neutral zone in nearest term testing 1.2250/25 area. On the upside, a clear break and daily/weekly close above 1.2450 would expose 1.2570 – 1.2600 region next week. Overall I remain neutral.
USDJPY
The USDJPY was indecisive yesterday. The bias is neutral in nearest term. Immediate support is seen around 112.90 (yesterday’s low). A clear break below that area could trigger further bearish pressure testing 112.50 but key support remains at 111.30 area which is a good place to buy with a tight stop loss. Immediate resistance is seen around 113.50. A clear break above that area could trigger further bullish pressure testing 114.00 or higher.
USDCHF
The USDCHF continued its bearish momentum yesterday bottomed at 0.9951. The bias remains bearish in nearest term testing 0.9870 support area. Immediate resistance is seen around 0.9985. A clear break above that area could lead price to neutral zone in nearest term testing 1.0020/50 area. Overall I remain neutral.
Forbes’ Dissent Would Unlikely Speed Up BOE’s Rate Hike Schedule
To our, and the market's, surprise, BOE's Kristin Forbes voted in favor of a 25 bps rate hike in March. While this had not altered the decision of keeping the Bank rate unchanged at 0.25%, the overall message sent to the public has now become more hawkish. The members voted unanimously to leave the government bond purchases at 435B pound and corporate bond purchases at up to 10B pound. Adding to the rising speculations of tightening is the minutes, which suggested that some of those who voted for unchanged policy believed 'it would take relatively little further upside news on the prospects for activity or inflation for them to consider that a more immediate reduction in policy support might be warranted'. GBPUSD jumped to a 2-week high of 1.2376 after the announcement, before settling at 1.2358, up +0.55%.
Leaving the MPC in June, Forbes has been the most hawkish member of the committee. Yet, she had not called for a rate hike until the March meeting. As she explained in an article written for Daily Telegraph, Forbes noted that 'although wage growth has been disappointing, this likely reflects temporary caution around Brexit,'. She added that the 'softening' on consumer spending 'should only be moderate, due to support from resilient consumer confidence, solid house prices, low unemployment, and easy access to cheap credit'. While there are 'risks consumers could pull back more sharply — but these are still just risks'.
It is not only the hawkishness of Forbes that sent tightening speculations higher. Indeed, the minutes signaled that other members have turned more confident over the economic outlook. For the eight members who voted to keep the policy rate unchanged, they cited subdued pay growth, slacks in the labour market and the squeeze in households' real income growth as the factors for maintaining the status quo. They also noted the uncertainty over post-Brexit trading arrangements would pose 'downside risk to the activity outlook'. However, they added that 'with inflation rising sharply, and only mixed evidence on slowing activity domestically, some members noted that it would take relatively little further upside news on the prospects for activity or inflation for them to consider that a more immediate reduction in policy support might be warranted'. This is definitely a more hawkish move, as the February minutes noted that 'for some members, the risks around the trade-off embodied in the central projection meant they had moved a little closer to those limits'.
Although the members appeared more hawkish than previously, we expect that BOE would remain on hold throughout the year. First, Forbes would leave the MPC at the end of June. Her successor could be less hawkish, rebalancing the committee towards a less bullish team. Second, the expected economic growth slowdown could be felt more deeply, offsetting the strong inflation which could prove temporary.
Foreign Exchange Market Commentary
EUR/USD
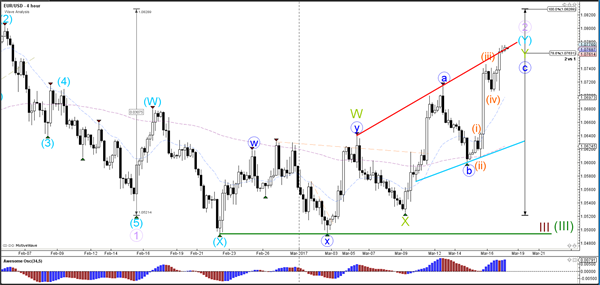
After spending the day in a tight 40 pips range, the EUR/USD pair soared to a fresh 1-month high above 1.0760, following comments from ECB's Nowotny, governor of the Austrian National Bank and a member of the Governing Council , after he said that rate hikes could be done in a different manner from Fed, and that a "rate increase may be on the way." The greenback remained weak after Wednesday's Fed's decision, whilst the common currency find support in the Dutch election's outcome, as the far-left Party for Freedom came in second with 20 seats, whilst the ruling party won 33 seats, bringing some relief to the EU, diminishing fears that populism is taking over Europe.
In the data front, EU February final inflation figures matched expectations, with inflation confirmed at 2.0% in the month against 1.8% in January. In the US, and for the week ending March 11, initial jobless claims were of 241,000, down 2,000 from the previous week, although above market's expectations of 240K. Housing starts surged to a fresh 4-month high to a 1.288 million annualized rate, surpassing expectations, although Building permits missed expectations, surging by 1.213 million.
As for the technical outlook, the EUR/USD pair retains a bullish stance as it held well above 1.0700, now breaking also above the previous weekly high. In the 4 hours chart, the 20 SMA heads north after advancing beyond the 100 and 200 SMAs, whilst technical indicators have resumed their advances near overbought territory, favoring additional gains for the upcoming sessions, towards 1.0820, the 50% retracement of the post-US election decline.
Support levels: 1.0745 1.0710 1.0660
Resistance levels: 1.0785 1.0820 1.0860
USD/JPY
The USD/JPY pair established around 113.25 ahead of Friday's opening, recovering partially from a fresh 2-week low of 112.90 achieved at the beginning of the day. The Bank of Japan has its monetary policy meeting right after US Federal Reserve one, but decided to make no changes to its ongoing stimulus programs. In fact, Governor Kuroda said that an uptick in inflation towards 1% won't immediately trigger an interest rate hike, indicating that the Central Bank has no plans to modify the monetary status quo, and that the economy still needs massive stimulus to fight deflation. Despite soft, US housing and employment data was enough to prevent the pair from falling further, albeit not enough to revert the negative tone triggered by the Fed. Technically, the 4 hours chart shows that selling interest contained advances around a horizontal 200 SMA, in the 113.50 region, while the 100 SMA stands above it, also lacking directional strength. Indicators in the mentioned chart have bounced modestly from oversold readings, but are far from suggesting a change in the dominant trend. Renewed selling interest below the mentioned daily low should see the pair resuming its decline towards 112.00 a long term Fibonacci support.
Support levels: 112.90 112.50 112.10
Resistance levels: 113.50 114.00 114.50
GBP/USD
The GBP/USD pair soared to a fresh 2-week high of 1.2376, holding nearby at the end of the day. The rally came after the BOE's monetary policy meeting, as despite the Central Bank left its policy unchanged, there was one dissenter among the MPC member, Christine Forbes. Forbes considered that given that inflation is projected to remain above-target for the next years, while growth is showing signs of slowing, a rake hike was compelling. Additionally, the Minutes of the meeting said that “with inflation rising sharply, and only mixed evidence on slowing activity domestically, some members noted that would take relatively little further upside news on the prospects for activity or inflation for them to consider that a more immediate reduction in policy support might be warranted.” Brexit jitters have been left aside temporarily, although they may return to the market once the Central Banks´ feast euphoria eases. The 4 hours chart shows that the pair has settled above 1.2345, the 50% retracement of the January rally and February's monthly low, while the price has advanced far above a bullish 20 SMA, and also beyond the 200 SMA for the first time this March. Technical indicators in the mentioned time frame have lost upward momentum and turned fat in overbought territory, not enough to confirm a downward move. Additional advances expose the 1.2425 level, the 38.2% retracement of the same rally.
Support levels: 1.2345 1.2300 1.2260
Resistance levels: 1.2380 1.2425 1.2470
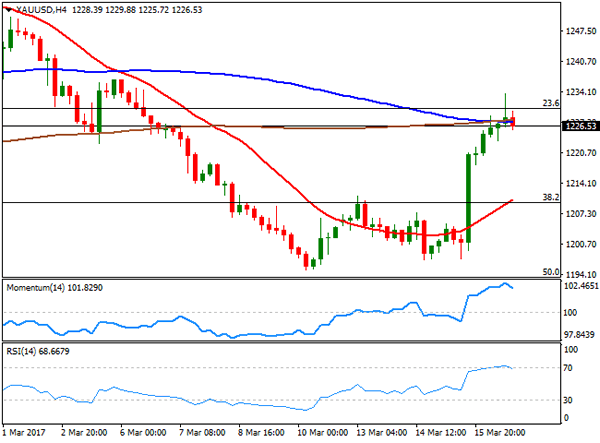
GOLD
Gold prices continued advancing this Thursday, with spot reaching $1,233.62 a troy ounce, to settle at 1,226.60. The sharp advance in the commodity came after the US Federal Reserve indicated that they won't accelerate the pace of tightening. Gains were contained by increasing optimism after Dutch elections that fueled demand for higher yielding assets. The daily chart for the commodity shows that the price settled below its 20 DMA and a Fibonacci resistance, the 23.6% retracement of the latest daily bullish run at 1,230.10, holding also far below a bearish 200 DMA, currently at 1,250.65. This last, capped February's rally. In the same chart, technical indicators have extended their recoveries, with the Momentum still below the 100 level and the RSI at 53. In the 4 hours chart, the price is struggling around the 100 and 200 SMAs, both converging around 1,227.00, while technical indicators have turned modestly lower, still holding within overbought territory. Should the price extend beyond the mentioned 1,230.10, the risk turns towards the upside for this Friday.
Support levels: 1,223.15 1,212,90 1,203.30
Resistance levels: 1,230.10 1,242.50 1,250.65
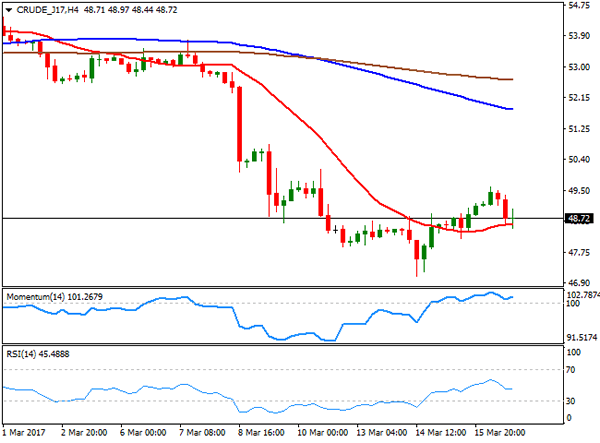
WTI CRUDE
Crude oil prices managed to extend their advances at the beginning of the day, but later retreated, with West Texas Intermediate crude futures settling at $48.70 a barrel after peaking at 49.60 at the beginning of the day. Concerns about rising output in the US weighed on the commodity, despite the latest EIA report showing that stockpiles decreased for the first in the past ten weeks. The daily chart shows that the commodity advanced briefly, but settled below the 200 DMA, currently at 49.10, while technical indicators have turned flat in oversold territory after a modest upward correction, indicating that buying interest remains limited. In the 4 hours chart, the price is standing a few cents above a flat 20 SMA, while technical indicators have pulled back towards their mid-lines, now attempting to bounce, but still within neutral territory.
Support levels: 48.00 47.30 46.65
Resistance levels: 49.10 49.75 50.50
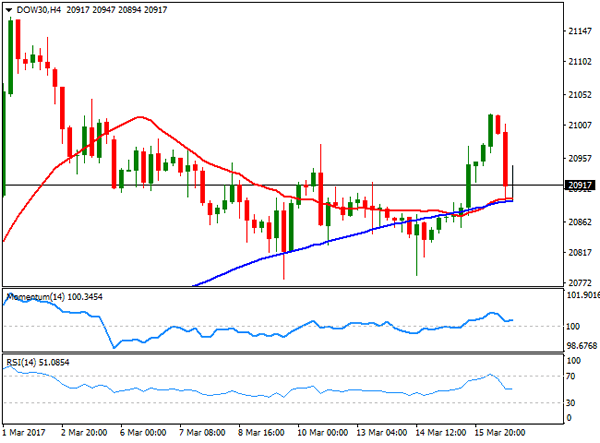
DJIA
US indexes closed mixed, but not far from their daily openings. The Nasdaq Composite advanced less than 1 point, and closed at 5,900.76, while the S&P and the Dow closed in the red, with the first down 3 points to 2,381.38 and the DJIA shedding 15 points or 0.07%, to 20,934.55, as investors continued to digest the latest Fed's announcement. Within the Dow, most members closed lower, with oil-related equities leading the decline as the commodity failed to extend its latest recovery. El du Pont was the worst performer, closing 1.08% lower, followed by Chevron that shed 0.94%. Financials were among the best performers, with American Express up 0.68% and Goldman Sachs adding 0.58%. The index's daily chart shows that it held again above its 20 DMA that anyway has partially lost its upward strength, whilst technical indicators erased the positive momentum gained on Wednesday, although hold within positive territory. In the 4 hours chart technical indicators have also lost their bullish strength, now flat above their mid-lines, whilst the 20 and 100 SMAs converge at 20,900, providing an immediate support that if broken, could lead to a deeper correction.
Support levels: 20,900 20,852 20,817
Resistance levels: 20,978 21,015 21,064
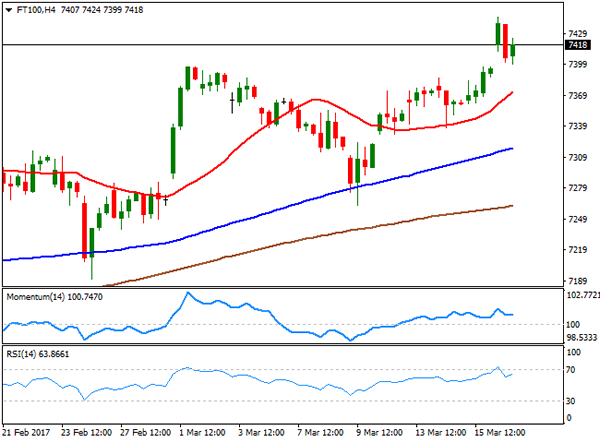
FTSE 100
The FTSE 100 closed at a record high of 7,415.95, up by 47 points or 0.64%. The index got a boost from mining-related equities, as a weaker dollar fueled the recovery of base metals. The Footsie reached an all-time high of 7,445, although a strong advance in the Pound weighed on equities mid London session. The top performers were Anglo American closing the day 8.62% higher, Glencore adding 5.01% and Antofagasta surging by 4.65%. Hikma Pharmaceuticals was the worst performer, down by 4.66%. The daily chart shows an increasing upward potential, as the Momentum indicator finally advanced from neutral territory, heading now north at fresh 2-month highs, whilst the RSI indicator also heads sharply higher around 68, and the index holds above all of its moving averages. In the 4 hours chart, technical indicators resumed their advances within positive territory after correcting overbought conditions, whilst the 20 SMA has accelerated its advance below the current level, supporting additional advances as long as Pound's rally remains contained.
Support levels: 7,399 7,363 7,338
Resistance levels: 7,445 7,480 7,510
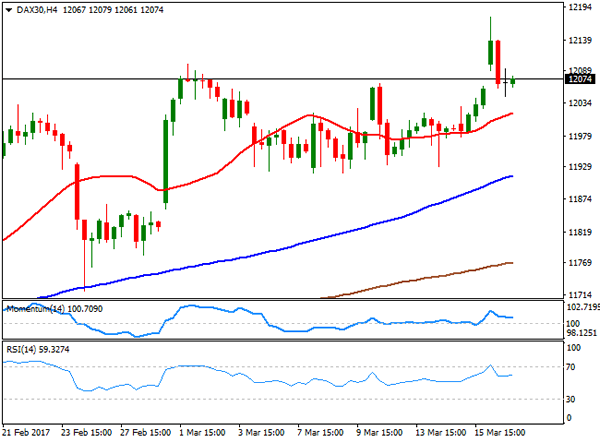
DAX
The German DAX added 73 points to settle at 12,083.18, with all of the broad-based European indexes closing with gains this Thursday, fueled by previous Wall Street's gains, and with optimism surging in the region after the ruling party defeated its populist competitor in the Dutch elections. Within the DAX, Deutsche Lufthansa was the best performer, adding 4.18%, followed by Deutsche Post that gained 1.87%. Heidelberg Cement led decliners, down 1.83%. The DAX closed off an multi-month high of 12,177, level last seen in March 2015. Holding near the mentioned close, the daily chart shows that the benchmark posted a higher high and a higher low daily basis, holding above bullish moving averages, whilst technical indicators head north within positive territory, favoring additional advances ahead. In the 4 hours chart, the index also stands above bullish moving averages, with the 20 SMA now at 12,018, whilst technical indicators have turned flat within positive territory after correcting overbought conditions.
Support levels: 12,059 12,018 11,977
Resistance levels: 12,099 12,140 12,178