Sample Category Title
Housing Starts Rise Solidly in February
Housing starts rose 3.0 percent in February. Single-family starts rose an even more impressive 6.5 percent. The momentum is swinging away from apartment building and back to traditional single-family homes.
Homebuilding Is Off to a Strong Start in 2017
Housing starts posted a stronger-than-expected 3.0 percent rise in February, with all of the increase coming in single-family starts. Milder weather across much of the country likely allowed for more work to begin this February relative to past winters, which likely bolstered the seasonally adjusted figures. That said, single-family starts have remained above the 800,000-unit threshold (annualized) for the past five months, and the latest figure marks the fastest pace for single-family starts since prior to the Great Recession.
The strength in single-family starts comes on the heels of yesterday's blowout NAHB/Wells Fargo Housing Market Index report, which jumped 6 points in March to 71, hitting its highest level since June 2005. The rise in builder confidence was driven by sizeable gains in sales and perspective buyer traffic, which is an encouraging sign for homebuilders.
Single-family construction posted its largest monthly gains in the Midwest and Northeast, rising 20 percent and 16.7 percent, respectively. Singlefamily homebuilding usually goes dormant throughout much of these regions during the winter months but has held up better this year due to, up until recently, much milder winter weather. Single-family starts also jumped 16.8 percent in the West but fell 2.6 percent in the South, where winter weather plays less of a role.
While single-family construction now appears to be ramping up, apartment construction seems to be cooling a bit. Vacancy rates have edged up across the country as a slew of projects have been completed over the past few months. With rent increases slowing and capital becoming dearer, starts of projects with 5 units or more, which are mostly apartments, are expected to fall modestly this year. Multifamily starts fell 3.7 percent in February, following a 7.3 percent drop in January. Those declines, however, come on the heels of a massive 44.3 percent jump in starts in December.
Permits Remain Solid But Spring Should See Some Payback
While the year has gotten off to a strong start, the large assist from milder winter weather will make it more difficult for housing starts to climb significantly higher this spring. Single-family permits have averaged an 823,000-unit pace over the past three months, which is slightly below the 832,000-unit pace for starts. Permits tend to be less impacted by the weather, which suggest that housing should hold onto much of its recent gains. The monthly data, however, may see a few head fakes as starts are unlikely to post as large of a gain as they usually do this spring because they did not fall off as much as they normally do each winter. We raised our estimate for housing starts in our monthly forecast to 1.25 million units for 2017 and look for 1.33 million starts in 2018.
Housing Starts Rise to a Four-Month High in February
The pace of homebuilding continued to climb in February, reaching a four-month high, with housing starts rising by 37k units to 1,288k (annualized). The headline number came in stronger than market expectations for 1,264k units. The expected rebound more than erases the prior month's decline, which was revised up to 1,251k units.
Encouragingly, the entire gain was concentrated in the single-family segment (+53k) while the pace of multi-family construction continued to moderate (-16k).
Building permits disappointed, coming in well below expectations, declining by 80k to 1213k, albeit from an upwardly revised 1293k print in the prior month. Nonetheless, good news was found in single-family permitting activity, which rose by 25k to 832k – the highest level since September 2007. Permitting across the volatile multifamily segment, on the other hand, continued to soften, falling by 105k units, and erasing more than all of the prior month's gain.
The monthly housing starts gain came entirely from the West (85k). Meanwhile, all other regions saw modest declines, with the South (-26k) leading the way followed by the Northeast (-13k) and Midwest (-9k) regions.
Key Implications
This morning's report was quite upbeat, with housing starts rising to a four-month high in February. Furthermore, the pace of homebuilding is well above its 6-month average and reaffirms our view that home-building in America is on a modestly positive upward trajectory.
The report however was not without flaws with headline permitting activity recording a large decline, dragged down entirely by the volatile multifamily segment. Nonetheless a rebound should be in store, with single-family segment posting strong gains to the highest level on record since September 2007. Moreover, the NAHB's Housing Market Index rose to 71, or an 11-year high in March, suggesting that interest in new homes continues to improve despite rising interest rates.
Rising long-term interest rates will likely place some downward pressure on housing demand, with the Fed likely to raise rates twice more this year after yesterday's hike. Still, rising income and job gains should provide an offset. Today's report, which suggests that records are being broken across a number of measures, only confirms the outlook for homebuilding in America is one that appears quite positive.
Cable Surged Over 0.5% after BoE
Cable surged over 0.5% after BoE left rates unchanged at 0.25%, as expected, but significant point was vote of one of policymakers for rate hike.
Markets anticipated that such step could be followed by other MPC members next time that lent strong support to the pound.
With inflation in UK being on strong footing and other economic parameters showing solid numbers, the only dissonant tone came from wage growth, which fell below expectations in Feb.
However, positive sentiment is building, as BoE expects Britain's economy to grow by relatively strong 2.0% this year that may push BoE towards more aggressive approach in next meeting.
From technical point of view, fresh bullish acceleration that extended in the second day, broke above the upper pivot at 1.2343 (daily Kijun-sen) and sidelined selling-upticks scenario that was in play on prevailing bearish tone.
After our upper trigger was taken out, near-term focus turned higher. Fresh rally is approaching next pivot, daily Ichimoku cloud (spanned between 1.2379 and 1.2435). Sustained break above the cloud would be another strong bullish signal.
Former barrier and pivot at 1.2300 now acts as strong support (broken top of thick 4-hr cloud) which is expected to hold extended corrective downticks.
Res: 1.2379; 1.2392; 1.2435; 1.2459
Sup: 1.2326; 1.2300; 1.2239; 1.2200
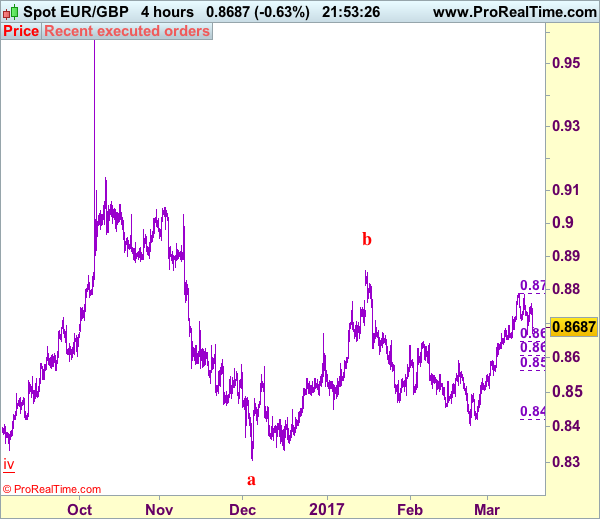
Trade Idea: EUR/GBP – Buy at 0.8620
EUR/GBP - 0.8691
Recent wave: Major double three (A)-(B)-(C)-(X)-(A)-(B)-(C) is unfolding and 2nd (A) has possibly ended at 0.6936.
Trend: Near term down
Original strategy :
Buy at 0.8645, Target: 0.8760, Stop: 0.8605
Position : -
Target : -
Stop : -
New strategy :
Buy at 0.8620, Target: 0.8750, Stop: 0.8580
Position : -
Target : -
Stop : -
Although the single currency rebound to as high as 0.8760, as renewed selling interest emerged and euro has slipped again, retaining our view that further consolidation below indicated resistance at 0.8788 would be seen and pullback to 0.8645-48 (38.2% Fibonacci retracement of 0.8422-0.8788) is likely, however, reckon downside would be limited to 0.8615-20 and bring another rise later, break of 0.8760 would bring retest of said resistance at 0.8788, above there would extend the rise from 0.8403 low to 0.8800 but loss of near term upward momentum should prevent sharp move beyond 0.8825-30 and price should falter well below 0.8850.
In view of this, we are looking to buy euro on subsequent pullback as 0.8615-20 should limit downside. Below 0.8605 (50% Fibonacci retracement of 0.8422-0.8788) would defer and suggest top is possibly formed, risk test of 0.8560-65 (61.8% Fibonacci retracement) but support at 0.8547 should remain intact.
Our preferred count is that, after forming a major top at 0.9805 (wave V), (A)-(B)-(C) correction is unfolding with (A) leg ended at 0.8400 (A: 0.8637, B: 0.9491 and 5-waver C ended at 0.8400. Wave (B) has ended at 0.9413 and impulsive wave (C) has either ended at 0.8067 or may extend one more fall to 0.8000 before prospect of another rally. Current breach of indicated resistance at 0.9043 confirms our view that the (C) leg has ended and bring stronger rebound towards 0.9150/54, then towards 0.9240/50.
US Housing Starts Were Stronger than Expected at 1,288k in February
- The Housing starts were stronger than market expectations for 1,264k annualized units.
- The increase relative to January (1,251k) was in single unit structures, which recorded a fresh cycle high in February. Multi-unit starts moderated in the month but remained firm relative to last year's pace.
- Regionally, all of the increase was in the West as starts rebounded following a sharp decline in the previous month.
- A mild start to the year likely provided some boost to homebuilding activity in January and February.
- Permit issuance slowed to 1,213k in February although the three-month trend in permits remained at a 1½ year high.
Our Take:
After remaining range-bound for much of last year, housing starts picked up toward the end of 2016 - a trend that has continued so far this year with activity remaining firm in January and February. We see a number of fundamentals - including a strong labour market and income growth, accommodative financial conditions, further easing in mortgage lending standards, and tight supply in the resale market - supporting continued improvement in homebuilding this year. As well, solid permit issuance and rising homebuilders' confidence (the latter now close to the previous cycle's peak when starts were running above 2 million) point to activity remaining strong in the near-term, even if some of the recent warm-weather boost trails off in the coming months. We look for housing to make a decent contribution to GDP growth this year; today's stronger-than-expected increase boosts our monitoring for Q1 residential investment (a double-digit annualized increase now looks within reach), supporting our forecast for 2% growth in the current quarter.
Canadian Dollar Jumps as Fed Sends Greenback Reeling
USD/CAD is steady on Thursday, after posting strong losses in the Wednesday session. In North American trade, the pair is trading at the 1.33 line. On the release front, Canadian Foreign Securities Purchases dropped sharply to C$6.20 billion, short of the forecast of C$9.45 billion. This was the smallest reading in 6 months. In the US, Building Permits fell to 1.21 million, missing the estimate of 1.26 million. The Philly Fed Manufacturing Index dropped sharply to 32.8, above the forecast of 30.2 points. On the labor front, unemployment claims ticked down to 241 thousand, beating the forecast of 245 thousand. On Friday, Canada releases Manufacturing Sales and the US will publish the UoM Consumer Sentiment report.
There were no raised eyebrows when the Federal Reserve raised rates by a quarter-point on Wednesday. The hike, the second in just three months, raised the raised the benchmark lending rate to a 0.75%-1% range. What was not expected, however, was the sharp drop of the dollar against its major rivals. The markets were hoping that a red-hot US economy would propel the Fed to accelerate its pace of monetary tightening. There was disappointment as Fed Chair Janet Yellen reiterated that further rate hikes would be done gradually, pushing the dollar on Wednesday. As well, the US dollar may have lost ground due to traders and investors acting on "buy on rumor, sell on fact". This larges-scale selling of US dollars after the Fed hike has sent the US dollar broadly lower, with USD/CAD declined 1.1 percent in the Wednesday session.
Oil remains under strong pressure, and weak crude prices could weigh on the Canadian dollar. West Texas crude plunged 8.7 percent last week and dipped below the $47 level on Tuesday. This was in response to reports that Saudi Arabia has increased oil production above 10 million barrels a day, raising concerns about a global oil glut. Meanwhile, US Crude Oil Inventories finally reversed directions, posting a drawdown of 0.2 million barrels, compared to an estimate of 3.3 million. This decline comes after the indicator posted 11 surpluses in the past 12 weeks, reflective of increasing US shale production. The string of surpluses has dampened OPEC's hopes of raising prices, as the cartel cut production levels at the beginning of January. Compliance with the agreement stands at an impressive 94% and OPEC had high hopes of pushing crude to $60 or more, but oil prices continue to lose ground in 2017.
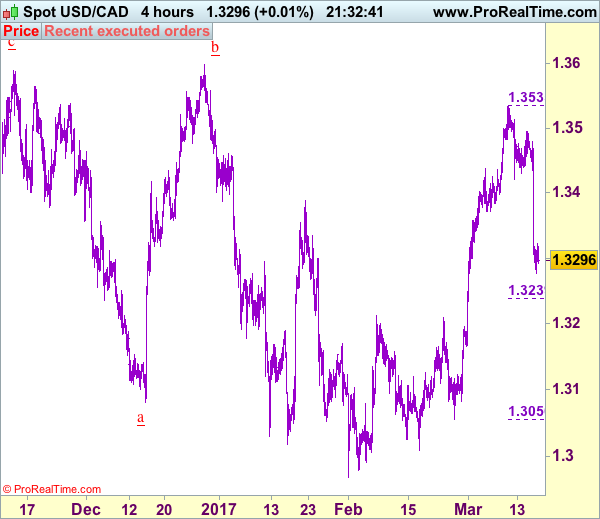
Trade Idea: USD/CAD – Stand aside
USD/CAD - 1.3301
Recent wave: Only wave v of c has ended at 0.9407 and wave C of major A-B-C correction is underway for headway to 1.4700
Trend: Near term up
Original strategy :
Bought at 1.3350, stopped at 1.3290
Position: - Long at 1.3350
Target: -
Stop: - 1.3290
New strategy :
Stand aside
Position: -
Target: -
Stop:-
Yesterday’s selloff on broad-based weakness in the greenback dampened our bullishness and suggests top has been formed at 1.3535 earlier and near term downside risk remains for at least a retracement of recent rise, hence weakness to 1.3270-75 would be seen, however, downside should be limited to 1.3235-40 (61.8% Fibonacci retracement of 1.3056-1.3535) and reckon previous resistance at 1.3210 would hold due to near term oversold condition.
In view of this, would not chase this fall here and would be prudent to stand aside in the meantime. Above 1.3350 would bring recovery to 1.3390-00, however, price should falter below previous support at 1.3421 (now resistance), bring another decline later. Only above 1.3475-80 would abort and suggest low is formed instead, bring test of 1.3495 resistance first.
To recap, wave B from 1.3066 is unfolding as an a-b-c and is sub-divided as a: 1.2192, b: 1.2716 and wave c is a 5-waver with i: 1.1983, ii: 1.2506, extended wave iii with minor iii at 1.0206, wave iv ended at 1.0781 and wave v as well as wave iii has ended at 0.9931, hence the subsequent choppy trading is the wave iv which is unfolding as (a)-(b)-(c) with (a) leg of iv ended at 1.0854, followed by (b) leg at 1.0108 and (c) leg as well as the wave iv ended at 1.0674. The wave v is sub-divided by minor wave (i): 0.9980, (ii): 1.0374, (iii): 0.9446, (iv): 0.9913 and (v) as well as v has possibly ended at 0.9407, therefore, consolidation with upside bias is seen for major correction, indicated target at 1.3700 and 1.4000 had been met and further gain to 1.4700 would be seen later.
DAX Spiked to Fresh High at 12177
DAX spiked to fresh high at 12177 (the highest since mid-2015) on 0.4% opening higher on Thursday and subsequent acceleration higher. Rally was triggered on relief after Dutch elections, results of which soothed fears of Eurozone's breakup.
Strong fundamentals were supported by bullish technicals that favor further advance after the price broke above previous high of 01 Mar at 12098.
Fresh bulls peaked at 12177, with consolidation on extended near-term studies underway.
Session low at 12088 marks initial support that is holding for now, with today's gap expected to remain intact and keep near-term structure in firm bullish tone for fresh upside action, towards projections at 12211 and 12282, regain of which would unmask key longer-term barrier at 12398 (record high, posted on 10 Apr 2015).
Conversely, filling today's gap would risk test of pivotal support at 12046 (rising daily Tenkan-sen) which underpins the action in past two weeks.
Res: 12144; 12177; 12211; 12282
Sup: 12088; 12062; 12046; 12000
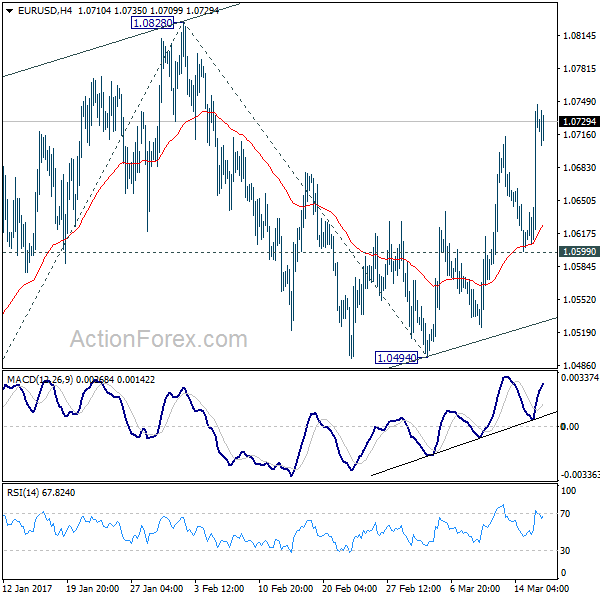
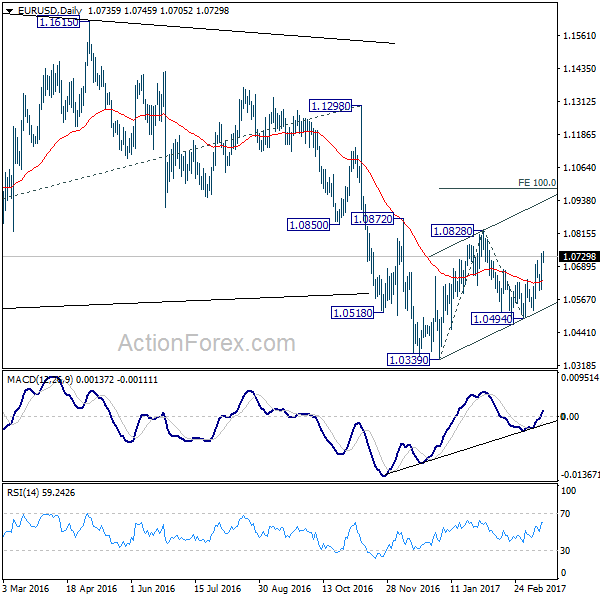
EUR/USD Mid-Day Outlook
Daily Pivots: (S1) 1.0642; (P) 1.0691 (R1) 1.0780; More.....
EUR/USD's rally from 1.0494 is still in progress and intraday bias remains on the upside for 1.0828 resistance and above. Overall, rise from 1.0339 is seen as a corrective move. Hence, we'd upside to be limited by 100% projection of 1.0339 to 1.0828 from 1.0494 at 1.0983 to bring larger down trend resumption. On the downside, break of 1.0599 will turn bias back to the downside for 1.0494 support.
In the bigger picture, as long as 1.1298 key resistance holds, whole down trend from 1.6039 (2008 high) is still expected to continue. Break of 1.0339 low will send EUR/USD through parity to 61.8% projection of 1.3993 to 1.0461 from 1.1298 at 0.9115.
USD/CHF Mid-Day Outlook
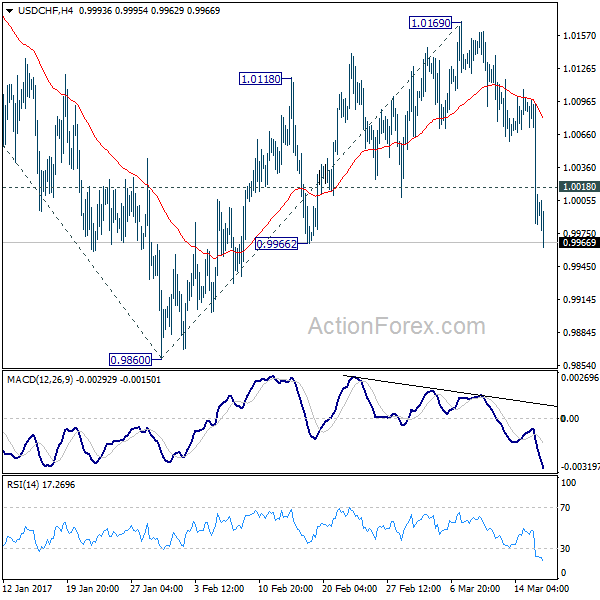
Daily Pivots: (S1) 0.9955; (P) 1.0030; (R1) 1.0077; More.....
Intraday bias in USD/CHF remains on the downside for 0.9860. Corrective rise from there should have completed at 1.0169 and fall from 1.0342 is likely resuming. Break of 0.9860 will target 100% projection of 1.0342 to 0.9860 from 1.0169 at 0.9687. On the upside, 1.0018 minor resistance will turn bias neutral. But outlook will now stay bearish as long as 1.0169 resistance holds.
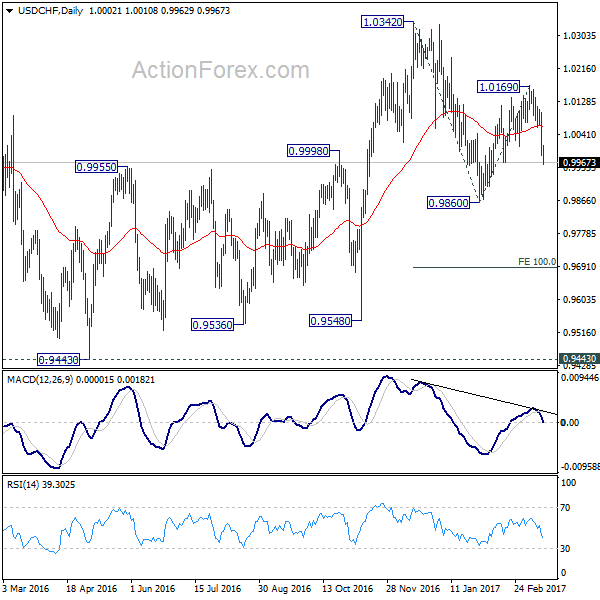
In the bigger picture, prior rejection from 1.0327 resistance argues that USD/CHF is staying in a medium term sideway pattern. In any case, decisive break of 1.0342 resistance is needed to confirm underlying strength. Otherwise, we'll stay neutral in the pair first. In case of another fall, we'd expect strong support from 0.9443/9548 support zone.