Sample Category Title
USD/JPY Elliott Wave Analysis
USD/JPY - 114.57
USD/JPY – Wave V of larger degree circle V has possibly ended at 75.31 and major correction has commenced and already met indicated target at 125.00.
Although the greenback rose to 115.51 late last week, the subsequent retreat suggests consolidation below this level would be seen and risk has increased for pullback to 114.00-05, however, reckon support at 113.56-61 would limit downside and bring another rise later. Above indicated resistance at 115.51-62 would signal the erratic rise from 111.59 low is still in progress and may extend further gain to 116.00-10, break there would suggest the pullback from 118.66 has ended, bring further gain to resistance at 116.87 first. Looking ahead, a sustained break above there would signal early upmove has resumed for further gain to another previous resistance at 117.53 next.
Our preferred count is that, triangle wave IV (with circle) ended at 101.45 and the circle wave V brought dollar down to the record low of 75.31 in 2011 and the subsequent rebound signal major correction has commenced with A leg ended at 84.19, followed by wave B at 77.14 and impulsive wave C is now unfolding (indicated upside target at 125.00 had been met) for gain towards 127.00 level. In the event dollar drops below support at 99.01, this would confirm medium term decline from 125.86 top (2015 high) has resumed for subsequent weakness to 98.00 and possibly 97.00.
Under this count, this wave C is unfolding as impulsive waves with (1) (2), 1 2 ended at 80.67, 79.07, 82.84 and 81.69 respectively, hence the extended wave 3 has ended at 103.74 and wave 4 correction of recent upmove should bring weakness to 92.57, then towards 90.88 but psychological support at 90.00 should limit downside and bring another rally later in wave 5, indicated target at 125.00 had been met and gain to 127.00 cannot be ruled out but reckon price would falter below 130.00.
On the downside, whilst initial pullback to 114.00-05 cannot be ruled out, reckon downside would be limited to 113.56-61 support area and bring another rise. A daily close below there would suggest the rebound from 111.59 has ended, bring further fall to 113.00-05 and possibly 112.70-80. Looking ahead, a daily close below latter level would retain bearishness and bring further fall to 112.00-10, break there would bring test of indicated support area at 111.59-69, however, dollar needs to penetrate indicated support at 111.36 to retain bearishness, bring retracement of recent upmove to 110.90-00, then 109.90-95 (50% Fibonacci retracement of 101.19-118.66) but downside should be limited to 109.50 and price should stay above 109.00, bring rebound later.
Recommendation: Stand aside for this week.

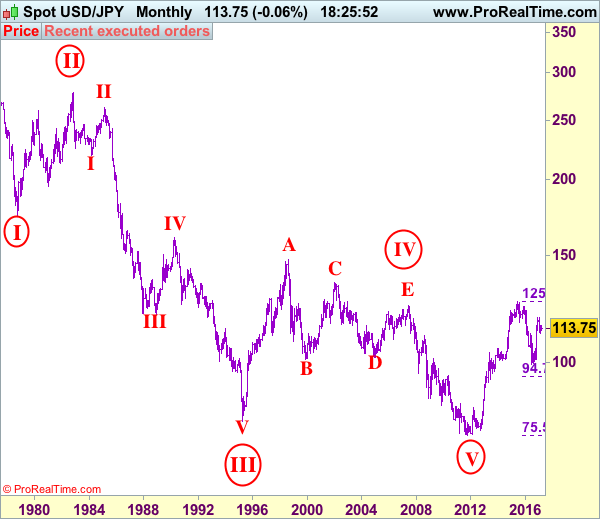
On the monthly chart, we have changed our preferred count that an impulsive wave is unfolding with major wave III with circle ended at 79.75, then followed by wave IV with circle and is labeled as a triangle with A: 147.64 (11 August, 1998), B: 101.25, C: 135.20, D: 101.67 and E leg ended at 124.14 to end the wave IV with circle. Hence, wave V with circle commenced from there and hit a record low of 75.31, however, the subsequent strong rebound signals this circle wave V has possibly ended there, hence gain to (indicated upside target at 122.00 and 125.00 had been met), the retreat from 125.86 suggests wave A of major correction has ended there and wave B correction back to 99.00, then 95.00 would be seen, however, reckon downside would be limited to 90.00, bring another rebound in wave C next year.
USDJPY – Near-Term Risk Shifts Lower On Signs Of False Break Above Cloud
Strong upside rejection on Friday and today's fresh weakness that pressures daily cloud base at 114.51, weakened near-term structure and give initial signal of false break above the cloud. Increased downside risk could be expected on firm break below widening daily cloud, with bearish divergence on daily chart slow stochastic, supporting the notion. Next pivotal supports lay at 114.10/03 (rising daily Tenkan-sen/Fibo 38.2% of 111.67/115.49 rally) and extended dips may find footstep here. Otherwise, break lower would generate stronger reversal signals. Meantime, hopes of fresh upside action are expected to stay alive while cloud base holds, as Ichimoku studies on daily chart are supportive. Close above daily cloud and extension above Friday's high at 115.49, are required to signal bullish continuation and expose next target at 115.91 (Fibo 61.8%).
Res: 114.99, 115.49, 115.91, 116.33
Sup: 114.51, 114.24, 114.10, 113.65
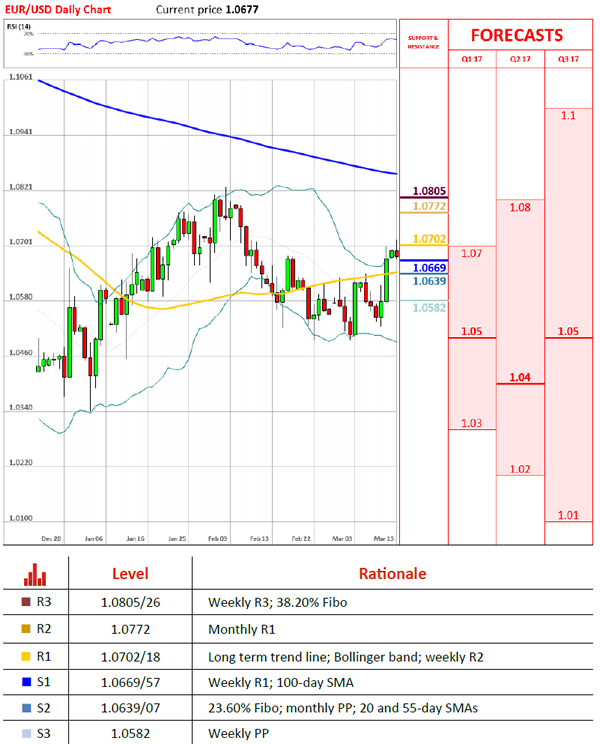
EUR/USD – Euro Climbs To 4-Week Highs On Talk Of ECB Hike
EUR/USD is unchanged in the Monday session, after posting strong gains at the end of last week. Currently, the pair is trading at 1.0670. On the release front, there are no major releases in the eurozone or the US. ECB President Mario Draghi will deliver remarks at an event in Frankfurt.
The euro posted considerable gains on Friday, as some ECB policymakers raised the possibility of higher interest rates at last week's policy meeting. At the meeting, the ECB held course and maintained interest rates at a flat 0.00%. The markets were left to pick up on nuances, as ECB President Mario Draghi noted that the central bank removed one phrase from its standard introductory statement – 'using all the instruments available within its mandate'. Draghi stated that the removal of this phrase means that the ECB 'no longer has a sense of urgency in taking further actions …. prompted by the risk of deflation'. With growth and inflation showing signs of improvement, the ECB has been under pressure to tighten policy and reduce its asset-purchase program. Germany, in particular, is unhappy with the ECB's ultra-loose policy and on Thursday, German Finance Minister Wolfgang Schaeuble bluntly stated that he wanted to see a 'timely start to the exit' from the ECB's asset-purchase scheme. For his part, Mario Draghi must balance the improved economy with upcoming elections in the Netherlands and France. Euro-skeptics are a strong force throughout Europe and Draghi is reluctant to make any major moves in the middle of heated political campaigns.
The US economy delivered strong economic data on Friday. Nonfarm payrolls sparkled in February, as the indicator jumped to 235 thousand, easily beating the estimate of 196 thousand. Wage growth climbed 2.6% compared to February 2016, while the participation rate edged up to 63.0%, up from 62.9%. These numbers make it a virtual certainty that the Fed will raise rates by a quarter-point on Wednesday. Although a rate hike has been priced in by the markets, there have been disappointments in the past, so a rate move will likely give the dollar a boost against its major rivals, such as the euro. The solid job numbers also give President Trump a much-needed boost. Trump is under pressure to present an economic agenda, but the markets won't mind giving him some additional breathing room with the economy performing well.
AUD/USD X Cross At POC Zone
The AUD/USD has formed an X cross (intersection of two trend lines or a trend line with a strong PP) exactly at the POC zone 0.7595-0.7605 (H5, ATR top, 78.6) and the pair might start to reject towards 0.7555 zone. If the pair breaks below 0.7545 (ATR, EMA89 support) we should see a continuation towards 0.7525, L3 support. Final target is 0.7480 for this move. Ideally for this scenario to succeed, the pair should stay below 0.7635 as the spike to 0.7635 would lead to a possible ascending scallop with a stronger correction to the upside.
Forex Technical Analysis
EUR/USD
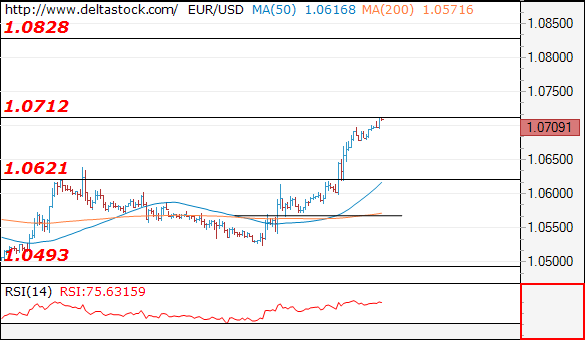
Current level - 10709
Despite the positive bias, my outlook is counter-trend, for a break through 1.0620 crucial support, towards 1.0490 lows.
| Resistance | Support | ||
| intraday | intraweek | intraday | intraweek |
| 1.0710 | 1.0710 | 1.0620 | 1.0450 |
| 1.0828 | 1.0870 | 1.0493 | 1.0350 |
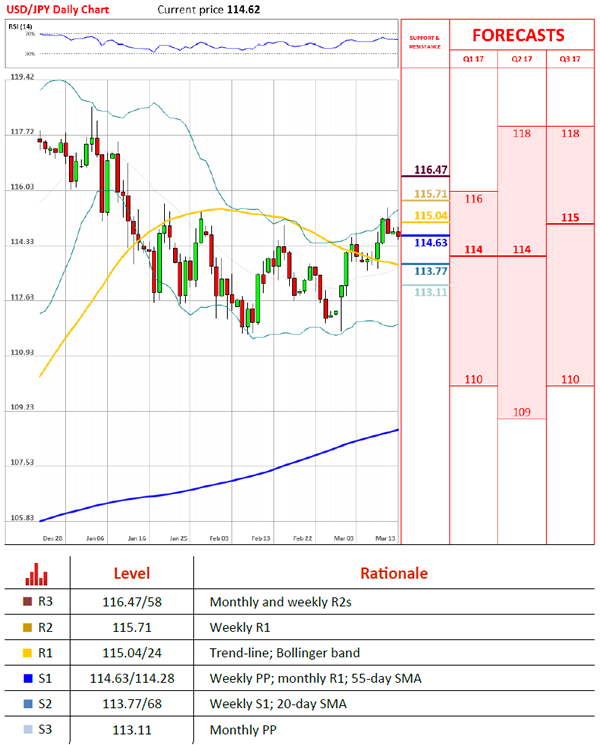
USD/JPY
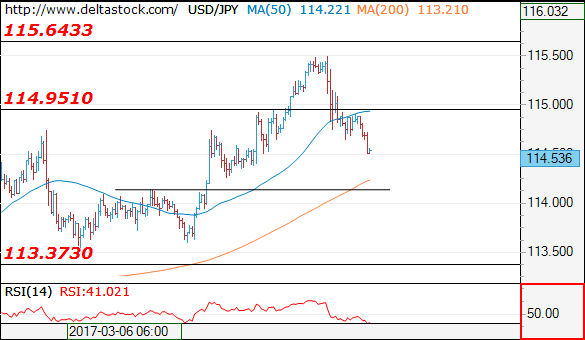
Current level - 114.53
The recent reversal at 115.50 led to a corrective slide and the intraday bias is negative, for a possible test above 114.10 support zone. Initial intraday resistance lies at 114.95 and a break through the latter will signal a renewal of the general upmove, towards 115.65 area.
| Resistance | Support | ||
| intraday | intraweek | intraday | intraweek |
| 114.95 | 118.65 | 114.10 | 114.10 |
| 115.65 | 120.00 | 114.10 | 113.37 |
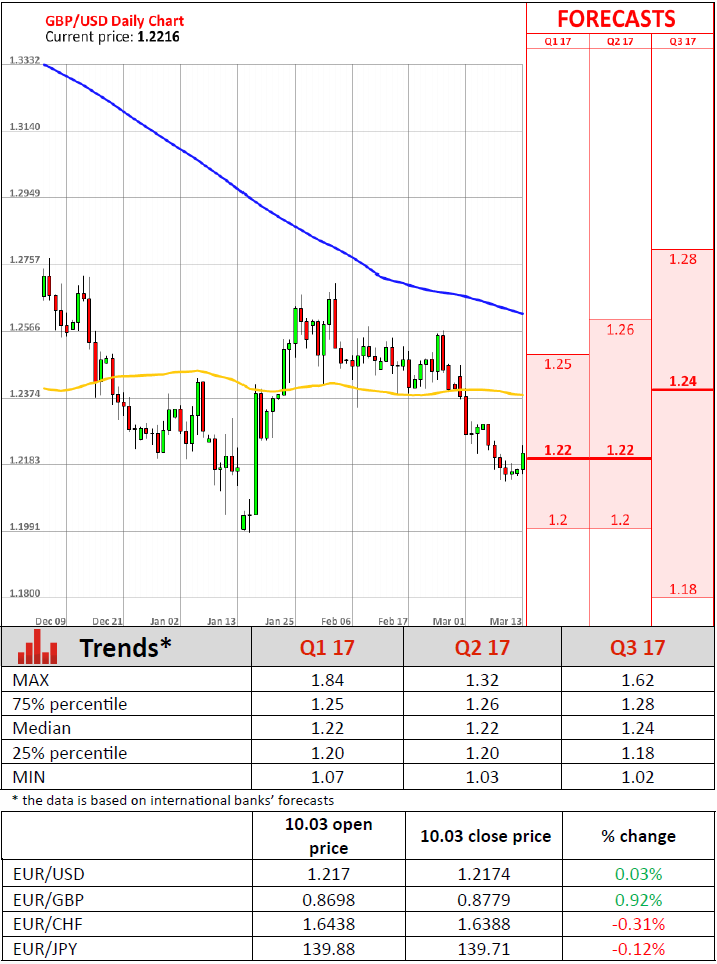
GBP/USD
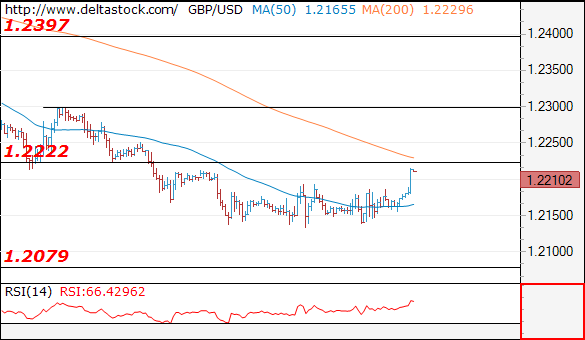
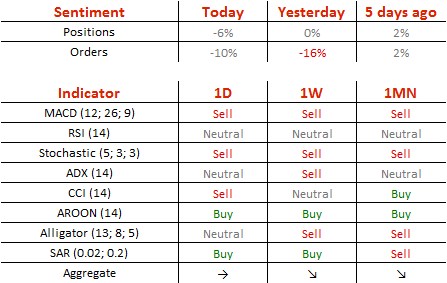
Current level - 1.2210
The intraday bias is positive above 1.2185 minor support, with a risk of an intraday rise towards 1.2300 major hurdle. A break through 1.2185 will signal a slid towards 1.2080 zone.
| Resistance | Support | ||
| intraday | intraweek | intraday | intraweek |
| 1.2220 | 1.2570 | 1.2130 | 1.2080 |
| 1.2300 | 1.2705 | 1.2080 | 1.1984 |
EUR/USD Surges Above 1.07 Mark
'Following the ECB's policy review on Thursday, President Mario Draghi refused to speculate on the possibility of rate increases before quantitative easing ends.' - Tanvir Sandhu, Bloomberg
Pair's Outlook
Due to comments from the president of the European Central Bank, Mario Draghi, the common European currency jumped against the US Dollar in the recent trading sessions. The currency exchange rate already reached the new second weekly resistance level at 1.0718. The last time the rate was at such level was on February 6. As Mario Draghi is set to speak also on Monday, it is likely that the Euro would continue the surge. In such case the weekly S2 would be broken, and the rate would surge up to the monthly R1, which is located at 1.0772 level.
Traders' Sentiment
SWFX traders have become bearish regarding the pair, as 53% of open positions are short on Monday. Meanwhile, 55% of trader set up orders are set to sell the Euro.
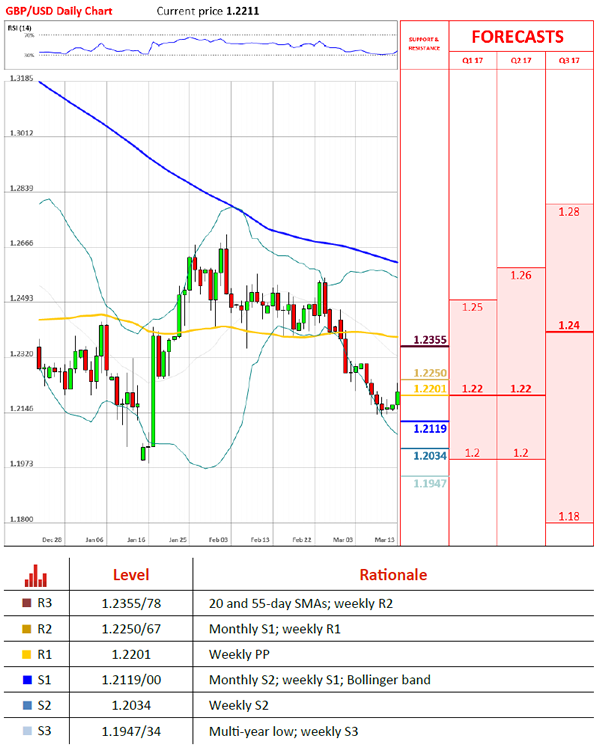
GBP/USD Regains Bullish Momentum
'I am bearish on the pound and I think it will be lower a year from now. Similarly, while the U.K. economy will not unravel due to Brexit, I would expect the process to take a toll on growth for many years to come.' – Erik Wiesman, MFS Investment Management (based on Bloomberg)
Pair's Outlook
Even though the US NFP data came out strong on Friday, the earnings growth still disappointed, bringing doubts over a March rate hike, thus, turning the tide on the Greenback's rally. As a result, the Cable traded flat that day, but began edging higher today amid a corrective decline in the US Treasury bond yields. Consequently, the GBP/USD pair now has the potential to reclaim the 1.22 major level, where the weekly pivot point is the nearest resistance. The 1.2250 is the next target, but is likely to remain out of reach, as the monthly S1 and the weekly R1 form another strong supply area there.
Traders' Sentiment
Bulls grew stronger over the weekend, as now 69% of all open positions are long, compared to 67% on Friday. At the same time, the portion of purchase orders barely changed, having risen from 53 to 54%.
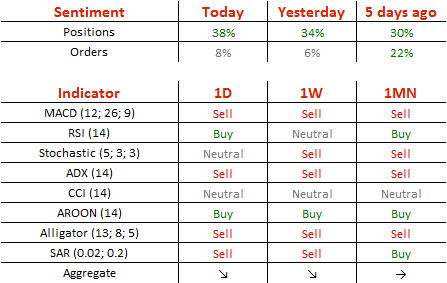
USD/JPY Sets Eye On 116.00
'We believe the USD/JPY will edge upward to the ¥115-120 level not in a straight line but with some fluctuation over the coming 3-6 months.' – Deutsche Bank (based on FXStreet)
Pair's Outlook
The Greenback failed to appreciate against the Japanese Yen on Friday, therefore, preserving the ascending channel's resistance line. The pair failed to reclaim the 115.00 major level, which suggests a possible retest of the channel's lower boundary within the next two weeks. Today the Buck is expected to weaken against the Yen, as the bearish momentum persists from the disappointment of Friday's earnings growth data. However, due to lack of any other market movers, the given pair could retain its position above the immediate demand area, namely the monthly R1 and the weekly PP around 114.63. Any slide further down is to be limited by the 55-day SMA circa 114.28.
Traders' Sentiment
There are 55% of traders holding long positions today (previously 56%), while 52% of all pending orders are to sell the US Dollar.
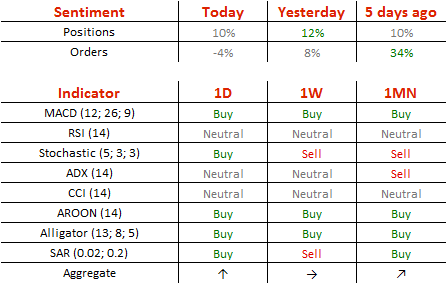
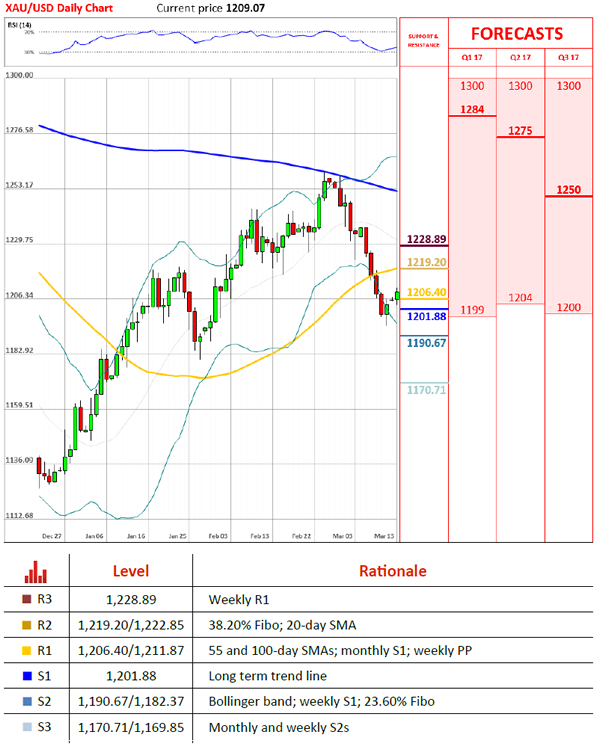
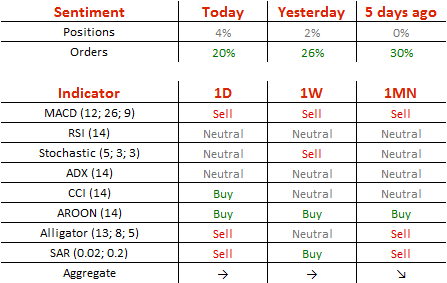
Gold Continues To Rebound
'Looks like people are ready to buy gold below $1,200 and it is sort of a psychological level. Think people got confounded after Friday's move and the short ones are buying back now.' - Yuichi Ikemizu, Standard Bank (based on Reuters)
Pair's Outlook
During the early hours of Monday's trading session the yellow metal's price had surged above the 1,210 mark, as the bullion continued the course of regaining its losses. The commodity price managed to pass a resistance cluster just below the 1,210 level, and the metal faced only the weekly PP at 1,211.87. The weekly PP is the last resistance level before the 1,219.20 mark, where the 38.20% Fibonacci retracement level is located at. Due to these factors combined, it is expected that the cluster below will provide enough support to push the metal's price higher.
Traders' Sentiment
Traders are bullish on the metal, as 52% of open SWFX positions are long. In addition, 60% of trader set up orders are set to buy the bullion.
UK Production Index Experiences 0.4% Fall In January
'The monthly decline reflects a correction from December's sharp increase and the underlying trend is still for a solid underlying increase in output'. - Tim Clayton, EconomicCalendar.com
In January, British total production experienced a 0.4% decrease compared to the previous month, the Office for National Statistics revealed on Friday. This number was mostly attributed to declines in the water and manufacturing sectors, where production fell 0.7% and 0.9%, accordingly. The largest contribution to January's fall came from pharmaceutical products that posted a 13.5% drop, following growth of 8.2% in the previous month. However, this kind of change is not unusual for the pharmaceutical industry, as it can be highly volatile due to the timing of contracts. To certain extent, it was counterbalanced by production of transport equipment that increased 2.6% and reached the highest level since April 2016. This growth was supported by a 2.4% gain posted by the wood, paper and printing industry and a 2.3% increase posted by the textile, chemicals and machinery industries. Nevertheless, the largest month-to-month growth was seen in the other mining and quarrying sector, where production advanced 3.6%. Yet, this figure only partially allowed to offset a 8.6% drop in the coal and lignite sector. On an annual basis, the British Production Index increased 3.2% in January. Growth was seen in all four major sectors but the biggest contribution of 2.7% came from manufacturing.