Sample Category Title
Trade Idea Update: EUR/USD – Buy at 1.0640
EUR/USD - 1.0668
Original strategy :
Buy at 1.0640, Target: 1.0740, Stop: 1.0610
Position : -
Target : -
Stop : -
New strategy :
Buy at 1.0640, Target: 1.0740, Stop: 1.0610
Position : -
Target : -
Stop : -
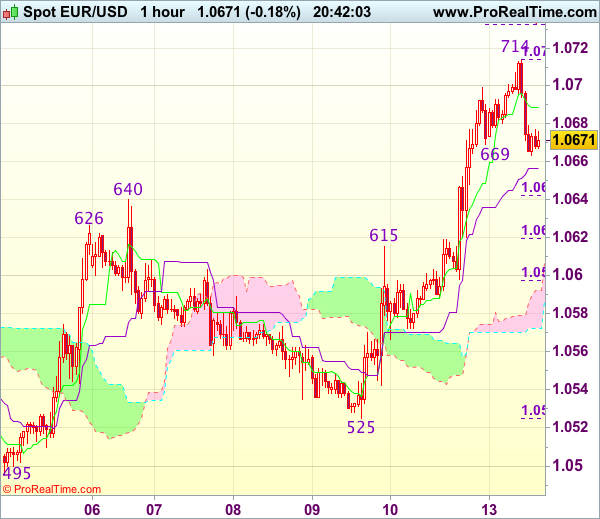
As the single currency has retreated after rising to 1.0714 earlier today, suggesting consolidation below this level would be seen and pullback to 1.0640 (previous resistance now support) cannot be ruled out, however, reckon downside would be limited and bring another rise later, above 1.0714 would signal the erratic rise from 1.0493 low is still in progress and may extend gain to 1.0740-45 (1.5 times projection of 1.0495-1.0640 measuring from 1.0525) but loss of near term upward momentum should prevent sharp move beyond 1.0760 (1.618 times projection of 1.0495-1.0640 measuring from 1.0525).
In view of this, we are looking to buy euro on further pullback as 1.0540 should limit downside, bring another rise later. Below another previous resistance at 1.0615 would abort and signal top has been formed, risk further fall to 1.0575-80 first.
Trade Idea Update: USD/JPY – Stand aside
USD/JPY - 114.69
New strategy :
Stand aside
Position : -
Target : -
Stop : -
Although the greenback recovered after finding support at 114.48 and minor consolidation is in store, reckon upside would be limited to the Kijun-Sen (now at 115.00) and near term downside risk remains for the fall from 115.51 top (last week’s high) to bring at least a retracement of recent upmove to 114.26 support but downside should be limited to 114.00-05 (38.2% Fibonacci retracement of 111.69-115.51) and price should stay well above strong support at 113.56-61), bring rebound later.
In view of this, would be prudent to stand aside for now. Above the Kijun-Sen (now at 115.00) would suggest an intra-day low is formed, bring a stronger rebound to 115.25-30 but still reckon said resistance at 115.51 would cap upside. Only break there would revive bullishness and extend recent upmove to previous resistance at 115.62, then towards 115.90-00.

GBP Volatile as Sturgeon Calls Scexit Referendum
In what was already going to be an eventful week for the UK, Nicola Sturgeon has thrown another, albeit expected, spanner in the works calling for another Scottish independence referendum leaving PM Theresa May with not only Brexit but also Scexit to contend with.
The announcement hasn't come as a major surprise, with the SNP making their feelings repeatedly known since the EU referendum last June after the majority of the country voted to remain only to be dragged out kicking and screaming. What is confusing is the timing for the new referendum, with Sturgeon claiming that it should happen between Autumn 2018 and Spring 2019, prior to the two years of Brexit negotiations being completed.
This effectively means that even if the negotiations go perfectly to plan, which they likely won't, the Scottish people won't know what they will actually be voting for. It's almost like Sturgeon wants the alternative to independence to be enormous uncertainty when the alternative could be cleared up months after the proposed date.
While all of this seems rather confusing, markets have broadly taken it in their stride. The pound, which had started the session well on hopes that parliament could have a vote on its on exit deal, saw some volatility immediately after the announcement but has since settled slightly higher. The uncertainty has hit UK Gilts slightly but even here, the impact has been minimal, albeit enough to send yields to session highs.
Elliott Wave Analysis: AUDUSD Trading In A Temporary Correction
Aussie has turned sharply lower last week which has been expected since we identified an ending diagonal in wave C) position. That's a reversal pattern that put a bearish impulse in progress, wave 1 that found a base at the 0.7489 level. As such current bullish rally is the start of wave 2, which may find an ideal reversal zone around the 50.0 or 61.8 Fibonacci ratio, for where a bearish breakdown may follow.
AUD/USD, 4H
GOLD Bearish Pause, SILVER Short-Term Bullish Consolidation, Crude Oil Weakening
GOLD (in USD) Bearish Pause
Gold is consolidating after strong bearish move since resistance given at 1263 (27/02/2017 high). Expected to reach strong support at 1177 (11/01/2017 low).
In the long-term, the technical structure suggests that there is a growing upside momentum. A break of 1392 (17/03/2014) is necessary ton confirm it, A major support can be found at 1045 (05/02/2010 low).
SILVER (in USD) Short-Term Bullish Consolidation
Silver's selling pressures are still important. Hourly support is now given at 16.63 (27/01/2016 low). Expected to see renewed bearish pressures.
In the long-term, the death cross indicates that further downsides are very likely. Resistance is located at 25.11 (28/08/2013 high). Strong support can be found at 11.75 (20/04/2009).
Crude Oil (in USD) Weakening
Crude oil's bearish pressures continues. The commodity has been unable to mount a serious challenge to 55.24 (03/01/2017 high) resistance. Strong support given at 49.61 (08/12/2016) has been broken. Expected to see deeper selling pressures.
In the long-term, crude oil has recovered after its sharp decline last year. However, we consider that further weakness are very likely. Strong support lies at 24.82 (13/11/2002) while resistance can now be found at 55.24 (03/01/2017 high).
EUR/CHF Temporary Surge, EUR/JPY Monitoring Resistance at 123.31, EUR/GBP Heading Higher
EUR/CHF Temporary Surge
EUR/CHF's bullish pressures have increased sharply. Resistance given at 1.0762 (27/12/2016 high) has been broken. Anyway, the mediumterm pattern suggests us to see continued bearish pressures towards key support that can be found at 1.0623 (24/06/2016 low). Temporary surges seem the new normal for the CHF.
In the longer term, the technical structure is mixed. Resistance can be found at 1.1200 (04/02/2015 high). Yet,the ECB's QE programme is likely to cause persistent selling pressures on the euro, which should weigh on EUR/CHF. Supports can be found at 1.0184 (28/01/2015 low) and 1.0082 (27/01/2015 low).
EUR/JPY Monitoring Resistance at 123.31
EUR/JPY's demand has rejuvenated . Hourly resistance at 121.34 (10/02/2017 high) has been broken. Strong resistance is given at a distance at 123.31 (27/01/2017 high). Expected to show further increase.
In the longer term, the technical structure validates a medium-term succession of lower highs and lower lows. As a result, the resistance at 149.78 (08/12/2014 high) has likely marked the end of the rise that started in July 2012. Strong support at 94.12 (24/07/2012 low) looks nonetheless far away.
EUR/GBP Heading Higher
EUR/GBP is pushing higher. Strong resistance given at 0.8854 (15/01/2017 high) is at stake. We rule out further weakness towards supports given at 0.8450 (03/01/2016 low) and at 0.8304 (05/12/2016). Expected to further strengthen.
In the long-term, the pair has largely recovered from recent lows in 2015. The technical structure suggests a growing upside momentum. The pair is trading above from its 200 DMA. Strong resistance can be found at 0.9500 psychological level.
USD/CHF Monitoring Uptrend Channel, USD/CAD Wide-Open Toward Resistance at 1.3599, AUD/USD Short-Term Bullish
USD/CHF Monitoring Uptrend Channel
USD/CHF is still riding within uptrend channel and is on its way to monitor hourly support implied by lower bound of the uptrend channel. Key resistance is given at a distance at 1.0344 (15/12/2016 high). Expected to consolidate.
In the long-term, the pair is still trading in range since 2011 despite some turmoil when the SNB unpegged the CHF. Key support can be found 0.8986 (30/01/2015 low). The technical structure favours nonetheless a long term bullish bias since the unpeg in January 2015.
USD/CAD Wide-Open Toward Resistance at 1.3599
USD/CAD's bullish pressures are definitely on after breaking key resistance at 1.3353 (20/01/2017 high). Yet, as long as this resistance was not broken (20/01/2017 high), bullishness was limited. Expected to see further upside potential for the pair.
In the longer term, there is a golden cross with the 50 dma crossing the 200 dma indicating further upside pressures. Strong resistance is given at 1.4690 (22/01/2016 high). Long-term support can be found at 1.2461 (16/03/2015 low).
AUD/USD Short-Term Bullish
AUD/USD's technical structure is still negative. Yet, the pair is bouncing higher. The road is still wide-open for further weakness. Key resistance is given at 0.7778 (08/11/2016 high).
In the long-term, we are waiting for further signs that the current downtrend is ending. Key supports stand at 0.6009 (31/10/2008 low) . A break of the key resistance at 0.8295 (15/01/2015 high) is needed to invalidate our long-term bearish view.
EUR/USD Pushing Higher, GBP/USD Consolidation, USD/JPY Failed to Break Resistance at 115.62
EUR/USD Pushing Higher
EUR/USD continues to strengthen. Hourly resistance given at 1.0679 (16/02/2017 high) has been broken while hourly support at 1.0493 (22/02/2017 low). The technical structure suggests deeper consolidation towards 1.0500. • In the longer term, the death cross late October indicated a further bearish bias. The pair has broken key support given at 1.0458 (16/03/2015 low). Key resistance holds at 1.1714 (24/08/2015 high). Expected to head towards parity.
In the longer term, the death cross late October indicated a further bearish bias. The pair has broken key support given at 1.0458 (16/03/2015 low). Key resistance holds at 1.1714 (24/08/2015 high). Expected to head towards parity.
GBP/USD Consolidation
GBP/USD continues to edge lower despite ongoing consolidation since the pair has broken support given at 1.2254 (19/01/2017 low). The road is wide-open for further decline. Hourly resistance is now given at 1.2300 (05/03/2017 high).
The long-term technical pattern is even more negative since the Brexit vote has paved the way for further decline. Long-term support given at 1.0520 (01/03/85) represents a decent target. Long-term resistance is given at 1.5018 (24/06/2015) and would indicate a long-term reversal in the negative trend. Yet, it is very unlikely at the moment.
USD/JPY Failed to Break Resistance at 115.62
USD/JPY is pushing higher towards key resistance given at 115.62 (19/01/2016 high). Hourly support can be found at 113.56 (06/03/2017 low).
We favor a long-term bearish bias. Support is now given at 96.57 (10/08/2013 low). A gradual rise towards the major resistance at 135.15 (01/02/2002 high) seems absolutely unlikely. Expected to decline further support at 93.79 (13/06/2013 low).
WTI Oil Remains Under Strong Pressure And Could Extend Towards $47.32, Daily Cloud Base At $50 Expected To Cap...
Oil maintains strong bearish sentiment, generated on last week's steep fall that surged through thick daily cloud and broke below psychological $50 barrier.
Long bearish weekly candle that was formed continues to heavily weigh on the market.
Today's fresh extension below round-figure support at $48.00 met target at $47.90 (FE 238.2% of extended wave C), on which the price is currently riding.
The wave could extend towards next target at $47.32, its 261.8% Fibonacci Expansion, however, consolidative / corrective action could be expected as daily studies are strongly oversold (no firmer bullish signals yet).
Broken 200SMA offers good resistance at $48.71, with base of thick daily cloud (spanned between $50 and $53.11), expected to cap.
Res: 48.71, 50.00, 50.88, 51.58
Sup: 47.90, 47.32, 47.17, 46.38
GOLD May Attack The Top Of Rising Daily Cloud After Correction, As Overall Structure Remains Bearish
Spot Gold bounced from correction low at $1194 (the lowest since 31 Jan), where two-week pullback from $1263 peak found footstep.
Pullback was contained just above the top of rising daily cloud ($1193), with recovery attempts struggling at strong $1210 barrier (base of thick weekly cloud) and signaling that corrective action might be limited.
The scenario is supported by daily studies in firm bearish setup that suggest fresh weakness after correction and attack at daily cloud top.
Penetration into daily cloud could trigger bearish acceleration towards $1179/76 (daily cloud base / Fibo 61.8% of larger $1122/$1263 ascend.
However, extended corrective upticks could be anticipated and expected to hold below strong barrier at $1222(Fibo 38.2% of $1263/$1194 pullback, reinforced by falling daily Tenkan-sen line).
Only sustained break here would sideline downside risk and open way for extended correction.
Res: 1210, 1216, 1222, 1229
Sup: 1203, 1200, 1193, 1188