
Sample Category Title
USD/JPY Daily Outlook
Daily Pivots: (S1) 114.59; (P) 114.75; (R1) 115.04; More...
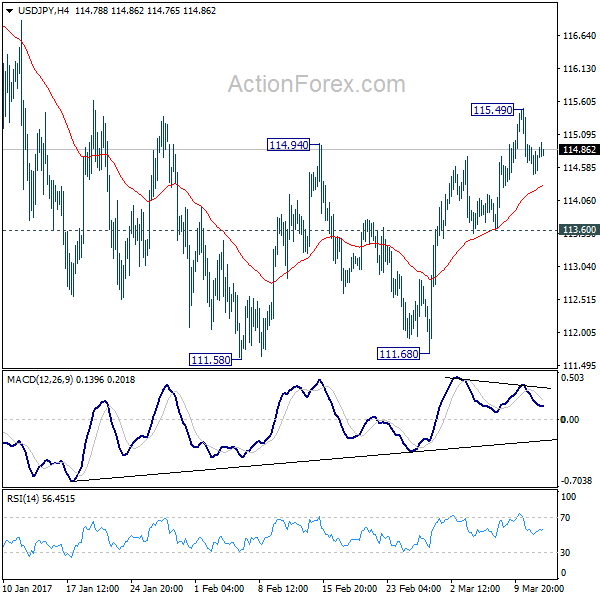
Intraday bias in USD/JPY remains neutral as consolidation from 115.49 temporary low continues. Deeper retreat could be seen to 4 hour 55 EMA (now at 114.30). Downside is expected to be contained above 113.60 support and bring another rally. As noted before, corrective decline from 118.65 should have completed with a a double bottom pattern (111.58, 111.68). Above 115.49 should turn bias to the upside and pave the way for a test on 118.65. Decisive break there will extend whole rise from 98.97 and target 125.85 high next. On the downside, however, break of 113.60 will invalidate our view and turn bias back to the downside for 111.58/68 support zone instead.
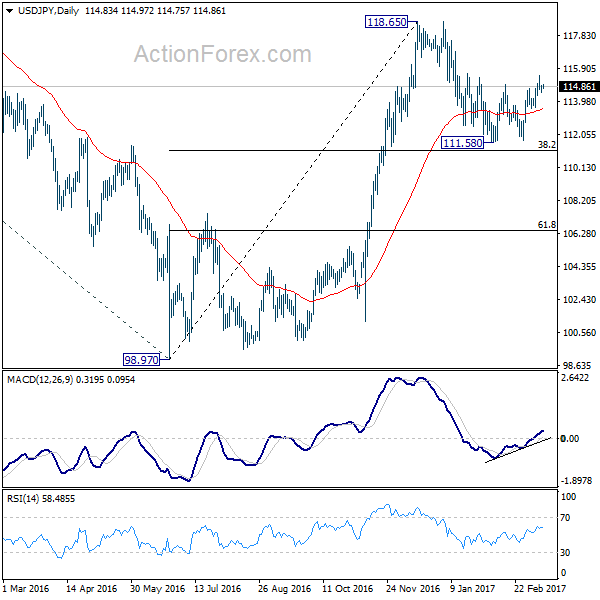
In the bigger picture, price actions from 125.85 high are seen as a corrective pattern. The impulsive structure of the rise from 98.97 suggests that the correction is completed and larger up trend is resuming. Decisive break of 125.85 will confirm and target 61.8% projection of 75.56 to 125.85 from 98.97 at 130.04 and then 135.20 long term resistance. Rejection from 125.85 and below will extend the consolidation with another falling leg before up trend resumption.
Markets Staying in Range, Sterling Lower as Commons Backed PM May
The financial markets are generally staying in tight range in Asian session today as traders await the heavy-weight events later in the week. US equities ended mixed overnight with DJIA closed down -22.5 pts, or -0.1% at 20881.48. S&P 500, on the other hand, gained 0.87 pts, or 0.04%, to close at 2373.47. Treasury yields also rose with 30 year yield gained 0.023 to close at 3.192. Meanwhile, 10 year yield gained 0.026 to close at 2.608. But both are limited below recent resistance at 3.197 and 2.621 respectively. Gold is trying to regain 1200 handle for the moment. WTI crude oil turned sideway after breaching 48 handle briefly. Dollar index is trying to draw support from 55 day EMA and is trading at 101.40 at the time of writing. Forex pairs are all trading inside Monday's range.
House of Commons Passed Brexit Bill
In UK, Sterling trades lower as this week's recovery lost steam. The Parliament passed the bill allowing Prime Minister Theresa May to trigger Article 50 for Brexit negotiation. The House of Commons overturned the amendments of the House of Lords, including the guaranteed rights for EU citizens staying in UK, and a vote by the Parliament on the final Brexit agreement. Brexit Secretary David Davis said that "Parliament has today backed the Government in its determination to get on with the job of leaving the EU and negotiating a positive new partnership with its remaining member states." May will address the House of Commons today. Some expect May to wait until the end of the month to trigger Brexit. But there are speculations that May could announce it this week.
Staying in UK, Scottish First Minister Nicola Sturgeon confirmed that she would ask for permission to hold a second independence referendum. PM May warned that the move would set Scotland on a course for "more uncertainly and division" as the majority of Scottish people do not want a second vote. As May noted, "the tunnel vision that SNP has shown today is deeply regrettable... Instead of playing politics with the future of our country, the Scottish government should focus on delivering good government and public services for the people of Scotland. Politics is not a game".
Dutch to Vote on March 15
Elsewhere in Europe, the Netherlands' general election would be held on March 15. With fractured political environment, no party is expected to gain a majority. And it's expected that as many as five parties could be needed to form the coalition even though the Liberals are tipped to secure a majority of votes. Nonetheless, firstly, with rising popularity of the far-right candidate Geert Wilders, leader of the Party of Freedom, the market is concerned his victory would intensify anti-EU/euro debates. Secondly, the result of the Dutch election is another indicator of populism in Europe and is seen as a precursor to French elections in April and May.
Fed to revise median "dot plot"
On the other side of the Atlantic, markets are awaiting the FOMC rate decision on Wednesday. The Fed is 99.99% certain to increase the policy rate by 25 bps. The is seen as driven by improvement in the economic outlook with the employment and inflation data showing that the Fed is on the way to achieve its dual mandate. We expect the policy statement to sound more upbeat and point to faster rate hike this year. Fed fund futures are pricing in 64% chance of another hike by June. The point of interests will be on economic projections and in particular the median "dot plot" rate path. Back in December, Fed projected interest rate to hit 1.4% by the end of 2017 and 2.1% by end of 2018. Upward revision in these two figures would fuel rally in Dollar.
On the data front...
China has released just now that industrial production expanded 6.3% yoy in the first two months of the year, up from consensus of 6.1% and December's 6%. Urban fixed asset investment (FAI) grew 8.9% yoy during the period, beating consensus of 8.3% and 8.1% previously. However, the growth of retail sales moderated to 9.5% yoy, from 10.4% in December. The market had anticipated stronger growth of 10.6%. For the day ahead, US PPI probably eased to 0.1% mom in February, from 0.6% a month ago, while the core reading slowed to 0.2%, from 0.4% previously. In the Eurozone, industrial production probably expanded 1.2% mom in January, after a -1.6% contraction in the prior month. On the sentiment data, the ZEW economic sentiment index for Germany probably added 1.6 points to 12 in March, while the current situation index added 2.2 points to 78 this month.
GBP/USD Daily Outlook
Daily Pivots: (S1) 1.2159; (P) 1.2205; (R1) 1.2263; More...
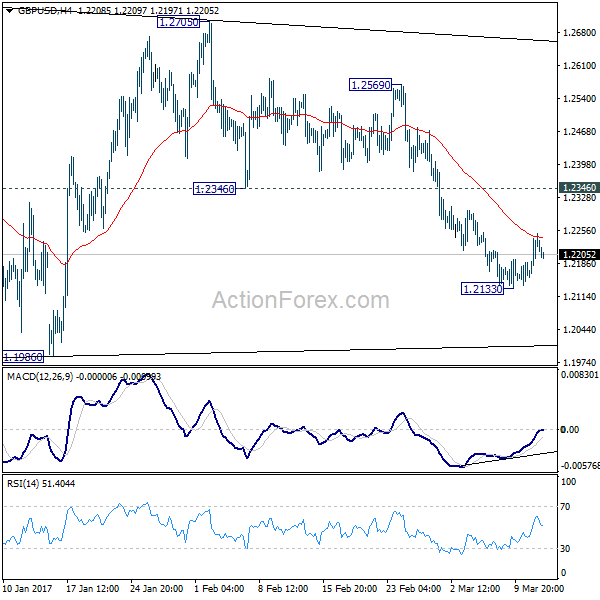
GBP/USD's recovery from 1.2133 was limited by 4 hour 55 EMA and weakens mildly today. Intraday bias stays neutral first as the consolidation could extend. Another recovery cannot be ruled out but upside should be limited by 1.2346 support turned resistance and bring fall resumption. As noted before, consolidation pattern from 1.1946 is completed at 1.2705 is resuming larger down trend. On the downside, below 1.2133 will turn bias to the downside for retesting 1.1946/86 support zone. Break of 1.1946 will confirm our bearish view. However, sustained break of 1.2346 will dampen out view and turn focus back to 1.2569 resistance first.
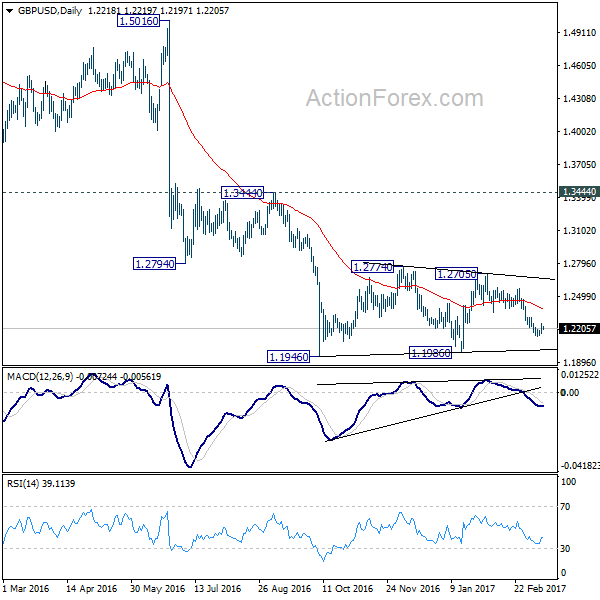
In the bigger picture, fall from 1.7190 is seen as part of the down trend from 2.1161. There is no sign of medium term bottoming yet. Sustained trading below 61.8% projection of 2.1161 to 1.3503 from 1.7190 at 1.2457 will target 100% projection at 0.9532. Overall, break of 1.3444 resistance is needed to confirm medium term bottoming. Otherwise, outlook will remain bearish.
Economic Indicators Update
| GMT | Ccy | Events | Actual | Forecast | Previous | Revised |
|---|---|---|---|---|---|---|
| 0:30 | AUD | NAB Business Confidence Feb | 7 | 10 | ||
| 2:00 | CNY | Industrial Production YTD Y/Y Feb | 6.30% | 6.10% | 6.00% | |
| 2:00 | CNY | Fixed Assets Ex Rural YTD Y/Y Feb | 8.90% | 8.30% | 8.10% | |
| 2:00 | CNY | Retail Sales YTD Y/Y Feb | 9.50% | 10.60% | 10.40% | |
| 7:00 | EUR | German CPI M/M Feb F | 0.60% | 0.60% | ||
| 7:00 | EUR | German CPI Y/Y Feb F | 2.20% | 2.20% | ||
| 10:00 | EUR | Eurozone Industrial Production M/M Jan | 1.20% | -1.60% | ||
| 10:00 | EUR | German ZEW (Economic Sentiment) Mar | 12 | 10.4 | ||
| 10:00 | EUR | German ZEW (Current Situation) Mar | 78 | 76.4 | ||
| 10:00 | EUR | Eurozone ZEW (Economic Sentiment) Mar | 19.3 | |||
| 12:30 | USD | PPI M/M Feb | 0.10% | 0.60% | ||
| 12:30 | USD | PPI Y/Y Feb | 1.60% | |||
| 12:30 | USD | PPI Core M/M Feb | 0.20% | 0.40% | ||
| 12:30 | USD | PPI Core Y/Y Feb | 1.20% |
GBP/USD Daily Outlook
Daily Pivots: (S1) 1.2159; (P) 1.2205; (R1) 1.2263; More...
GBP/USD's recovery from 1.2133 was limited by 4 hour 55 EMA and weakens mildly today. Intraday bias stays neutral first as the consolidation could extend. Another recovery cannot be ruled out but upside should be limited by 1.2346 support turned resistance and bring fall resumption. As noted before, consolidation pattern from 1.1946 is completed at 1.2705 is resuming larger down trend. On the downside, below 1.2133 will turn bias to the downside for retesting 1.1946/86 support zone. Break of 1.1946 will confirm our bearish view. However, sustained break of 1.2346 will dampen out view and turn focus back to 1.2569 resistance first.
In the bigger picture, fall from 1.7190 is seen as part of the down trend from 2.1161. There is no sign of medium term bottoming yet. Sustained trading below 61.8% projection of 2.1161 to 1.3503 from 1.7190 at 1.2457 will target 100% projection at 0.9532. Overall, break of 1.3444 resistance is needed to confirm medium term bottoming. Otherwise, outlook will remain bearish.
Market Morning Briefing
STOCKS
The sweeping victory of BJP in the state election results on Saturday would be taken positively in the Indian Markets today. Nifty (8934.55, +0.08%) could open with a gap up today and could well break beyond the 9000 level on the upside. Initial target of 9280 opens up on the upside.
Dow (20881.48,-0.10%) is almost stable near current levels. Immediate support near 20750, if holds could take it back towards 21200; else some consolidation could be expected in the near term. A break below 20750 could turn bearish for the coming sessions.
Dax (11990.03, +0.22%) could move higher from current levels towards 12200. In case a break below 11990 is seen, we could possibly expect the fall to extend towards 11800 or lower before bouncing back from there.
Nikkei (19614.24, -0.10%) could come off from immediate resistance near 19620. Note that the US-Japan yield spread is testing crucial medium term resistance and if that holds could push off Nikkei in the coming sessions.
Shanghai (3244.64, +0.24%) looks bearish in the near term while resistance near 3250 holds. A break above 3250 is necessary to confirm any upside reversal.
COMMODITIES
Gold(1204) is trading slightly higher levels from pervious week’s low low of 1193. We continue to look for a bounce from 1200 levels in the near term. It may spend a few sessions within the 1190-1220 region before the FOMC funds rate announcement on 15th March. We will remain bearish until it is trading below 1240.
Silver (16.96) has tested immediate support near 16.65-72 before closing slightly higher. A break below 16.65 could take it down to 15.60. The bias will remain weak until it is trading below 17.45.
Copper (2.63) has also bounced back from 2.55 and may ranged bound between 2.58-65. A close above 2.72 could open up 2.83 as well.
Taking a look at the energy section, a bounce back could be expected for both Brent (51.35) and WTI (48.38). Brent could be headed towards 52-52.50 and WTI towards 49.60-50 in near term. We have US crude inventory data, tomorrow at 8.00 pm and a further increase in weekly stocks is more likely to be already discounted in the price, thus we should be cautious about any further depreciation for both Brent and crude in near term. Immediate supports are poised at 50.50 for Brent and 46.50 for WTI respectively. Only a close below these levels could open up further downside.
FOREX
The BJP sweeping win in UP has unleashed a huge bullish sentiment in the market which has strengthened the Rupee considerably. The global markets wait for the FOMC meet to conclude by tomorrow where a rate hike is fully expected.
Dollar Index (101.39) has tested the major support near 101.00 and bounced back strongly which may push it towards 102.00-30 once again in the rest of the week.
Euro (1.0653) has revisited higher levels of 1.07 contrary to expectations but the jitteriness over the Dutch elections with the rising odds of a populist victory have pushed it down once again and the rest of the week may see it gradually declining towards 1.0550-00 levels.
The immediate resistance of 123.00 may hold for EURJPY (122.33) with the long term resistance looming around 124.00. It may keep Euro below 1.07 this week.
Dollar-Yen (114.85) is held below 115.00-50 as the US-Japan 10Yr struggles around the major resistance at the current levels (See Interest rates section) as discussed last week. The near term bias remains bullish but a firm break of the yield differentials may help it to rise to the higher resistance levels of 116.00 and 117.50.
Pound (1.2199) is shrugging off the Brexit impact as it remains steady even as the UK PM looks set to trigger Article 50 this week. The upside looks capped to 1.23 for the next few days with the downside possibility to 1.20 levels still open. As discussed previously, it remains to be seen if any bottoming price action may take place around the current levels or not.
Aussie (0.7558) has held above the immediate support of 0.75 and bounce back to 0.76 levels just as expected. Now the bias in the range of 0.75-0.76 remains neutral. Only a firm break from this range can give directional clue in the near term.
Dollar-Rupee (66.60) is trading near 66.15 levels in the NDF market today, an 11-month low after the overwhelming win of BJP in UP. Below the long term support of 66.50-35 comes 66.00-65.90 and 65.50. It remains to be seen where Dollar Rupee makes the low for the day.
INTEREST RATES
The US 10-5Yr (0.48%) has moved up from channel support and could be headed towards 0.50% and higher in the near term.
The US yields are headed higher and could move up further in the near term. The 5Yr (2.14%), 10Yr (2.62%) and the 30YR (3.20%) are trading higher than previous levels of 2.08%, 2.56% and 3.15% respectively.
The German 10-2YR (1.2820%) has come off slightly from immediate resistance levels and could test 1.20-1.98% in the near term. The German yields by themselves have paused after a sharp rise in the past few sessions. A short corrective dip could be seen now.
The US-Japan 10YR (2.53%) is testing medium term resistance near current levels. While that holds, a corrective dip towards 2.40% may be expected in the near term. This could possibly limit the upside for Dollar-Yen and Nikkei in the coming sessions.
Foreign Exchange Market Commentary
EUR/USD
The EUR/USD pair closed the day in the green at 1.0665 after peaking at 1.0713, its highest since February 7th. Dollar's broad weakness seen late Friday extended in a quiet macroeconomic journey, as there were no major releases in Europe or the US. The common currency continued to find demand on Friday's headlines about ECB considering tapering ahead of the end of their QE program by the end of this year, maintaining a positive tone near term, although the absence of news, alongside with the upcoming Fed meeting next Wednesday, kept volumes at lows. Things will become more interesting on Tuesday, as Germany will release February inflation figures, and the March ZEW survey, the EU will unveil January Industrial Production, while in the US, February PPI will take center stage.
From a technical point of view, and despite the mentioned high, the pair has made little progress, given that no critical level has been broken. Around 1.0710, the pair has the 38.2% retracement of the post-US election slide, and investors have been unwilling to push the price beyond it ever since early February, amid political uncertainty at both shores of the Atlantic. Intraday and for the upcoming sessions, the 4 hours chart shows that technical indicators are easing from extreme overbought readings achieved at the beginning of the day, but also that the 20 SMA maintains a strong bullish slope after breaking above the 100 SMA, this last indicating a limited downward scope. A downward corrective movement towards the 1.0630 region seems likely, while a break below this last should favor a deeper downward corrective move.
Support levels: 1.0635 1.0600 1.0565
Resistance levels: 1.0710 1.0755 1.0790
USD/JPY
The USD/JPY pair ended the day flat around 114.70, confined to a tight 50 pips range ever since the day started, but with the scale leaned towards the downside. The Japanese yen saw some early demand, but mixed data coming from Japan kept the pair on check. The Producer Price Index came in at 1.0% YoY in February, matching expectations, but above previous 0.5%, while machinery orders plunged at the beginning of the year, down by 3.2% in January from a 6.7% advance in December, and falling 8.2% yearly basis. There was mounting speculation about the BOJ reducing their facilities, after headlines suggesting that, given the decline in yields, the Central Bank would need to buy less than the 80 trillion yen per year. Further keeping the pair limited were US Treasury yields that consolidated near their recent highs. The pair bounced modestly from a major Fibonacci support, the 23.6% retracement of the November/December rally around 114.50, but technical readings in the 4 hours chart fail to provide a clear sign on what's next, as technical indicators hover around their mid-lines, whilst the large moving averages remain pretty much flat and converging within a tight range well below the current level.
Support levels: 114.50 114.15 113.70
Resistance levels: 115.10 115.50 115.85
GBP/USD
The Pound benefited from dollar's weakness, with the GBP/USD pair regaining the 1.2200 level, and holding above it during the last two sessions. The pair traded as high as 1.2250, getting some help from Brexit´s Minister David Davis who asked the Parliament to clear the path for PM May to begin negotiations with the EU to begin the exit process. The Brexit bill returned to the House of Commons this Monday. Also, Scottish PM Nicola Sturgeon announced a plan to stage a second independence referendum within the next two years, claiming that UK PM May has ignored Scotland´s desires of maintaining full access to the EU single market after the Brexit. The news should have been Pound negative, but attention is now centered in the US and what the Federal Reserve will say this week. As it was the case for the EUR/USD pair, Pound's recovery against the greenback stalled near a major Fibonacci resistance, the 61.8% retracement of the January rally around 1.2260. Technical readings in the 4 hours chart maintain the risk towards the upside, as the price settled well above a now bullish 20 SMA, whilst technical indicators have moderated their advances, but remain far above their mid-lines. A break above the mentioned resistance should open doors for an extension up to 1.2345, the 50% retracement of the same rally and February low.
Support levels: 1.2190 1.2150 1.2110
Resistance levels: 1.2260 1.2300 1.2345
GOLD
Spot gold closed the day marginally lower at $1,204.10 a troy ounce this Monday, failing to sustain early gains, as the commodity traded as high as 1,211.13 due to broad dollar weakness. Different risk events, including Dutch elections, the US Federal Reserve meeting, and the possibility of UK's May triggering the Art. 50 of the Lisbon Treaty, were not enough to fuel demand for the safe-haven asset, as bulls are side-lined on a possible rate hike in the US this Wednesday. From a technical point of view, the daily chart shows that the price retreated from around the 38.2% retracement of the December/February rally, whilst technical indicators keep heading south near oversold readings, maintaining the risk towards the downside. In the 4 hours chart, the price settled around its 20 SMA, whilst technical indicators remain horizontal, the Momentum around its 100 level and the RSI indicator around 40. The 50% retracement of the mentioned rally stands at 1,193.00, still the main support and the level to break to confirm additional slides during the upcoming sessions.
Support levels: 1,197.10 1,188.20 1,180.50
Resistance levels: 1,210.00 1,218.50 1,226.70
WTI CRUDE
Crude oil prices extended their declines at the beginning of the week, with WTI futures trading as low as $47.90 a barrel before settling at 48.40, unchanged from Friday's close. There were no major news coming from the sector, with the market now eyeing EIA's weekly storage report to decide whether to extend the sell-off or re-buy the commodity. The technical outlook is still bearish, given that in the daily chart, the price has remained well below all of its moving averages, whilst technical indicators pulled modestly higher within oversold territory, rather reflecting the latest bounce than confirming downward exhaustion. In the shorter term, and according to the 4 hours chart, the technical picture is quite alike, with the RSI recovering modestly, but standing now at 26, the Momentum indicator heading higher below the 100 level, and the 20 SMA maintaining a sharp bearish slope, now around 49.10, and providing a dynamic resistance in the case of an upward move.
Support levels: 48.00 47.30 46.65
Resistance levels: 49.10 49.75 50.40
DJIA
US stocks saw little action this Monday, with the three major indexes closing mixed, but not far from their opening levels. The Dow Jones Industrial Average closed in the red, down 21 points or 0.10%, to 20,881.48. The Nasdaq Composite added 14 points, to 5,875.78, while the S&P closed 0.04% higher at 2,373.47. Cautious prevailed ahead of the Federal Reserve meeting this Wednesday, exacerbated by the absence of macroeconomic headlines to drive the mood. Within the Dow, Walt Disney topped winners' list, adding 0.52%, whilst El du Pont added the same percentage. Intel was the worst performer, down 2.23%, followed by General Electric that lost 1.39%. From a technical point of view, the DJIA held a few points above its 20 DMA, currently at 20,852, whilst technical indicators have lost directional strength, but hold within positive territory, with the RSI indicator holding around 64, all of which limits the possibility of a steeper decline. In the 4 hours chart, the index remains stuck around a modestly bearish 20 SMA, and above a still bullish 20 SMA, although the fact that both moving averages are so close, with the shortest easing, is a first sign of bearish pressure. In this last chart, however, the Momentum indicator bounced modestly from the 100 level, whilst the RSI indicator remains flat in neutral territory, failing to provide clear directional signs for the upcoming sessions.
Support levels: 20,852 20,817 20,777
Resistance levels: 20,922 20,978 21,045
FTSE 100
The FTSE 100 managed to advance for a second consecutive day, adding 24 points to close at 7,367.08, underpinned by a recovery in the mining-related sector. Equities traders shrugged off Brexit concerns and a stronger Pound, focusing on the advance in base metals. Fresnillo led advancers, adding 5.59%, followed by Antofagasta which added 4.88%. Anglo American gained 4.03%, while Rio Tinto advanced 3.96%. Financials underperformed all across the region, and within the Footsie, Standard Life shed 2.24%, Royal Bank of Scotland lost 151%, while Barclays closed 0.71% lower. Technically, the daily chart shows that the London benchmark retains a modestly positive tone, holding above its 20 DMA and with technical indicators bouncing from their mid-lines, although with limited upward momentum. In the shorter term, and according to the 4 hours chart, the upward potential is a bit more constructive, as the index extended its advance above a now flat 20 SMA, whilst technical indicators maintain their bullish slopes within positive territory and at fresh 2-week highs.
Support levels: 7,332 7,306 7,262
Resistance levels: 7,397 7,420 7,450
DAX
European equities closed little changed this Monday, with the German DAX up 26 points or 0.22%, to close at 11,990.03, with automakers leading the way higher. There were no major news coming from Germany, but the country will release the final revisions for February inflation, expected to remain unchanged, and the ZEW confidence survey for March, expected to improve from February's setback. ThyssenKrupp was the best performer, advancing 2.30%, followed by Volkswagen that gained 1.53% and Daimler which added 1.50%. The worst performer was Deutsche Boerse that shed 0.63%, while Commerzbank closed 0.05% lower and Deutsche Bank also posted a modest lost. The index flirts with 12,000 ahead of the Asian opening, still holding above a bullish 20 SMA, today at 11,920, while the RSI indicator heads north around 60, whilst the Momentum indicator holds around its 100 level. In the 4 hours chart, the index maintains a neutral stance, as the index is a few pips above a flat 20 SMA whilst technical indicators head nowhere around their mid-lines.
Support levels: 11,909 11,857 11,819
Resistance levels: 12,018 12,067 12,100
Daily Technical Analysis
EURUSD
The EURUSD attempted to push higher yesterday topped at 1.0714 but whipsawed to the downside and closed lower at 1.0650. The bias is neutral in nearest term probably with a little bearish bias testing 1.0630/00 support area which is a good place to buy with a tight stop loss as a clear break below that area would expose 1.0500 region. Immediate resistance is seen around 1.0675. A clear break above that area could trigger further bullish pressure testing 1.0750 – 1.0800 region which is a good place to sell. Overall I remain neutral and price has been moving sideways without clear direction so selling on resistances and buying on supports with a tight stop loss seems to be the best strategy.
GBPUSD
The GBPUSD had a bullish momentum yesterday topped at 1.2250 after formed a triple bottom formation (1.2135) as you can see on my daily chart below. The bias is bullish in nearest term testing 1.2300/50 region. Immediate support is seen around 1.2195. A clear break below that area could lead price to neutral zone in nearest term testing 1.2150/35 support area but key support remains at 1.2000 psychological level which remains a good place to buy. Overall I remain neutral.
USDJPY
The USDJPY was indecisive yesterday. The bias remains neutral in nearest term. Key resistance remains at 115.60 region which is a good place to sell with a tight stop loss. Immediate support is seen around 114.35. A clear break and daily close below that area would expose 113.50/00 region. On the upside, a clear break and daily close above 115.60 would expose 117.00 – 118.60 area.
USDCHF
The USDCHF had a moderate bearish momentum yesterday bottomed at 1.0060. As you can see on my H4 chart below price slipped below the bullish channel but still struggling around the H4 EMA 200. The bias is bearish in nearest term testing 1.0000. Immediate resistance is seen around 1.0100. A clear break back above that area could lead price to neutral zone in nearest term testing 1.0150 area. Overall I remain neutral.
The Waiting Game
The Waiting Game
With little news overnight, what moves we saw could be attributed to pre-FOMC positioning. But let’s not forget the New York markets are bracing from Winter Storm Stella which is anticipated to dump anywhere between 15-20 inches as it blasts up the east coast, stranding thousands of travellers including German Chancellor Merkel, whose meeting with President Trump has been rescheduled to March 17. Markets are in a holding pattern overnight ahead of the heavy docket of Macro events later this week (i.e., Fed/BoJ /BoE / Dutch elections).
Australian Dollar
The Australian dollar was full of vim after the downward momentum started to fade late last week. And while the US payrolls failed to live up to the market’s lofty expectations, there was a modest retracement higher on sagging USD appetite. However, I suspect the move was assisted by the EURAUD coming back to earth as the market weights it’s overall Euro risk appetite. US equities moved slightly higher led by an outperformance in metal and mining stocks after the underlying commodities had a good rally yesterday. Meanwhile, all eyes will be on the China Data dump, as the markets expect industrial production, fixed-asset investment and retail sales to have risen by 6.2%, 8.3%, and 10.6% respectively.
On the domestic front, Australia February NAB confidence has come slightly lower at seven versus ten prior. The business conditions are also more moderate at nine versus 16 prior. AUDUSD momentum has sagged but has held the critical .7550 level ahead of the Chinese Data
Euro
A minor inflexion point as traders mull over the prospects of their latest sweetheart trade, EUR and JPY crosses, to power on as price action through this full slate of Central Bank events will clearly indicate if we’re at the nub of a trend or will the market fall back to USD exclusive mode again. Not lots of information overnight, but one senses some friction amongst the ECB sitting hawks and doves. The doves carried the tone in the statement, but Draghi’s press conference was a touch on the hawkish side. How much the Euro trade remains in vogue will be dictated by just how hawkish the Fed will tilt later in the week. On the flip side, one has to wonder why the Euro vols are looking too cheap for potential risk events that could be as large as Brexit, we know Le Pen is behind in the polls, but given recent history, it might too soon to count out the “ silent majority.”
Japanese Yen
Positioning will dominate USDJPY pre -FOMC as the markets ping pong back and forth tracking the session high and low on the US 10 year treasuries.
Crude Struggling at 14-Week Lows on Oversupply Concerns
West Texas crude has steadied in the Monday session, following sharp losses last week. In North American trade, WTI crude futures are trading at $48.38. Brent Crude is trading at $51.36, as the Brent premium stands at $2.98. It's a quiet start to the week, with no releases on Monday. On Tuesday, the sole release is US PPI, with the markets expecting a weak gain of 0.1%.
Last week was one to forget for WTI crude, as the commodity plunged 8.7 percent. On Monday, WTI crude briefly dropped below the $48, for the first time since November 30. Will the downturn continue this week? Crude is under strong pressure as crude stockpile reports continue to point to surpluses. Last week, the Crude Inventories soared to 8.2 million barrels, well above the forecast of 1.1 million. US crude has posted surpluses in 11 of the past 12 weeks, reflective of increasing US shale production. Most of the surpluses have been much higher than the forecasts, as the markets continue to underestimate the level of crude stockpiles. The ongoing surplus has put a damper on OPEC's hopes to raise prices, as the cartel cut production levels at the beginning of January. Compliance with the agreement stands at an impressive 94% and OPEC had high hopes of pushing crude to $60 or more, but oil prices have actually declined in 2017.
It's full steam ahead for the US economy, buoyed by a red-hot labor market. On Friday, Nonfarm Payrolls sparkled with a gain of 235 thousand. This easily beat the estimate of 196 thousand. The strong release makes it a virtual certainty that the Fed will raise rates by a quarter-point on Wednesday. Although a rate hike has been priced in by the markets, there have been disappointments in the past, so a rate move will likely give the dollar a boost against its major rivals, such as the euro. The solid job numbers also give President Trump a much-needed boost. Trump is under pressure to present an economic agenda, but the markets won't mind giving him some additional breathing room with the economy performing well.
Pound Pushes Higher on Brexit Speculation
GBP/USD has started the week with gains. In Monday's North American session, the pair is trading at 1.2230. There are no economic events in the US or the UK. On Tuesday, the sole release is US PPI, with the markets expecting a weak gain of 0.1%.
There is increasing speculation that Theresa May's government may pull the Brexit trigger on Tuesday and invoke Article 50, the mechanism for initiating Britain's departure from the European Union. The government still has some house tidying to do, as the House of Lords made some changes to the government's Brexit legislation. Prime Minister May, who has repeated that she will trigger Article 50 in March, has argued that the government needs to be free of any restrictions in order to obtain the best possible deal for the UK. Under Article 50, the negotiations are slated to take up to two years. Relations between Britain and the EU have nosedived since the stunning Brexit vote in June. The timing of invoking Article 50 comes at a particularly delicate time for Europe, as the Netherlands holds elections this week and France goes to the polls in April. If Tuesday is Article 50 Day, the pound could post strong gains against its major rivals.
It's full steam ahead for the US economy, buoyed by a red-hot labor market. On Friday, Nonfarm Payrolls sparkled with a gain of 235 thousand. This easily beat the estimate of 196 thousand. The strong release makes it a virtual certainty that the Fed will raise rates by a quarter-point on Wednesday. Although a rate hike has been priced in by the markets, there have been disappointments in the past, so a rate move will likely give the dollar a boost against its major rivals, such as the euro. The solid job numbers also give President Trump a much-needed boost. Trump is under pressure to present an economic agenda, but the markets won't mind giving him some additional breathing room with the economy performing well.
Elliott Wave Trade Ideas Performance Update
The short position entered earlier in aussie at 0.7690 finally met our indicated downside target at 0.7550 and scored 140 points profit. We then entered another short position at 0.7605, however, the pair found good support at 0.7491 and has rebounded, the position stopped profit at 0.7585.
A long position was entered in EUR/JPY at 120.95 and euro did find renewed buying interest at 120.86 and rallied in line with our bullish expectation, upside target at 122.55 was met quite quickly, price rose to 122.89 earlier today before retreating.
No position was entered in other currency pairs last week.
In short, 3 positions were entered in the past two weeks with total profit of 320 points and the positions are listed below.
22 Feb : AUD/USD - Short at 0.7690, exited at 0.7550 (+ 140 points)
8 Mar : AUD/USD - Short at 0.7605, exited at 0.7585 (+ 20 points)
10 Mar : EUR/JPY - Long at 120.95, exited at 122.55 (+ 160 points)
| AUD EUR/JPY EUR/GBP CAD
Jan - 15 -275 - 35 -120
Feb + 140 -17 - 40 +11
Mar + 20 +160
Apr
May
Jun
Jul
Aug
Sep
Oct
Nov
Dec
Y-T-D + 145 - 132 - 75 + 57