
Sample Category Title
EUR/CHF Daily Outlook
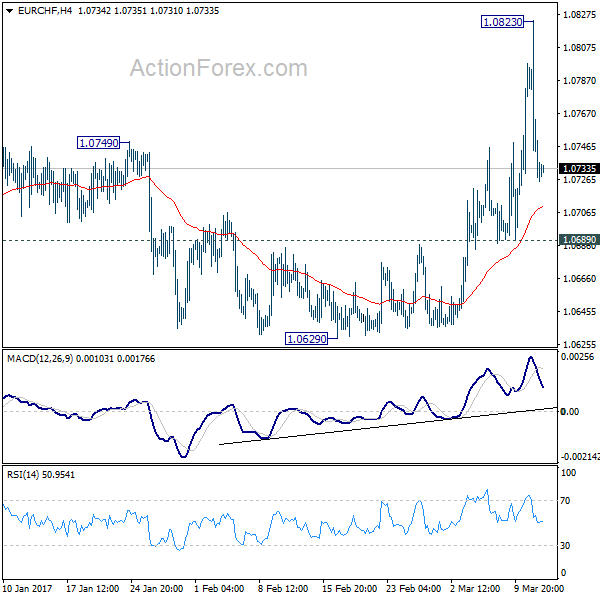
Daily Pivots: (S1) 1.0695; (P) 1.0760; (R1) 1.0793; More...
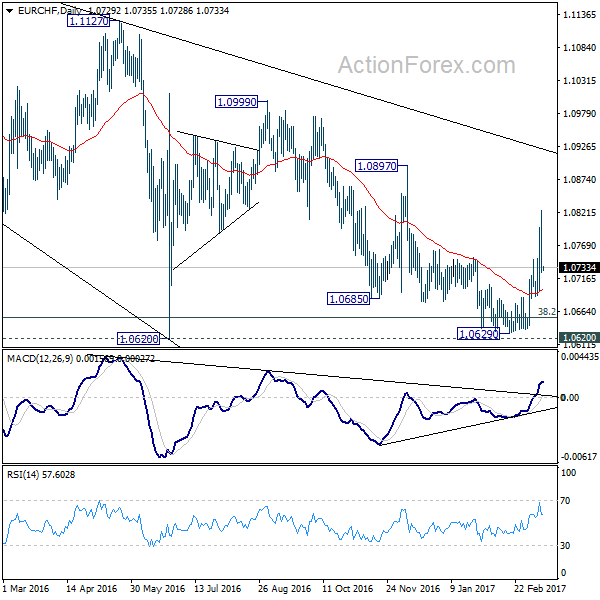
EUR/CHF spiked higher to 1.0823. However, it quickly retreated sharply since then. Intraday bias is turned neutral first. We're favoring the case of trend reversal, on bullish convergence condition in daily MACD, after defending 1.0620 key support level. That is, correction from 1.1198 could have completed. Above 1.0823 will target 1.0897 resistance next. However, break of 1.0689 support will dampen our view and turn focus back to 1.0629 low again.
In the bigger picture, the decline from 1.1198 is seen as a corrective move. Decisive break of 1.0897 resistance should confirm that it's completed. And in that case, larger up trend is resuming for another high above 1.1198. Meanwhile, sustained trading below 38.2% retracement of 0.9771 to 1.1198 at 1.0653 will target 50% retracement at 1.0485.
AUD/USD Daily Outlook
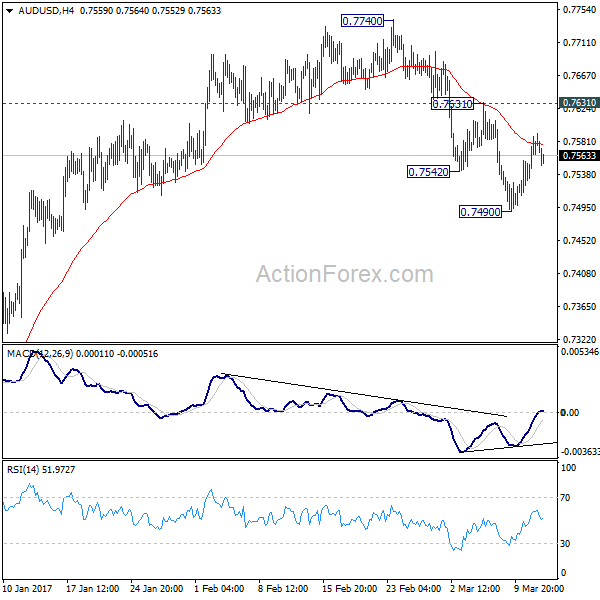
Daily Pivots: (S1) 0.7539; (P) 0.7565; (R1) 0.7598; More...
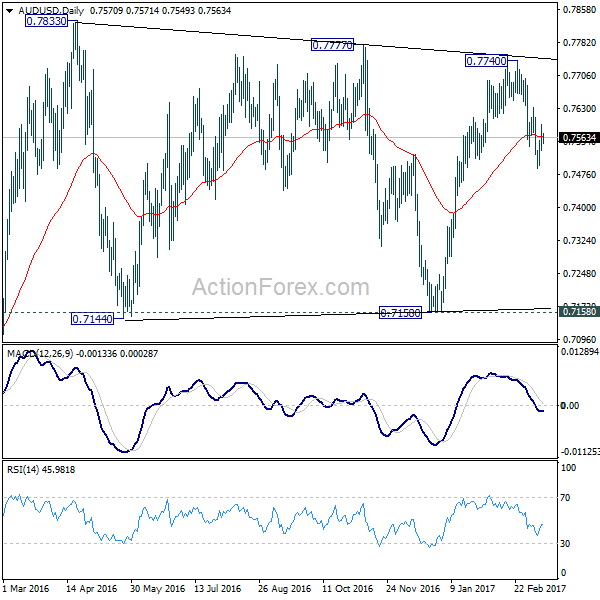
Intraday bias in AUD/USD remains neutral as the corrective rise from 0.7490 is still in progress. We'd expect recovery to be limited by 0.7631 resistance and bring fall resumption. As noted before, rise from 0.7150 has completed at 0.7740 already. Below 0.7490 will turn bias back to the downside and target 0.7144/7158 support zone. However, break of 0.7631 resistance will dampen our bearish view and turn bias back to the upside for 0.7740 instead.
In the bigger picture, we're still treating price actions from 0.6826 low as a correction. And, as long as 38.2% retracement of 0.9504 to 0.6826 at 0.7849 holds, long term down trend from 1.1079 is expected to resume sooner or later. Break of 0.6826 low will target 0.6008 key support level. However, firm break of 0.7849 will indicate that rise from 0.6826 is developing into a medium term rebound, rather than a sideway pattern. In such case, stronger rise should be seek to 55 month EMA (now at 0.8185) and above.
USD/CAD Daily Outlook
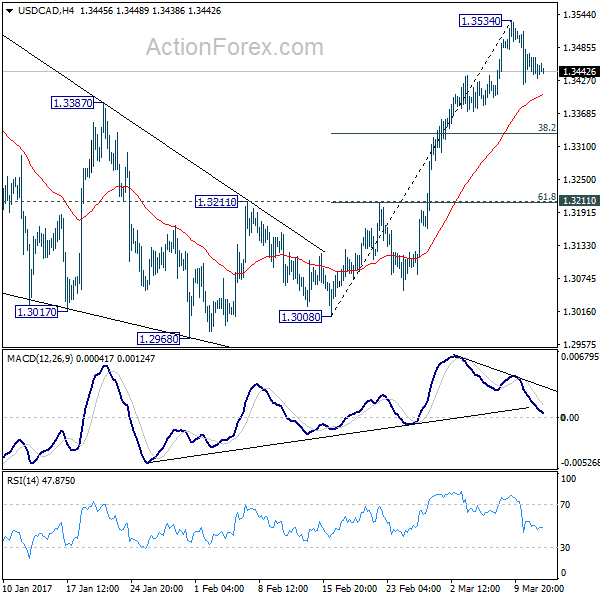
Daily Pivots: (S1) 1.3425; (P) 1.3450; (R1) 1.3471; More...
USD/CAD is staying in consolidation from 1.3534 and intraday bias remains neutral first. Deeper retreat cannot be ruled out. But we'd expect downside to be contained by 38.2% retracement of 1.3008 to 1.3534 at 1.3333 and bring another rally. Above 1.3534 will turn bias to the upside for retesting 1.3598 high next.
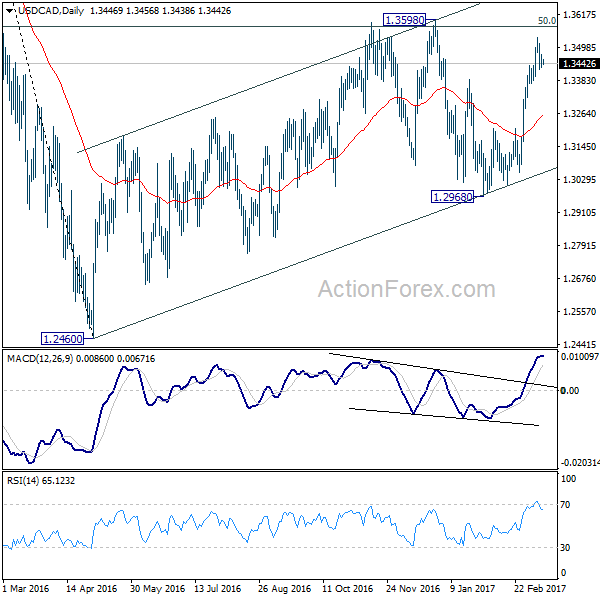
In the bigger picture, price actions from 1.4689 medium term top are seen as a correction pattern. The first leg has completed at 1.2460. The second leg, started from 1.2460 is likely still in progress and could target 61.8% retracement of 1.4689 to 1.2460 at 1.3838. We'd look for reversal signal there to start the third leg. Break of 1.2968 wold at least bring at retest of 1.2460 low. However, sustained trading above 1.3838 would pave the way to retest 1.4689 high.
European Open Briefing
Global Markets:
- Asian stock markets: Nikkei down 0.10 %, Shanghai Composite gained 0.10 %, Hang Seng and ASX 200 both declined 0.05 %
- Commodities: Gold at $1203 (-0.05 %), Silver at $16.98 (+0.05 %), WTI Oil at $48.45 (+0.10 %), Brent Oil at $51.40 (+0.10 %)
- Rates: US 10-year yield at 2.62, UK 10-year yield at 1.25, German 10-year yield at 0.47
News & Data:
- Australia ANZ Roy Morgan Weekly Consumer Confidence (12/Mar): 113.1 (prev 113.9)
- Australia NAB Business Conditions (Feb): 9 (prev 16)
- Australia NAB Business Confidence (Feb): 7 (prev 10)
- China Industrial Production (YtD) (YoY) (Feb): 6.30% (est 6.20%, prev 6.00%)
- China Retail Sales (YtD) (YoY) (Feb): 9.50% (est 10.60%, prev 10.90%)
- Sterling slips as Brexit talks get green light, stocks advance before Fed – RTRS
- Wall Street drifts with eyes on Fed; Intel drops – RTRS
- Dollar nudges up on U.S. yields, euro retreats from 1-month high – RTRS
Markets Update:
The markets are relatively quiet as traders are waiting for the Federal Reserve rate decision tomorrow. Most of the Asian stock markets are almost unchanged on the day. In the FX market, the Dollar is slightly stronger, but all major pairs consolidated in tight ranges overnight.
The market has almost fully priced in a rate hike by the Fed tomorrow, and it is unlikely that the central bank will disappoint. However, the question is whether the Dollar can continue to appreciate much further. A rate hike alone is unlikely to support the currency much, as it is already expected. Much will depend on the FOMC statement and the comments by Fed Chair Yellen.
EUR/USD traded in 1.0645-60 range in Asia. The pair briefly broke above 1.07 yesterday, but quickly reversed those gains. A major breakout seems unlikely ahead of the FOMC. USD/JPY has been bid again, although resistance above 115 has proved to be heavy. Important support now lies at 114 and 113.60.
Upcoming Events:
- 07:00 GMT – German CPI
- 10:00 GMT – German ZEW Economic Sentiment
- 10:00 GMT – Euro Zone Industrial Production
- 10:00 GMT – Euro Zone ZEW Economic Sentiment
- 12:30 GMT – US PPI
- 21:45 GMT – New Zealand Current Account
FTSE Elliott Wave View: Extending Higher
Short term Elliottwave view in FTSE suggests that the instrument is showing a 5 swing sequence from 2/1 low (7087.67) favoring more upside. From 2/1 low, the Index is rallying as a double three Elliottwave structure where Minute wave ((w)) ended at 7329.56 and Minute wave ((x)) ended at 7192.45. Index has since broken above 7329.56, suggesting the next leg higher in Minute wave ((y)) has started. The subdivision of Minute wave ((y)) is also in a double three Elliottwave structure where Minutte wave (w) ended at 7394.6 and Minutte wave (x) ended at 7262.95. Up from there, rally is unfolding as a zigzag Elliottwave structure where Subminutte wave a ended at 7373 and Subminutte wave b ended at 7342.02. Near term, while pullbacks stay above 7262.95, and more importantly above 7192.45, expect Index to extend higher. We don’t like selling the Index.
FTSE 1 Hour Chart
EUR Ready To Reverse After Failed Bid To Break Resistance
Key Points:
- Reversal likely as the 100 day EMA is applying downward pressure.
- Stochastics trending towards overbought.
- Consolidation phase could end shortly.
The EUR looks poised to have another near-term slip in the wings as its latest attempt at pushing through the 100 day EMA seems to have been met with failure. However, there could be a silver lining for the bulls out there as the medium-term consolidation phase could be only a week or so away from ending, the result of which will likely be a rally to the long-term trend line.
First and foremost, we need to confirm just how likely a reversal and subsequent downtrend is for the EUR. From a technical perspective, such an outcome looks all but assured given a number of factors. For one, the 100 day EMA is once again making its presence felt and is supplying some notable dynamic resistance. Moreover, stochastics are trending towards overbought which will only add to resistance moving forward.
Aside from the EMA and stochastic biases, evidence for a reversal comes from the chart pattern that has developed over the past few months. Specifically, a fairly robust pennant seems to be forming up which should help to encourage the pair to drift lower in the coming sessions. This decline should come to an end around the 1.0550 handle before the downside constraint of the pennant kicks in and lends support to the Euro.
However, all is not lost for the bulls out there who may have been disheartened by the pair’s inability to move above that 100 day EMA. More precisely, at its current trajectory, the EUR’s consolidation phase is fast running out of wiggle room which should mean a breakout is on the horizon. As a result, there is likely only going to be one or maybe two reversals before the pair moves into a rather strong uptrend.
Ultimately, this uptrend will most probably be constrained by the long-term trend line which should limit gains to around the 1.0750 handle. However, by this point, we will have price action above the 100 day moving average which could help to see a long-term uptrend begin. If this occurs, the Euro will be well positioned to return to the price ranges seen early last year, much to the delight of the EUR bulls.
EUR/USD Daily Outlook
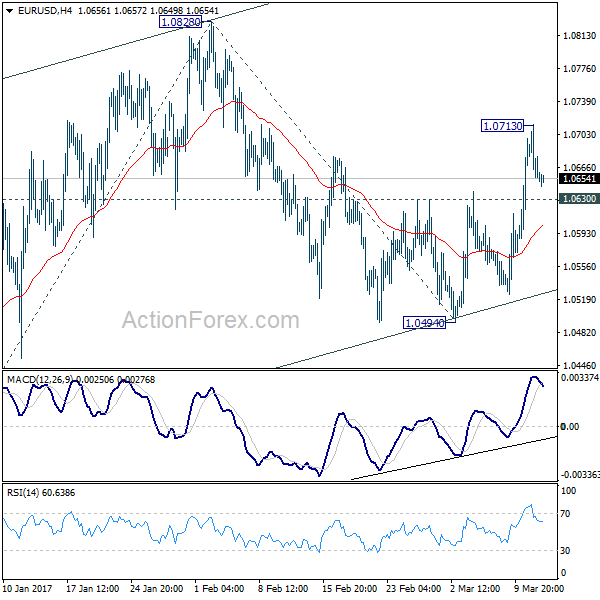
Daily Pivots: (S1) 1.0631; (P) 1.0672 (R1) 1.0694; More.....
A temporary top is formed at 1.0713 in EUR/USD with 4 hour MACD crossed below signal line. Intraday bias is turned neutral first. At this point, we're still favoring the bullish case. That is, whole rise from 1.0339 low is in progress and resuming. Above 1.0713 will target 1.0828 and above. However, since it's seen as a corrective move, we'd expect upside to be limited by 100% projection of 1.0339 to 1.0828 from 1.0494 at 1.0983. The larger down trend is expected to resume later. On the downside, break of prior resistance at 1.0630 will turn bias back to the downside for retesting 1.0494 low.
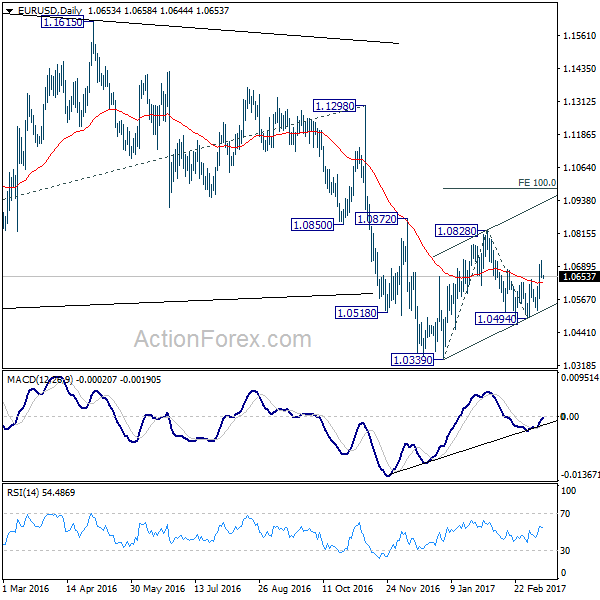
In the bigger picture, as long as 1.1298 key resistance holds, whole down trend from 1.6039 (2008 high) is still expected to continue. Break of 1.0339 low will send EUR/USD through parity to 61.8% projection of 1.3993 to 1.0461 from 1.1298 at 0.9115.
Upcoming Rate Hikes And 2018 Median Dot Plot In Focus
FOMC is highly likely to raise its policy rate, by +25 bps, to a range to 0.75-1% in March. With a March rate hike a done-deal, the market focus turns to the future monetary policy stance. We expect two more hikes, one in June and one in September, this year. Given the recent improvements in employment and inflation, the market has begun talking about four rate hikes in 2018. For now, we stick to three, as suggested in December's dot plot. The market is currently pricing in three 25-bps hikes this year and two for 2018. The Fed's updated Summary of Economic Projections (SEP) would be released with fan charts added for the first time.
Fed's monetary policy decision is data-dependent. Recent economic developments have indicated that the Fed is on right path to achieve its dual mandate. US non-farm payrolls came in stronger than expected, adding +235K in February, compared with consensus of +193K and the upwardly revised +238K in January. The average monthly gain over the past 6 months stands at +194K and the average over the past year is +197K. The unemployment rate slipped -0.1 percentage point to 4.7% as the participation rate added+0.1 percentage point to 63%. Average earnings rose +0.2%, compared with forecast of +0.3%. January's inflation surprised to the upside. Headline CPI accelerated to +0.6% m/m from +0.3% in December. This also marked that largest monthly gain since 2013. Undoubtedly, the +4% jump in energy CPI (+1.2% in December) was the key drive. Yet, the core CPI also strengthened, rising an above-trend 0.3% m/m. On a year-ago basis, headline CPI accelerated to 2.5% from +2.1% in December, while the core reading improved to +2.3% from +2.1% previously.
There have been rising hopes of four rate hikes in 2018, compared with three suggested in the December dot plot. Recall that in December 2016, FOMC's median estimate in dot plot showed a Fed funds rate of 1.375% in 2017, 2.125% in 2018 and 2.875% in 2019. Indeed, it is not impossible for the median dot plot to signal four hikes next year. Only two participants, who were at the median last time, are needed to raise their forecasts by +25 bps to lift the median to 2.375%. For 2019, only one participant is needed to lift the median to 3%. Note, however, that the market is currently pricing in only two rate hikes for 2018.
We believe policymakers would have more discussions on balance sheet adjustment over the course of this year, culminating to announcement of plans to reduce the balance sheet in 4Q17. Yet, the policy statement in March would likely maintain the reference that 'the Committee is maintaining its existing policy of reinvesting principal payments from its holdings of agency debt and agency mortgage-backed securities in agency mortgage-backed securities and of rolling over maturing Treasury securities at auction, and it anticipates doing so until normalization of the level of the federal funds rate is well under way. This policy, by keeping the Committee's holdings of longer-term securities at sizable levels, should help maintain accommodative financial conditions'.
FOMC would add new fan charts to the SEP. While these are intended to display uncertainty around economic projections, we doubt they would provide more new information about the economic and monetary policy outlooks
USD/CHF Daily Outlook
Daily Pivots: (S1) 1.0049; (P) 1.0083; (R1) 1.0105; More.....
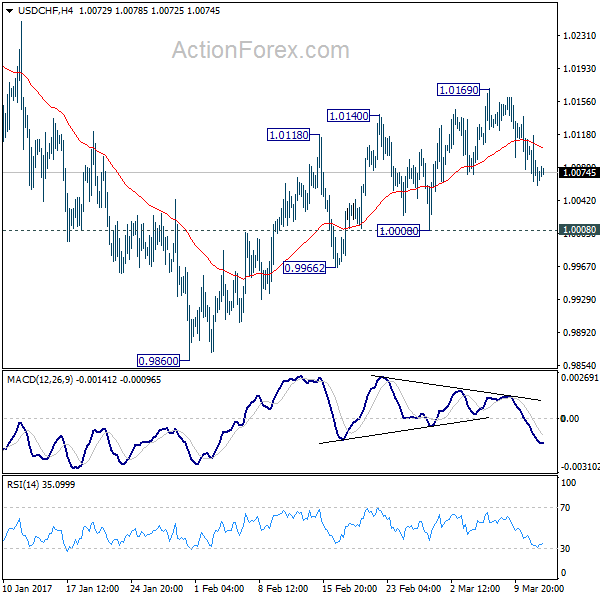
Intraday bias in USD/CHF remains neutral as the retreat from 1.0169 continues. Deeper decline cannot be ruled out. But another rise is mildly in favor. Above 1.0169 will turn bias to the upside and target a test on 1.0342 resistance. Based on neutral medium term outlook, we'd be cautious on topping below 1.0342. On the downside, break of 1.0008, however, will indicate completion of the rebound from 0.9860. And intraday bias will be turned back to the downside for 0.9860.
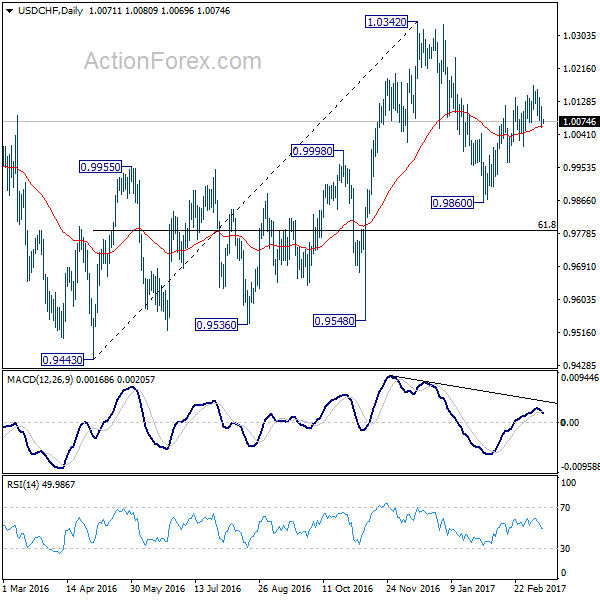
In the bigger picture, prior rejection from 1.0327 resistance argues that USD/CHF is staying in a medium term sideway pattern. In any case, decisive break of 1.0342 resistance is needed to confirm underlying strength. Otherwise, we'll stay neutral in the pair first. In case of another fall, we'd expect strong support from 0.9443/9548 support zone.
Daily Technical Outlook And Review
A note on lower timeframe confirming price action...
Waiting for lower timeframe confirmation is our main tool to confirm strength within higher timeframe zones, and has really been the key to our trading success. It takes a little time to understand the subtle nuances, however, as each trade is never the same, but once you master the rhythm so to speak, you will be saved from countless unnecessary losing trades. The following is a list of what we look for:
- A break/retest of supply or demand dependent on which way you're trading.
- A trendline break/retest.
- Buying/selling tails ... essentially we look for a cluster of very obvious spikes off of lower timeframe support and resistance levels within the higher timeframe zone.
- Candlestick patterns. We tend to only stick with pin bars and engulfing bars as these have proven to be the most effective.
EUR/USD
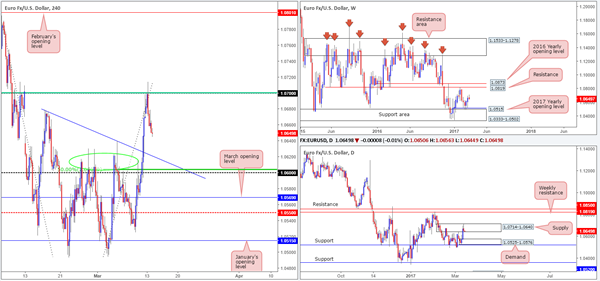
The single currency, as you can see, closed marginally lower on Monday after piercing through the nearby psychological level at 1.07/ H4 61.8% Fib retracement taken from the high 1.0828. Seeing as how the daily candles are responding reasonably well from daily supply at 1.0714-1.0640, and weekly action shows price to be meandering mid-range between weekly resistance at 1.0819 and the weekly support area at 1.0333-1.0502/ 2017 yearly opening level at 1.0515, further selling could be on the cards. With that being the case, the next downside target on the H4 scale can be seen around the H4 trendline support etched from the high 1.0679, followed closely by a 50.0% retracement level at 1.0603 and psychological level 1.06.
Our suggestions: The pair is likely to find some support around 1.06/1.0620 region with it having been a strong barrier of resistance on a number of occasions over the past few weeks (see green circle). Despite this, let’s be mindful to the fact that we have little higher-timeframe structure supporting this zone. The closest area of interest is seen on the daily chart at 1.0525-1.0576: a daily demand base. As a result of this, we would strongly recommend waiting for at least a reasonably strong bullish candle to form before considering a position from the above noted H4 support area.
Data points to consider: German ZEW economic sentiment at 10am. US PPI at 12.30pm GMT.
Levels to watch/live orders:
- Buys: 1.06/1.0620 neighborhood ([waiting for a reasonably sized H4 bull candle to form is advised] stop loss: ideally beyond the trigger candle).
- Sells: Flat (stop loss: N/A).
GBP/USD
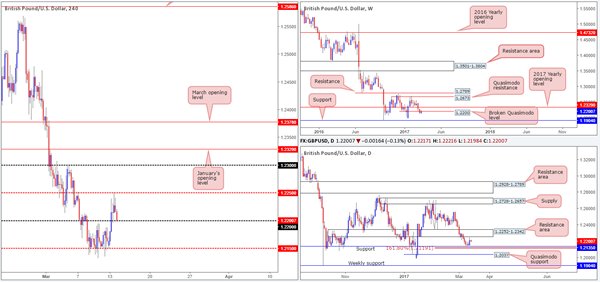
Looking at this market from the top this morning, weekly price is currently seen testing the underside of the recently broken weekly Quasimodo line coming in at 1.22. On the condition that the pair remains bearish beyond this hurdle, then the next port of call on this scale can be seen around weekly support coming in at 1.1904. Down on the daily timeframe, we can see that the bulls went on the offensive yesterday and pulled the unit up to within an inch of the daily resistance area drawn from 1.2252-1.2342, before printing a mild end-of-day correction. The next area of interest seen below here is a daily support drawn from 1.2135, followed closely by the daily 161.8% Fib ext. at 1.2119 taken from the high 1.2706.
Swinging across to the H4 candles, price clipped the H4 mid-way resistance at 1.2250 going into the early hours of yesterday’s US segment and closed the day just ahead of the 1.22 psychological support. As we are already aware, 1.22 also denotes the weekly broken Quasimodo level mentioned above. So, with that in mind, a H4 close beyond 1.22 today could spark a selloff back down to the H4 mid-way support at 1.2150/daily support at 1.2135. The question is how can we take advantage of this?
Our suggestions: Other than selling on the break of 1.22, the only other alternative we see here is to wait for H4 price to retest the underside of 1.22 as resistance (following the close lower) and a lower-timeframe sell signal (see the top of this report). The latter, in our opinion, is the safer route to take.
Data points to consider: US PPI at 12.30pm GMT.
Levels to watch/live orders:
- Buys: Flat (stop loss: N/A).
- Sells: Watch for price to engulf 1.22 and then look to trade any retest seen thereafter ([wait for a lower-timeframe signal to form following the retest before looking to pull the trigger] stop loss: dependent on where one confirms this barrier).
AUD/USD
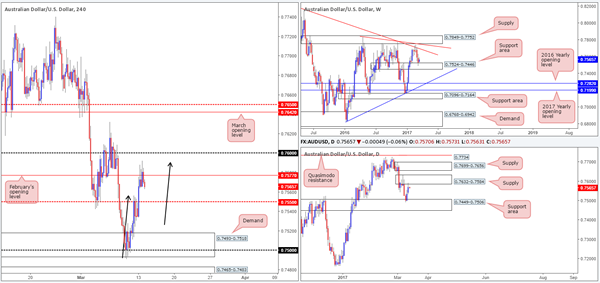
Having seen weekly price recently shake hands with the weekly support area at 0.7524-0.7446, as well as a daily action also touch base with a daily support area drawn from 0.7449-0.7506, there was no surprise to see the Aussie push higher on Monday. Still, the rally could very well be a short-lived one! While daily action did indeed extend Friday’s bounce from the aforementioned daily support base yesterday, we also saw a daily supply zone at 0.7632-0.7584 brought into play. Couple this with the H4 candles also recently topping out around the completion point of a minor H4 AB=CD pattern (see black arrows) at 0.7589/February’s opening level at 0.7577, the unit may look to erase some/all of yesterday’s gains.
Our suggestions: Despite the weekly chart suggesting further buying could be on the horizon, both the H4 and daily charts disagree (see above). Even so, shorting this market is proving to be difficult owing to the nearby H4 mid-way support at 0.7550! Unfortunately, we see little else to hang our hat on this morning, so we will be placing this market on the back burner for the time being and will look to reassess following today’s Chinese industrial production figures.
Data points to consider: Chinese industrial production at 2am. US PPI at 12.30pm GMT.
Levels to watch/live orders:
- Buys: Flat (stop loss: N/A).
- Sells: Flat (stop loss: N/A).
USD/JPY
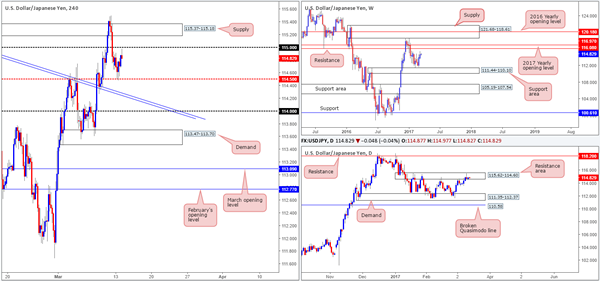
In recent sessions, the USD/JPY succeeded in netting a batch of fresh bids off the H4 mid-way support hurdle at 114.50 which led to price tapping a high of 114.91 into the close. In consequence to yesterday’s rather lackluster performance, there was little change seen to the higher-timeframe structure. Weekly price remains on course to cross swords with a weekly resistance level seen at 116.08, and daily price is seen trading within the walls of a daily resistance area coming in at 115.62-114.60.
With the above in mind, a break through the 115 handle, although this would be considered a bullish signal according to the weekly timeframe, shows little wiggle room for price to move since H4 supply at 115.37-115.18 sits directly above. On the other hand, a break below 114.50 would be considered a bearish signal since daily flow remains within a daily resistance area. Nevertheless, let’s take into account that not only is there a nearby H4 trendline support (extended from the high 115.62) seen just below 114.50, but there’s also the fact that you’d be selling against potential weekly momentum!
Our suggestions: Based on the above notes, our team has come to a general consensus that a trade in this market is just too risky on the timeframes we follow.
Data points to consider: US PPI at 12.30pm GMT.
Levels to watch/live orders:
- Buys: Flat (stop loss: N/A).
- Sells: Flat (stop loss: N/A).
USD/CAD
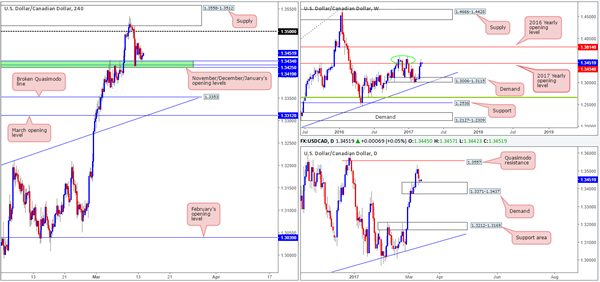
For the most part, it was a relatively quiet session in the USD/CAD market yesterday. There were no high-impacting events affecting either the US dollar or Canadian dollar, which saw the pair drift lower to retest the 1.3419/1.3434 region (November/December/January's opening levels). This area, as you can see, is holding ground for now and this could very well be because of the daily demand base currently seen in play at 1.3371-1.3437. Looking up to the weekly candles, the unit managed to marginally close beyond the 2017 yearly opening level at 1.3434. Since the close above this line was relatively minor, and taking into account that there is a nearby weekly double-top formation seen around the 1.3588 region (green circle), we do not consider 1.3434 to be out of the picture as a weekly resistance just yet!
Our suggestions: In a nutshell, the structure of this pair can be boiled down to the following:
Weekly action suggests that the bears could come into play.
Daily price is trading from demand so this evidently favors the bulls.
And H4 flow is currently seen bouncing off 1.3419/1.3434, which also favors the bulls.
Ultimately, we will not be happy selling this market until the current daily demand is out of the picture. Despite this, a break below 1.3419/1.3434 may entice sellers down to the H4 broken Quasimodo support at 1.3353 since, other than the 1.34 barrier, we see very little active H4 demand to the left of price. In regards to buying this unit, we still feel it would just be too much of a risk considering the weekly structure noted above. However, In the event that you believe the 1.3419/1.3434 will hold today despite our notes, we would advise waiting for a solid (preferably full-bodied) bull candle to form before pulling the trigger. This will, of course, by no means guarantee a winning trade, but what it will do is show buyer intent!
Data points to consider: US PPI at 12.30pm GMT.
Levels to watch/live orders:
- Buys: Flat (stop loss: N/A).
- Sells: Flat (stop loss: N/A).
USD/CHF
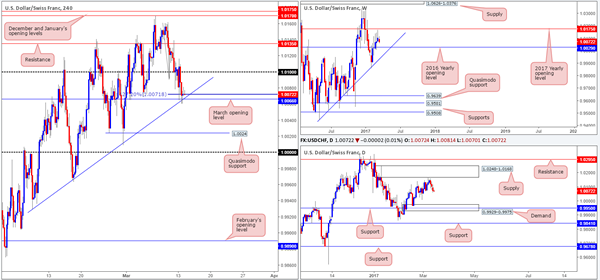
As anticipated, the H4 candles eventually engulfed the 1.01 handle during the course of yesterday’s sessions and tested March’s opening level at 1.0066. As highlighted in yesterday’s report, this level is also bolstered by a H4 trendline support taken from the low 0.9929 and a H4 127.2% Fib ext. at 1.0071. While this confluence is attractive and may continue to hold this unit higher today, we remain wary of buying from here due to the following:
On the H4 chart, there is little room for price to rally from here given the nearby 1.01 handle.
Over on the daily chart, the pair recently clipped the underside of a daily supply coming in at 1.0248-1.0168. In addition to this, we do not see much active demand to the left of current price until the pair reaches the daily demand pegged at 0.9929-0.9975, which happens to intersect with a daily support level seen at 0.9950.
Weekly price also recently came within striking distance of the 2017 yearly opening level at 1.0175, which looks to be enough to force weekly action lower this week.
Our suggestions: As things stand, our desk believes that 1.0066 will ultimately give way and price will look to test the H4 Quasimodo support at 1.0024, followed closely by parity (1.0000). To that end, we will be looking to short price beyond 1.0066 today if we happen to see a retest of this number as resistance that’s bolstered by a lower-timeframe sell signal (see the top of this report).
Data points to consider: US PPI at 12.30pm GMT.
Levels to watch/live orders:
- Buys: Flat (stop loss: N/A).
- Sells: Watch for price to engulf 1.0066 and then look to trade any retest seen thereafter (waiting for a lower-timeframe confirming signal to form [see the top of this report] following the retest is advised] stop loss: dependent on where one confirms the level).
DOW 30
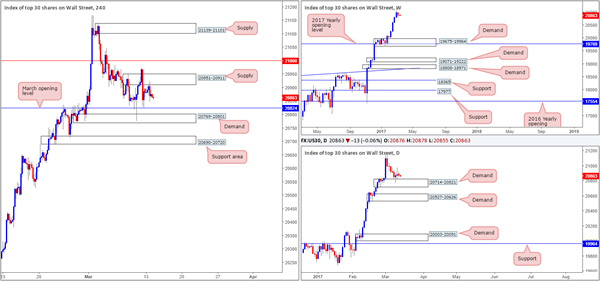
It was a quiet session for the US equity market yesterday, with price ranging a mere 74 points on the day. Looking at the H4 timeframe, it’s quite clear that price is somewhat restricted at the moment between a H4 supply at 20951-20911 and March’s opening level at 20824.
Turning our attention to the weekly timeframe, the index printed its first losing week since early Feb last week. The bearish close is not something we would label significant, however, seeing as how price remained within the prior week’s range and sported a minor end-of-week bullish correction. With equities still seen trading nearby record highs, where do we go from here? Well, given that there is absolutely no weekly resistance levels in sight, the best we can do for the time being is continue looking to ‘buy the dips’. The closest higher-timeframe area can be seen at 20714-20821: a daily demand zone, which is currently in play as we write.
Our suggestions: In essence, our team is still in favor of a rally higher. Be that as it may, the H4 supply at 20951-20911 and nearby 21000 line would need to be taken out beforehand. Therefore, until we see a H4 close print above these areas, we will not be considering positions in this market.
Data points to consider: US PPI at 12.30pm GMT.
Levels to watch/live orders:
- Buys: Watch for price to engulf 21000 and then look to trade any retest seen thereafter (waiting for a lower-timeframe confirming signal to form [see the top of this report] following the retest is advised] stop loss: dependent on where one confirms the level).
- Sells: Flat (stop loss: N/A).
GOLD
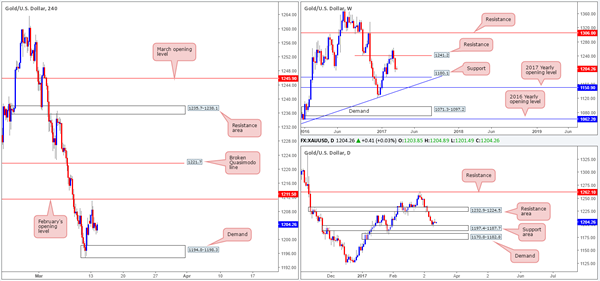
Following the open, we saw the yellow metal start the week out on a reasonably strong footing which saw the unit touch a high of 1211.0, just missing February’s opening base by a few pips at 1211.5. It was here (the London open), however, that things begun to turn sour. H4 price ended the day engulfing the weekly opening level, clocking a low of 1201.4 going into the closing bell. This, as you’ll see over on the daily chart, formed a nice-looking daily bearish selling wick.
As far as higher-timeframe structure goes, the weekly timeframe indicates that price could potentially continue driving lower until we reach the weekly support level drawn from 1180.1. Despite this, the weekly sellers will need to run through the daily support area drawn in at 1197.4-1187.7 before we see 1180.1.
Our suggestions: Given the conflicting signals seen from the weekly and daily timeframes, this remains a difficult market to read. For all intents and purposes, neither a long nor short seems attractive at this time.
The daily demand seen below the current daily support area at 1170.8-1182.8, nonetheless, has caught our eye. Encased within is the above noted weekly support level and a H4 Quasimodo support hurdle seen below the current H4 demand at 1184.3. This daily area, given its surrounding confluence, has a high probability of bouncing price higher. Unfortunately, there is a fair amount of ground to cover before this base comes into view, so place this beauty on the back burner for a later date!
Levels to watch/live orders:
- Buys: Flat (stop loss: N/A).
- Sells: Flat (stop loss: N/A).