
Sample Category Title
Foreign Exchange Market Commentary
EUR/USD
The week started in a dull fashion, with investors lacking motivation to push currencies one way of the other, amid the absence of macroeconomic and political news. The EUR/USD pair eased modestly after attempting a bullish breakout early London, having, however, set a fresh 3-week high of 1.0639, but settled a handful of pips below the 1.0600 threshold. There were some minor macroeconomic releases, including the EU Sentix Investor Confidence Index for March, which reached a 10-year high of 20.7, and US Factory Orders for January, up 1.2% as expected, the second consecutive monthly increase. Nevertheless, investors held in wait-and-see mode ahead of the main events of the week, the ECB monetary policy meeting on Thursday, and the US Nonfarm Payroll report on Friday.
The European Central Bank is expected to remain on hold, as despite inflation has been advancing during the last two months, it has been driven by volatile components such as energy and food, with the underlying inflation still at 0.9%. Still, the Central Bank will reduce its monthly amount of purchases to €60b starting next April, which may arise speculation of tapering, although the most likely scenario is another form of easing planned to 2018.
In the meantime, the pair trades uneventfully above the 1.0565 Fibonacci support. The 4 hours chart shows that technical indicators have lost their upward strength and turned south within positive territory, but are still above previous daily lows, whilst the price is moving back and forth around a bearish 100 SMA, and above a slightly bullish 20 SMA, indicating limited directional strength. The key support is the 1.0520 region, as renewed selling interest below the level could see the pair extending its slide towards 1.0340, this year low, while the upside remains well-limited as long as the price remains below the 1.0700/20 price zone.
Support levels: 1.0565 1.0520 1.0470
Resistance levels: 1.0635 1.0660 1.0710
USD/JPY
The USD/JPY pair ends the day unchanged from Friday's close, although recovering from a daily low of 113.55 achieved at the beginning of the day. As usual, yields differentials are dominating price action, but given that US treasury notes' yields are pretty much unchanged intraday, the pair is mute. The 10-year benchmark advanced to 2.50% from previous 2.49%, while the 2-year note remained flat. There's little ahead in Japan this Tuesday, with attention centered in early Wednesday GDP and Trade balance figures. The pair fell briefly below its 100 DMA, but settled above it, although selling interest around 114.50 keeps limiting advances. Shorter term, the 4 hours chart shows that the 100 and 200 SMA converge around 113.25 with no directional strength, reflecting the absence of a clear trend, whilst technical indicators have lost their bearish tone after entering bearish territory, with the RSI indicator already above its mid-line, heading north around 55. Still, the pair needs to advance beyond 114.95, February 15th high, to shrug off at least partially, the bearish tone.
Support levels: 113.50 113.25 112.90
Resistance levels: 114.55 114.95 115.30
GBP/USD
After failing to surpass the 1.2300 level, the GBP/USD pair fell towards its recent multi-week low, ending the day not far from last week low of 1.2213. The macroeconomic calendar was scarce in the UK, and will remain so until next Friday, which means attention will center in Brexit woes. This Monday, a spokesman from the government said that Theresa May will not allow the Parliament to vote over her Brexit deal, if such votes means bad trade terms for the UK. On Tuesday, the House of Lords will vote parliamentary veto rights. The pair is biased lower according to technical readings in the 4 hours chart, as the price was unable to advance beyond 1.2300 before finally breaking below a critical Fibonacci support, now resistance at 1.2260. In the same chart, attempts to advance have been contained by a bearish 20 SMA, whilst technical indicators have turned south after failing to overcome their mid-lines, all of which suggests that the pair may extend its decline, particularly on a break below the mentioned six-week low.
Support levels: 1.2215 1.2170 1.2230
Resistance levels: 1.2260 1.2300 1.2345
GOLD
Gold prices edged lower on Monday, with spot settling around $1,227.20 a troy ounce, as the greenback regained some of its charm after Friday's setback. Expectations of a March hate hike weighed on the safe-haven metal, despite the sour tone of worldwide equities that started early Asia when North Korea launched some missiles in the Japanese sea, triggering risk aversion. The commodity neared March's low of 1,222.80, the immediate support, and the daily chart shows that the price remained contained by a horizontal 20 DMA currently at 1,239.25, whilst technical indicators entered bearish territory with nice bearish slopes. Also, the commodity is finishing the day below the 50% retracement of the post-US election decline at 1,230.00, although a break below the mentioned monthly low is required to confirm a steeper decline. Shorter term, the 4 hours chart shows that attempts to recover were rejected by a bearish 20 SMA that already crossed below the 100 SMA, whilst technical indicators head south within negative territory, in line with the longer term perspective.
Support levels1,222.80 1,210.90 1,201.15
Resistance levels: 1,230.00 1,239.25 1,245.50
WTI CRUDE
Crude oil prices saw little action at the beginning of the week, with West Texas Intermediate futures ending the day pretty much unchanged at $53.14 a troy ounce. Oil prices slipped in Asian trading on doubts about Russia's compliance with the output cut deal, although it later recovered after Iraq said that the OPEC will likely need to extend its output cut into the second half of 2017, and that the country is ready to do so if needed. From a technical point of view, the black gold presents a neutral-to-bearish stance as in the daily chart, as the price remains below its 20 DMA, while technical indicators have turned modestly lower around their mid-lines. In the same chart, however, the 100 DMA heads modestly higher around 51.60, providing a strong dynamic support in the case of further declines. In the 4 hours chart, the 20 SMA has extended its decline below the 100 and 200 SMAs, maintaining its bearish slope, whilst technical indicators have recovered from near oversold readings, losing upward strength around their mid-lines, indicating a limited upward potential.
Support levels: 52.50 51.90 51.40
Resistance levels: 53.70 54.20 54.80
DJIA
Wall Street closed in the red, with the Dow Jones Industrial Average down 51 points or 0.24%, to 20,954.34. The Nasdaq Composite lost 21 points and settled at 5,849.18, while the S&P shed 0.33%, to 2,375.31. Within the Dow, most components closed lower, with Travelers Cos leading the decline, down 1.22%, followed by JPMorgan Chase that shed 0.92%, as banks were weighed by their European counterparts. Caterpillar led gainers, adding 0.76%, followed by Exxon Mobil that gained 0.47%. US equities were undermined by Fed's hawkish rhetoric, as investors eye now a downward corrective move following the run to records seen last week. The daily chart for the Dow shows that the positive tone persists, despite the latest slide, as the index remains far above bullish moving averages, whilst the RSI indicator corrected within extreme overbought levels, bouncing now from 70 and the Momentum indicator also resuming its advance within positive territory. In the 4 hours chart, however, the benchmark develops below a modestly bearish 20 SMA, currently at 21,004, whilst the Momentum indicator aims higher within bearish territory and the RSI indicator stands pat in neutral territory.
Support levels: 20,905 20,849 20,800
Resistance levels: 21,017 21,064 21,114
FTSE 100
The FTSE 100 closed the day 0.33% lower at 7,350.12, weighed by a decline in commodities that dragged lower the mining sector, and despite a merge news that sent Standard Life to the top of the list, as the share added 5.68% after the Scotland’s largest insurer agreed to acquire Aberdeen Asset Management Plc, creating one of Europe’s biggest fund managers. Copper led miners lower, with Glencore topping losers' list, down by 3.47%, followed by Anglo American that shed 2.71%. The banking sector also suffered on Deutsche Bank news, with Royal Bank of Scotland ending the day 2.59% lower. From a technical point of view, the decline has been little relevant, as the index remains well above its moving averages and near record highs, whilst technical indicators have turned modestly lower, but held within positive territory. In the 4 hours chart, the index bounced from a bullish 20 SMA, but the Momentum indicator is entering negative territory, whilst the RSI hovers around 57 with no clear directional strength, indicating a limited upward potential at the time being.
Support levels: 7,352 7,320 7,287
Resistance levels: 7,397 7,420 7,450
DAX
European equities closed in the red, with the German DAX down 68 points or 0.57%, to 11,958.40. Deutsche Bank led the way lower across the region, on news that the biggest European lender is facing legal action over foreign currency trading practices, from an US firm. The bank was the worst performer, shedding 3.46%, and leading the sector lower all across the region. ThyssenKrupp followed, down by 1.69%. Only eight components closed higher, with Muenchener being the best performer, up 0.61%. The daily chart for the index shows that, despite the intraday slide, it's still holding above a bullish 20 DMA at 11,838, while technical indicators retreat within positive territory with limited bearish strength. In the 4 hours chart, the index present an increased bearish potential, as it stands below a still bullish 20 SMA, whilst the Momentum indicator entered bearish territory and the RSI holds around neutral territory, indicating that further declines are likely on a break below 11,920, the daily low.
Support levels: 11,920 11,867 11,816
Resistance levels: 12,001 12,053 12,100
Trade Idea : EUR/USD – Buy at 1.0545
EUR/USD - 1.0583
Most recent candlesticks pattern : N/A
Trend : Sideways
Tenkan-Sen level : 1.0583
Kijun-Sen level : 1.0607
Ichimoku cloud top : 1.0590
Ichimoku cloud bottom : 1.0561
New strategy :
Buy at 1.0545, Target: 1.0645, Stop: 1.0510
Position : -
Target : -
Stop : -
Although the single currency retreated after rising to 1.0640 yesterday and consolidation with initial downside bias is seen for weakness to 1.0560, reckon downside would be limited to 1.0540-45 and bring another rebound later, above said resistance at 1.0640 would extend the erratic rise from 1.0493 lo for retracement of early decline to 1.0660-65 (50% Fibonacci retracement of 1.0829-1.0493) and possibly towards resistance at 1.0680, however, price should falter well below 1.0700-05 (61.8% Fibonacci retracement).
In view of this, we are looking to buy euro on dips. Below 1.0510 would abort and risk retest of 1.0493 but only break there would shift risk back to the downside and signal recent decline from 1.0829 has resumed for further selloff to 1.0470 and then towards previous support at 1.0454.

RBA Maintains Neutral Bias In March. Fed Funds Rate Hike Alleviates Pressure On Aussie Appreciation
As expected, RBA left the cash rate unchanged at 1.5% in March. Despite few changes in the monetary statement, policymakers appeared more upbeat on both the global and domestic economic outlook. The major change on RBA's view was on the housing market with the central bank now seeing the conditions 'strong' and prices 'rising briskly' in some markets. On the monetary front, RBA acknowledged further rate hike is coming in the US and 'there is no longer an expectation of additional monetary easing in other major economies'. With no explicit guidance on RBA's monetary policy outlook, we see it maintain a neutral bias with future rate decision dependent on incoming data.
RBA indicated that global market conditions have 'continued to improve over recent months' and 'business and consumer confidence have both picked up'. It also remained cautiously optimistic over China's outlook noting that the country's 'growth is being supported by higher spending on infrastructure and property construction. This composition of growth and the rapid increase in borrowing mean that the medium-term risks to Chinese growth remain'. The central bank noted that higher commodity prices have been 'providing a significant boost to Australia's national income'.
Domestically, policymakers acknowledged that 'most measures of business and consumer confidence are at, or above, average', whilst 'consumption growth was stronger towards the end of the year, although growth in household income remains low'. The statement, however, added that 'with growth in labor costs remaining subdued, underlying inflation is likely to stay low for some time'. On the housing market, RBA noted that the conditions 'vary considerably around the country'. In some markets, conditions are strong and prices are rising briskly. In other markets, prices are declining. In the eastern capital cities, a considerable additional supply of apartments is scheduled to come on stream over the next couple of years. Growth in rents is the slowest for two decades. Borrowing for housing by investors has picked up over recent months. Supervisory measures have contributed to some strengthening of lending standards.
On the monetary policy front, RBA mentioned that the Fed funds rate is 'expected to increase further' and it is less likely for other major central banks to add more monetary policy easing. We believe further normalization on the US monetary policy should help alleviate concerns over the strength in Australian dollar. For Australia, the central bank judged that the current monetary policy remains appropriate and is 'consistent with sustainable growth in the economy and achieving the inflation target over time'.
Trade Idea : USD/JPY – Sell at 114.50
USD/JPY - 113.96
Most recent candlesticks pattern : N/A
Trend : Near term up
Tenkan-Sen level : 113.97
Kijun-Sen level : 113.83
Ichimoku cloud top : 114.25
Ichimoku cloud bottom : 114.08
Original strategy :
Sell at 114.35, Target: 113.35, Stop: 114.70
Position : -
Target : -
Stop : -
New strategy :
Sell at 114.50, Target: 113.35, Stop: 114.80
Position : -
Target : -
Stop : -
As the greenback recovered after finding support at 113.56 yesterday, suggesting consolidation with initial upside bias would be seen and corrective bounce to 114.30-35 cannot be ruled out, however, if our view that a temporary top formed at 114.75 last week is correct, upside should be limited to 114.50-55 and bring another decline later, below said support at 113.56 would bring retracement of recent rise to 113.20-25 (50% Fibonacci retracement of 111.69-114.75), however, downside would be limited to 113.00 and 112.84-86 (previous resistance and 61.8% Fibonacci retracement), bring rebound later.
In view of this, we are looking to sell dollar on recovery for such move as 114.50 should limit upside, bring another decline. Only above said resistance at 114.75 would abort and signal the rise from 111.69 has resumed and extend gain to 114.96 (previous resistance) but price should falter well below resistance at 115.38.

(RBA) Statement by Philip Lowe, Governor: Monetary Policy Decision
At its meeting today, the Board decided to leave the cash rate unchanged at 1.50 per cent.
Conditions in the global economy have continued to improve over recent months. Business and consumer confidence have both picked up. Above-trend growth is expected in a number of advanced economies, although uncertainties remain. In China, growth is being supported by higher spending on infrastructure and property construction. This composition of growth and the rapid increase in borrowing mean that the medium-term risks to Chinese growth remain. The improvement in the global economy has contributed to higher commodity prices, which are providing a significant boost to Australia's national income.
Headline inflation rates have moved higher in most countries, partly reflecting the higher commodity prices. Long-term bond yields are higher than last year, although in a historical context they remain low. Interest rates are expected to increase further in the United States and there is no longer an expectation of additional monetary easing in other major economies. Financial markets have been functioning effectively and stock markets have mostly risen.
The Australian economy is continuing its transition following the end of the mining investment boom, expanding by around 2½ per cent in 2016. Exports have risen strongly and non-mining business investment has risen over the past year. Most measures of business and consumer confidence are at, or above, average. Consumption growth was stronger towards the end of the year, although growth in household income remains low.
The outlook continues to be supported by the low level of interest rates. Financial institutions remain in a good position to lend. The depreciation of the exchange rate since 2013 has also assisted the economy in its transition following the mining investment boom. An appreciating exchange rate would complicate this adjustment.
Labour market indicators continue to be mixed and there is considerable variation in employment outcomes across the country. The unemployment rate has been steady at around 5¾ per cent over the past year, with employment growth concentrated in part-time jobs. The forward-looking indicators point to continued expansion in employment over the period ahead.
Inflation remains quite low. With growth in labour costs remaining subdued, underlying inflation is likely to stay low for some time. Headline inflation is expected to pick up over the course of 2017 to be above 2 per cent, with the rise in underlying inflation expected to be a bit more gradual.
Conditions in the housing market vary considerably around the country. In some markets, conditions are strong and prices are rising briskly. In other markets, prices are declining. In the eastern capital cities, a considerable additional supply of apartments is scheduled to come on stream over the next couple of years. Growth in rents is the slowest for two decades. Borrowing for housing by investors has picked up over recent months. Supervisory measures have contributed to some strengthening of lending standards.
Taking account of the available information the Board judged that holding the stance of policy unchanged at this meeting would be consistent with sustainable growth in the economy and achieving the inflation target over time.
Is It Time For Gold To Resume Its Rally?
Key Points:
- Reaching a turning point in the Elliot wave.
- EMA bias remains highly bullish.
- Rate hike fears could hinder further gains.
Sentiment should be returning to the gold markets this week as the metal looks as though it’s ready to begin tracking higher once more. Specifically, we seem to have reached another turning point in the long-term pattern that could signal that we are about to see another push towards the elusive 1300.00 handle.
First and foremost, we should probably define exactly which long-term pattern is likely shaping up for the metal. Looking at the price action during the recent upswing, there is a fairly convincing Elliot wave becoming apparent, even if we would ideally like to see that third leg be slightly longer prior to retracing. Regardless, as a result of the wave, we are now expecting to see the final leg take place which could mean some rather substantial gains are due to be realised.
Indeed, this imminent reversal seems to have quite a bit of support from a technical perspective as a number of measures are suggestive of a move to the upside. Firstly, we have the 100 day EMA acting as a source of dynamic support which is already doing an excellent job of halting further slides lower. In addition to this, the 12 and 20 day averages are in a bullish configuration despite the near-term downtrend.
Setting aside the moving averages, the movement of the Stochastics reading into oversold territory will be providing some solid buying pressure. Combined with the other factors mentioned above, this should see the bears begin to retreat which could give the bulls the opening needed to wrest control of gold back from their counterparts.
From a fundamental perspective, we have a handful of risk events on offer but the US employment data will likely be taking centre stage. More precisely, we have both the ADP and Official NFP numbers as well as the Unemployment Rate due out this week and these could generate some significant movement. As one would expect, any notable weakness in the results could set a fire under the metal once again and this would help the technical forecast to be realised in full.
Ultimately, we can’t escape the threat of a US rate hike that currently looms of much of the market. As a result, we could find any gains to be fairly hard won and prone to being eroded as the FOMC meeting draws nearer. Alternatively, this could provide a good litmus test for just how resilient the metal’s rally is. If gold continues to rise, we could infer that fears over the current US administration trump the influence of the Fed’s monetary policy.
Daily Technical Analysis
EURUSD
The EURUSD attempted to push higher yesterday topped at 1.0640 but closed lower at 1.0581. As you can see on my H4 chart below price is moving back inside the bearish channel, keeps the bearish phase intact. The bias is neutral in nearest term probably with a little bearish bias testing 1.0500 support area. On the upside, 1.0630/50 region remains a key resistance and good place to sell with a tight stop loss as a clear break and daily close above that area could trigger further bullish pressure testing 1.0700 – 1.0750 region. Overall I remain neutral.
GBPUSD
The GBPUSD had a moderate bearish momentum yesterday bottomed at 1.2224. The bias is bearish in nearest term testing 1.2150 region. Immediate resistance is seen around 1.2275. A clear break above that area could lead price to neutral zone in nearest term testing 1.2340 resistance area which remains a good place to sell with a tight stop loss. Overall I remain neutral.
USDJPY
The USDJPY was indecisive yesterday. The bias remains neutral in nearest term. Overall I still prefer a bearish scenario but as you can see on my H4 chart below price has been moving sideways in a range area. Immediate support is seen around 113.50. A clear break and daily close below that area could trigger further bearish pressure testing 113.00 – 112.50 region. Immediate resistance is seen around 114.70 but key resistance remains at 115.60 which remains a good place to sell.
USDCHF
The USDCHF had a moderate bullish momentum yesterday topped at 1.0129. The bias is bullish in nearest term testing 1.0200 area which is a good place to sell with a tight stop loss. Immediate support is seen around 1.0070 and the lower line of the bullish channel as you can see on my H4 chart below. A clear break and daily close below the bullish channel would end the current bullish phase. Overall I remain neutral.
Daily Technical Outlook And Review
A note on lower timeframe confirming price action...
Waiting for lower timeframe confirmation is our main tool to confirm strength within higher timeframe zones, and has really been the key to our trading success. It takes a little time to understand the subtle nuances, however, as each trade is never the same, but once you master the rhythm so to speak, you will be saved from countless unnecessary losing trades. The following is a list of what we look for:
- A break/retest of supply or demand dependent on which way you're trading.
- A trendline break/retest.
- Buying/selling tails ... essentially we look for a cluster of very obvious spikes off of lower timeframe support and resistance levels within the higher timeframe zone.
- Candlestick patterns. We tend to only stick with pin bars and engulfing bars as these have proven to be the most effective.
EUR/USD
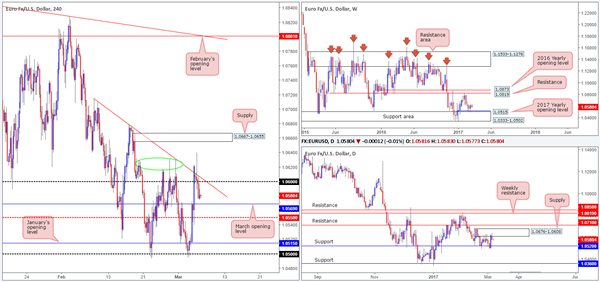
In recent trading, price failed to sustain gains beyond both the H4 trendline resistance extended from the high 1.0714 and the 1.06 handle, and as a result, pushed down to a low of 1.0574 on the day. With the H4 candles now seen trading just ahead of the March opening level at 1.0569, where does one go from here? Well, owing to daily action rebounding from a daily supply at 1.0676-1.0608 yesterday, and weekly price recently bouncing from the top edge of a major weekly support area at 1.0333-1.0502 (that's bolstered by the 2017 yearly opening level at 1.0515), there's certainly some conflict seen here on the higher timeframes!
Our suggestions: On account of the above notes, the only area that really jumps out to us this morning is seen around the 1.05/1.0520 area. The zone comprises of: a round number at 1.05, January's opening level at 1.0515, daily support at 1.0520 as well as being further reinforced by the weekly support area at 1.0333-1.0502. However, seeing as how the 1.05/1.0520 zone has already been tested twice, we would not be comfortable trading from here without additional lower-timeframe confirmation (see the top of this report).
Data points to consider: US trade balance at 1.30pm GMT.
Levels to watch/live orders:
- Buys: 1.05/1.0520 ([wait for a lower-timeframe signal to form before looking to pull the trigger] stop loss: dependent on where one confirms the zone).
- Sells: Flat (stop loss: N/A).
GBP/USD
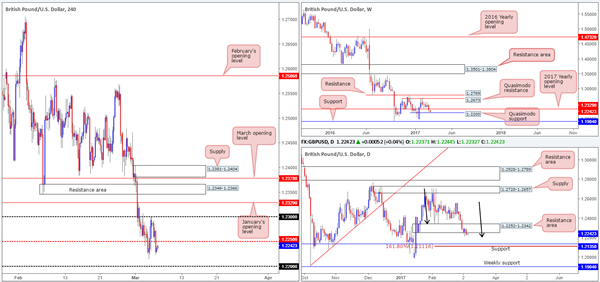
Climbing down from the top this morning, we can see that the weekly chart shows price trading within touching distance of the weekly Quasimodo support drawn from 1.22. In the event of a bounce being seen from here, the next upside hurdle in the firing range is the 2017 yearly opening level at 1.2329. Scooting down to the daily chart, daily demand at 1.2252-1.2342 (now acting resistance area) was taken out during the course of yesterday's segment. This has, as you can probably see, potentially opened up the path south down to daily support coming in at 1.2135, which happens to converge nicely with a H4 AB=CD (see black arrows) Fib 161.8% ext. at 1.2111.
Stepping across to the H4 candles, the H4 mid-way level at 1.2250 was wiped out during the early hours of yesterday's US segment. Below this base sits the psychological handle 1.22, which of course is also a weekly Quasimodo support! Looking to the left of current price from here, there is unfortunately very little H4 structure seen bolstering the 1.22 neighborhood. Couple this with daily price now open to test the daily support mentioned above at 1.2135, we feel 1.22 would be a risky place to simply place a pending buy order.
Our suggestions: In order to trade from 1.22, we would strongly recommend waiting for a lower-timeframe confirming signal to take shape (see the top of this report). Assuming that 1.22 is engulfed, all eyes will be on the aforementioned daily support. This too, would require additional lower-timeframe confirmation to trade, since there's also very little supporting structure seen to the left of price on the H4 scale.
Data points to consider: US trade balance at 1.30pm GMT.
Levels to watch/live orders:
- Buys: 1.22 mark ([wait for a lower-timeframe signal to form before looking to pull the trigger] stop loss: dependent on where one confirms the zone). 1.2135 region ([wait for a lower-timeframe signal to form before looking to pull the trigger] stop loss: dependent on where one confirms the zone).
- Sells: Flat (stop loss: N/A).
AUD/USD
For those who read yesterday's report you may recall that our desk suggested looking for potential lower-timeframe shorting opportunities from the 0.7609/0.76 region (daily resistance/round number). Well done to any of our readers who managed to lock down a position from here as price reacted beautifully and recently crossed swords with the first take-profit target: February's opening base at 0.7577.
As price is now effectively capped between 0.7609/0.76-0.7577, where does one go from here? Given that there is room to extend lower from the daily resistance down to a daily demand base coming in at 0.7511-0.7543, alongside weekly action also showing room to push lower down to a weekly support area at 0.7524-0.7450, our team remains biased to the downside at the moment.
Our suggestions: Based on the above, we see two possible trade scenarios going forward:
Wait and see if price retests the 0.7609/0.76 region. Assuming that this comes to fruition and a lower time-frame confirming signal is seen (see the top of this report) we would look to short from here again.
In the event that price fails to reach 0.7609/0.76 and closes below February's opening level at 0.7577, we would look to short any retest seen at this number assuming that it's backed with a lower-timeframe confirming signal, targeting the H4 mid-way point 0.7550 (positioned directly above the daily demand at 0.7511-0.7543).
Data points to consider: Australian monetary policy meeting minutes at 3.30am. US trade balance at 1.30pm GMT.

Levels to watch/live orders:
- Buys: Flat (stop loss: N/A).
- Sells: 0.7609/0.76 region ([wait for a lower-timeframe signal to form before looking to pull the trigger] stop loss: dependent on where one confirms the zone). Watch for price to engulf 0.7577 and then look to trade any retest seen thereafter (waiting for a lower-timeframe confirming signal to form following the retest is advised] stop loss: dependent on where one confirms the level).
USD/JPY:
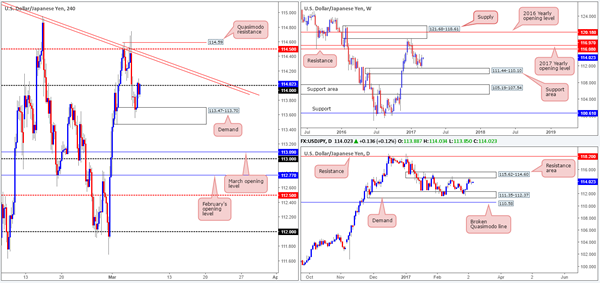
The USD/JPY, as you can see, gapped south at the open on Sunday but failed to generate much follow-through selling as the pair soon after touched gloves with a H4 demand area coming in at 113.47-113.70. As can be seen from the H4 chart, price ended the day pretty much unchanged around the underside of the 114 handle, consequently forming a daily indecision candle.
With weekly action recently printing a strong-looking weekly bullish engulfing candle, and daily movement seen loitering around the underside of a daily resistance area at 115.62-114.60, higher-timeframe technicals are somewhat mixed at the moment.
Our suggestions: While a H4 close above 114 would be considered a bullish signal, and considering that you'd be trading in line with weekly flow, price may very well reach the nearby H4 trendline resistance extended from the high 115.62, followed closely by the H4 mid-way resistance at 114.50. However, this would also place one against daily sellers! It's just not worth the risk, in our opinion. The same goes for shorting this piece. A short would obviously place one in line with daily flow, but against weekly direction!
Therefore, at least for now, we will remain on the sidelines.
Data points to consider: US trade balance at 1.30pm GMT.
Levels to watch/live orders:
- Buys: Flat (stop loss: N/A).
- Sells: Flat (stop loss: N/A).
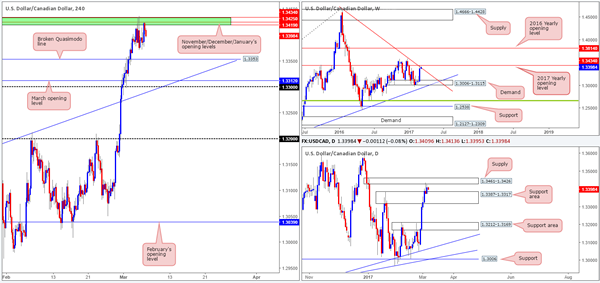
USD/CAD
As can be seen from the H4 chart this morning, upside remains capped at 1.3434/1.3419 (November, December and January's opening levels). Also of note here is the converging weekly trendline resistance extended from the high 1.4689 and daily supply coming in at 1.3461-1.3426. Assuming that the bears remain in the driving seat here, the next downside target on the H4 scale is a broken Quasimodo line at 1.3353. While this sounds like a sellers' paradise, it may be worth noting that there is a daily support area seen in play at 1.3387-1.3317 so the bulls still have a hand in this fight.
Our suggestions: If one is able to pin down a lower-timeframe short position (see the top of this report) from the above noted monthly levels, one could consider shorting from here and target the above said broken H4 Quasimodo level at 1.3353. In regards to buying this unit, we would advise against this given the opposing structures seen on the weekly and daily timeframes.
Data points to consider: US trade balance at 1.30pm. Canadian trade balance at 1.30pm GMT.
Levels to watch/live orders:
- Buys: Flat (stop loss: N/A).
- Sells: 1.3434/1.3419 ([wait for a lower-timeframe signal to form before looking to pull the trigger] stop loss: dependent on where one confirms the zone).
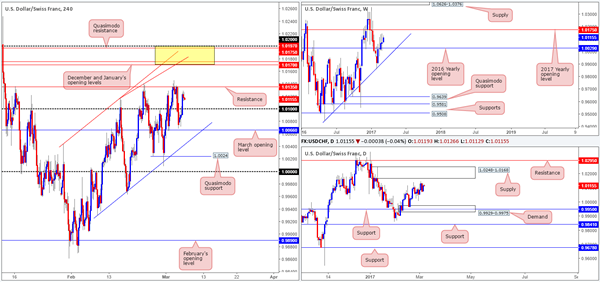
USD/CHF:
Kicking this morning's report off with a look at the weekly timeframe, we can see that the bulls have a slight edge this morning and may end the week connecting with the 2017 yearly opening level at 1.0175. Looking down to the daily candles, there's a nearby daily supply seen at 1.0248-1.0168, which happens to encapsulate the aforementioned 2017 yearly opening line.
Despite H4 price being capped by a H4 resistance at 1.0135, our team still has their beady little eye on the 1.02/1.0170 (yellow zone) neighborhood for shorts. The area comprises of the following converging structures: both December and January's opening levels at 1.0170/1.0175, a H4 trendline resistance pegged from the high 1.0118, a H4 Quasimodo resistance at 1.0197, a 1.02 psychological handle and let's not forget that all of this is seen housed within the daily supply zone mentioned above 1.0248-1.0168.
Our suggestions: In light of this confluence, our team will, dependent on the time of day, look to sell from the 1.0175 neighborhood, with stops placed a few pips above 1.02.
Data points to consider: US trade balance at 1.30pm GMT.
Levels to watch/live orders:
- Buys: Flat (stop loss: N/A).
- Sells: 1.0175 region ([an area one could possibly trade at market] stop loss: 1.0205).
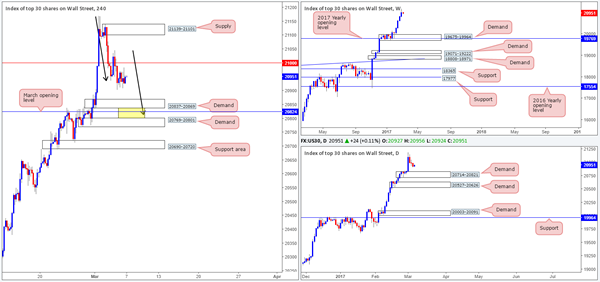
DOW 30
The equity market took on a more sober approach on Monday, ranging a mere 86 points on the day. In light of this, much of the following will report will echo thoughts put forward in yesterday's analysis…
The US equity market continued to climb north last week, registering its fourth consecutive weekly gain! With equities now trading at record highs, where do we go from here? Well, given that there is absolutely no weekly resistance levels in sight, the best we can do for the time being is continue looking to ‘buy the dips'. The closest higher-timeframe area can be seen at 20714-20821: a daily demand zone.
Our suggestions: We still have an eyeball on the area seen between the two H4 demands: 20769-20801/ 20837-20869, which happens to be positioned within the walls of the aforementioned daily demand zone! The interesting thing here is that in between these two H4 barriers (the yellow zone) is March's opening level at 20824 and a possible H4 AB=CD completion point at 20813 (see black arrows). To that end, should we see price strike the yellow zone today/this week, our team would, assuming that a reasonably sized H4 bull candle took shape, look to buy from here with stops either placed below the trigger candle or below the H4 demand at 20769-20801.
Data points to consider: US trade balance at 1.30pm GMT.
Levels to watch/live orders:
- Buys: 20801/20837 region ([wait for a reasonably sized H4 bull candle to form before looking to pull trigger here] stop loss: ideally beyond the trigger candle).
- Sells: Flat (stop loss: N/A).
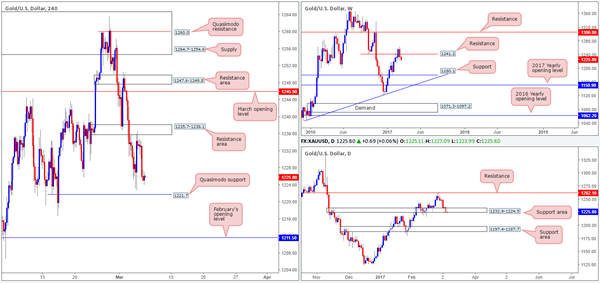
GOLD
Across the board, we saw the dollar advance yesterday which helped the yellow metal catch an offer from the underside of the H4 resistance area at 1235.7-1238.1. To our way of seeing things, the next support target on this scale to have an eyeball on is the H4 Quasimodo support drawn in at 1221.7.
Over on the daily chart, it's clear that the bulls are struggling to hold ground around the daily support area seen at 1232.9-1224.5, given yesterday's full-bodied daily bearish candle! Looking up on the weekly chart, recent action chalked up a beautiful-looking weekly bearish engulfing candle around the weekly resistance line of 1241.2.
Our suggestions: However, despite both the weekly and daily timeframes indicating further selling may be on the cards, selling into a H4 Quasimodo support is not something we'd be comfortable with! Nevertheless, in the event that a H4 close beyond this line is seen and is followed up with a retest as well as a lower-timeframe sell signal (see the top of this report), we would look to short bullion, targeting February's opening line at 1211.5 as an initial first take-profit target.
Levels to watch/live orders:
- Buys: Flat (stop loss: N/A).
- Sells: Watch for price to engulf 1221.7 and then look to trade any retest seen thereafter (waiting for a lower-timeframe confirming signal to form following the retest is advised] stop loss: dependent on where one confirms the level).
European Open Briefing
Global Markets:
- Asian stock markets: Nikkei down 0.20 %, Shanghai Composite lost 0.10 %, Hang Seng and ASX 200 both rose 0.30 %
- Commodities: Gold at $1226 (+0.05 %), Silver at $17.78 (+0.05 %), WTI Oil at $53.20 (-0.05 %), Brent Oil at $55.95 (-0.10 %)
- Rates: US 10-year yield at 2.49, UK 10-year yield at 1.22, German 10-year yield at 0.34
News & Data:
- Australia AIG Construction Index (Feb): 53.1 (prev +0.7 to 47.7)
- Japan Foreign Reserves (USD) (Feb): 1232.3bn (prev 1231.6bn)
- UK BRC Retail Sales Monitor like-for-like (YoY) (3m to Feb): -0.40% (est -0.20%, prev -0.60%)
- PBOC sets USD/CNY mid-point today at 6.8957 (vs. yesterday at 6.8790)
- RBA Rate Decision:
- RBA holds Cash Rate at 1.50%, as expected
- Rising Australian dollar could complicate economic transition
- Global economic conditions have improved over recent months
- Unchanged policy consistent with growth, inflation targets
- Labour indicators have been mixed
- Higher commodity prices have supported a rise in Australia's national income
- Headline inflation expected to pick up over the course of 2017
- House prices rising briskly in some markets
- US rates expected to rise further, no longer expectations of further easing in other major economies
- Australian economy continuing to transition after mining boom
Markets Update:
The main event overnight was the RBA rate decision. The central bank left rates unchanged as expected. In its statement, it acknowledged that global economic conditions have improved. Further, the RBA saw inflation rising during the course of the year, though labour conditions have been mixed.
Overall, it was a neutral statement and signalled that the RBA will remain on hold in the near-term. This was in line with expectations.
The Australian Dollar rose nevertheless, on the fact that there were no dovish comments. AUD/USD rallied from 0.7590 to a high of 0.7630 so far.
Price action in the other major pairs was relatively quiet. NZD/USD followed the AUD higher, rising from 0.6980 to 0.7020. The Euro, Yen and Pound are almost unchanged on the day against the Dollar.
Upcoming Events:
- 07:00 GMT – German Factory Orders08:30 GMT – UK Halifax House Price Index
- 10:00 GMT – Euro Zone GDP
- 13:30 GMT – US Trade Balance
- 13:30 GMT – Canadian Trade Balance
- 15:00 GMT – Canadian Ivey PMI
- 23:50 GMT – Japanese GDP
- 23:50 GMT – Japanese Current Account
Market Morning Briefing
STOCKS
Dow (20954.34, -0.24%) and Dax (11958.40, -0.57%) closed a little lower yesterday. Markets seem to be quiet just now allowing some correction in the indices after the recent rally. As mentioned yesterday, Dow may move towards 20750 while Dax could test 11800 on the downside before seeing an immediate bounce back.
Nikkei (19345.49, -0.17%) has not been able to sustain levels above 19600 and while below 19600, we may expect a test of 19200-19000 levels in the near term.
Shanghai (3233.72) is almost stable near current levels. It could try to inch up towards 3250 and higher in the coming sessions. We do not expect a break below 3200 in the near term.
Nifty (8963.45, +0.74%) is in a consolidation mode within the 8800-9000 region and unless we see a break on either side, it would be difficult to get any directional clarity just now. We prefer a corrective fall from current levels before it continues to rally further but lack of immediate rejection may indicate that we need to wait for confirmation from the prices.
COMMODITIES
Gold (1226) is trading within its sideways range of 1212-1275. The bias will remain bearish as long it is trading below 1247-50.
Silver (17.72)also moved lower but somehow managed to hold its upward trend line support of 17.62. A close below 17.45 could be trend reversal from bullish to sideways.
Copper (2.64) looks weak due to its failure to close above 2.73. It is still holding its upward trend line support at 2.63 since October 16, but the bullish momentum is becoming weak. A close below 2.63-60 could open up lower levels of 2.53 and 2.44 respectively.
Brent (55.60) and WTI (53.14) both are trading within their narrow ranges of 54-58 and 52-55 with no directional bias.
FOREX
The RBA decision will be released today though no change is expected, same as the ECB meet on Thursday, 9th March'17. Almost all the currencies are mute with the volatility collapsing.
Dollar Index (101.66) is trading quietly in the range of 100.70-102.25 in line with our expectations and may continue that for the rest of the week.
Euro (1.0607), taking cue from the Dollar, is trading sideways too and the range of 1.0500-1.0630 may remain intact even after the ECB meet on 9th Mar'17.
Dollar-Yen (113.97) hasn't moved much in the last session and the probability of horizontal trade in the range of 113-115 for the week looks much stronger now. The stability in EURJPY (120.63) in the near term may be beneficial for both Euro and Yen but a break above 121.25-35 may take Euro to 1.0630-50 levels once again.
Pound (1.2241) has been consolidating in the narrow range of 1.22-23 for the last 3 sessions as expected but the downside targets of 1.2100-1.2085 remain unchanged.
Aussie (0.7592) remains almost unchanged as it waits for the RBA rate review conclusion. The status quo is expected to be maintained but technically, the currency may test the near term support zone 0.7520-00 before declining further to lower levels of 0.7450.
Dollar-Rupee (66.72) ended the session with a loss in a very grinding manner. The major support 66.50 may be tested in the next couple of sessions but no major movement is expected with 66.90-67.00 capping the upside for the week.
INTEREST RATES
The US 10-5Yr yield spread (0.48%) has bounced from channel support and could move higher in the near term towards 0.50%.
The US yields have moved up. The 5Yr (2.02%), 10YR (2.50%) and the 30Yr (3.10%) are trading higher as compared to previous levels of 2%, 2.47% and 3.06% respectively. The 30YR is exactly at resistance levels and if it breaks on the upside, would indicate further bullishness which could pull up the shorter term yields too.
The US-Japan (2.43%) yield differential has been moving up in the past 2-sessions and if it continues to move higher, it could indicate some more weakness in the Japanese Yen.
The UK 10-5Yr spread (0.61%) has collapsed from levels near 0.93% due to increase in the 5Yr (0.60%) yields must faster and sharper than the 10YR and 20YR yields. The 10-5YR spread may bounce back from current levels to move up towards 0.705 in the next few sessions.