
Sample Category Title
USDCHF Faces Hurdles Near Recent Highs
- USDCHF takes a breather after hitting a four-month high
- Buying the dip has an advantage above 0.8750
- US core PCE inflation eyed for more volatility later today
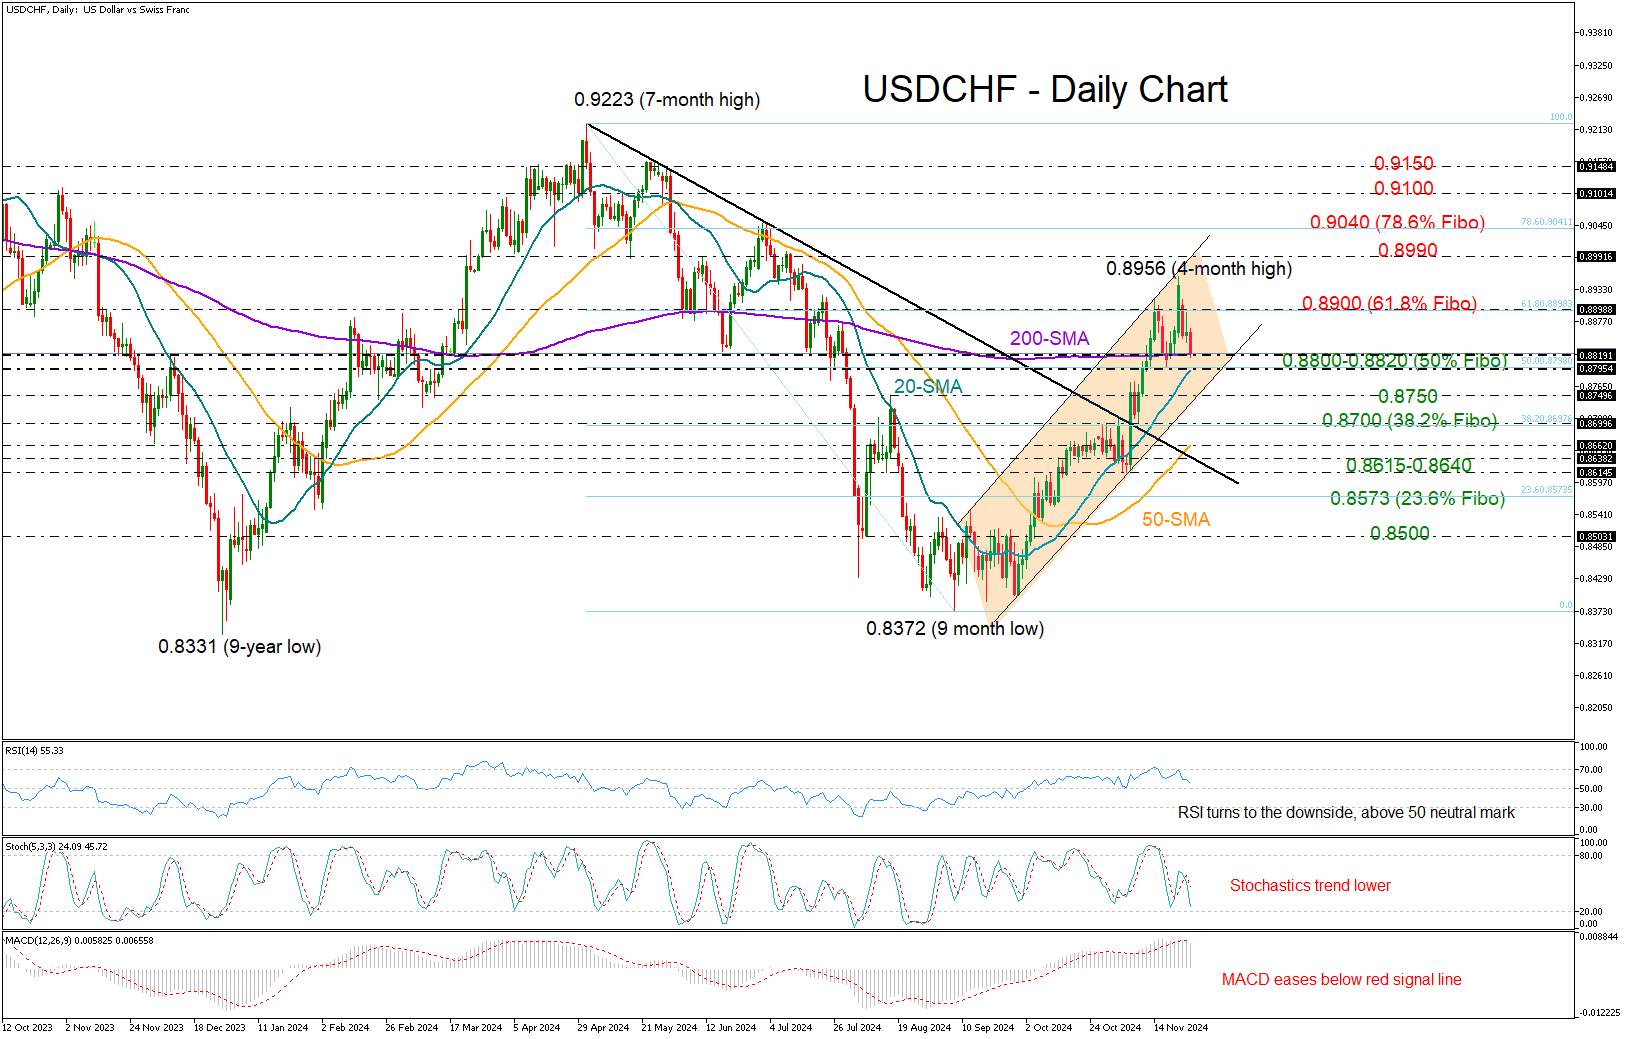
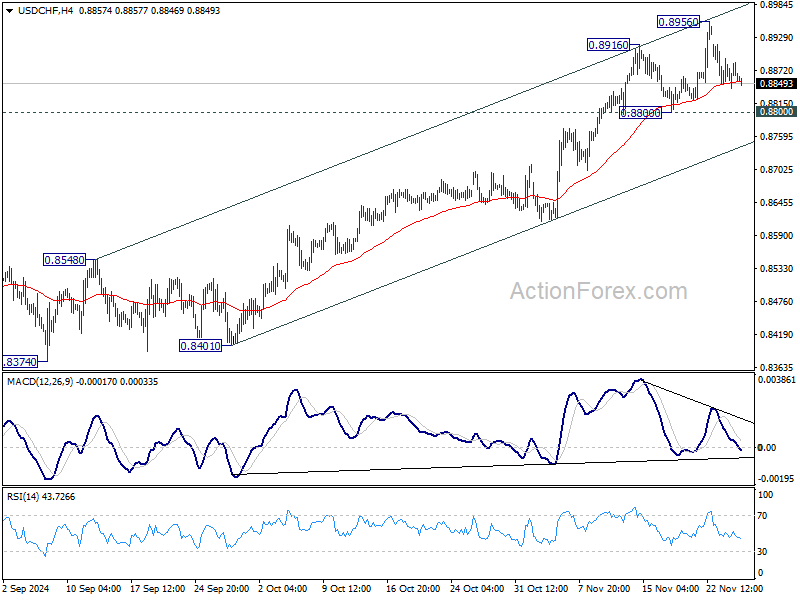
USDCHF lost momentum after its uptrend peaked at a four-month high of 0.8956 last Friday, and there could be more cloudy periods ahead according to the technical picture.
With the RSI changing trajectory to the downside after topping near its 70 overbought level and the MACD sliding below its red signal line, the risk is more on the downside than on the upside.
That said, the price continues to trade within an upward-sloping channel and the 20- and 200-day simple moving averages (SMAs), which could balance selling interest within the 0.8800-0.8820 region, are heading for a positive intersection. Hence, any potential declines could still be attractive, unless there is a negative correction beneath 0.8750.
In the event selling forces strengthen below 0.8750, the 38.2% Fibonacci retracement of the May-September upleg could take action around 0.8700 ahead of the 50-day SMA. Slightly lower, the 0.8615-0.8640 zone could force some stability, preventing a continuation toward the 23.6% Fibonacci of 0.8573. If the latter fails to hold, the downfall could reach the 0.8500 mark.
Should the bulls bounce back above 0.8900, they will aim for a test at the channel’s upper band near 0.8990. Success there could lead the pair toward the 78.6% Fibonacci level of 0.9040. Then, all the attention could turn to the 0.9100-0.9150 caution territory.
In summary, USDCHF could face some hurdles in the short-term, though it could stay attractive to buyers if it manages to rotate near 0.8750. Watch out for the US core PCE inflation data due today at 13:30 GMT.
US 100 Index Rally Loses Steam
- US 100 index trades sideways, a tad below its all-time high
- It continues to battle with the August 5, 2024 trendline
- Momentum indicators are modestly bullish at this stage
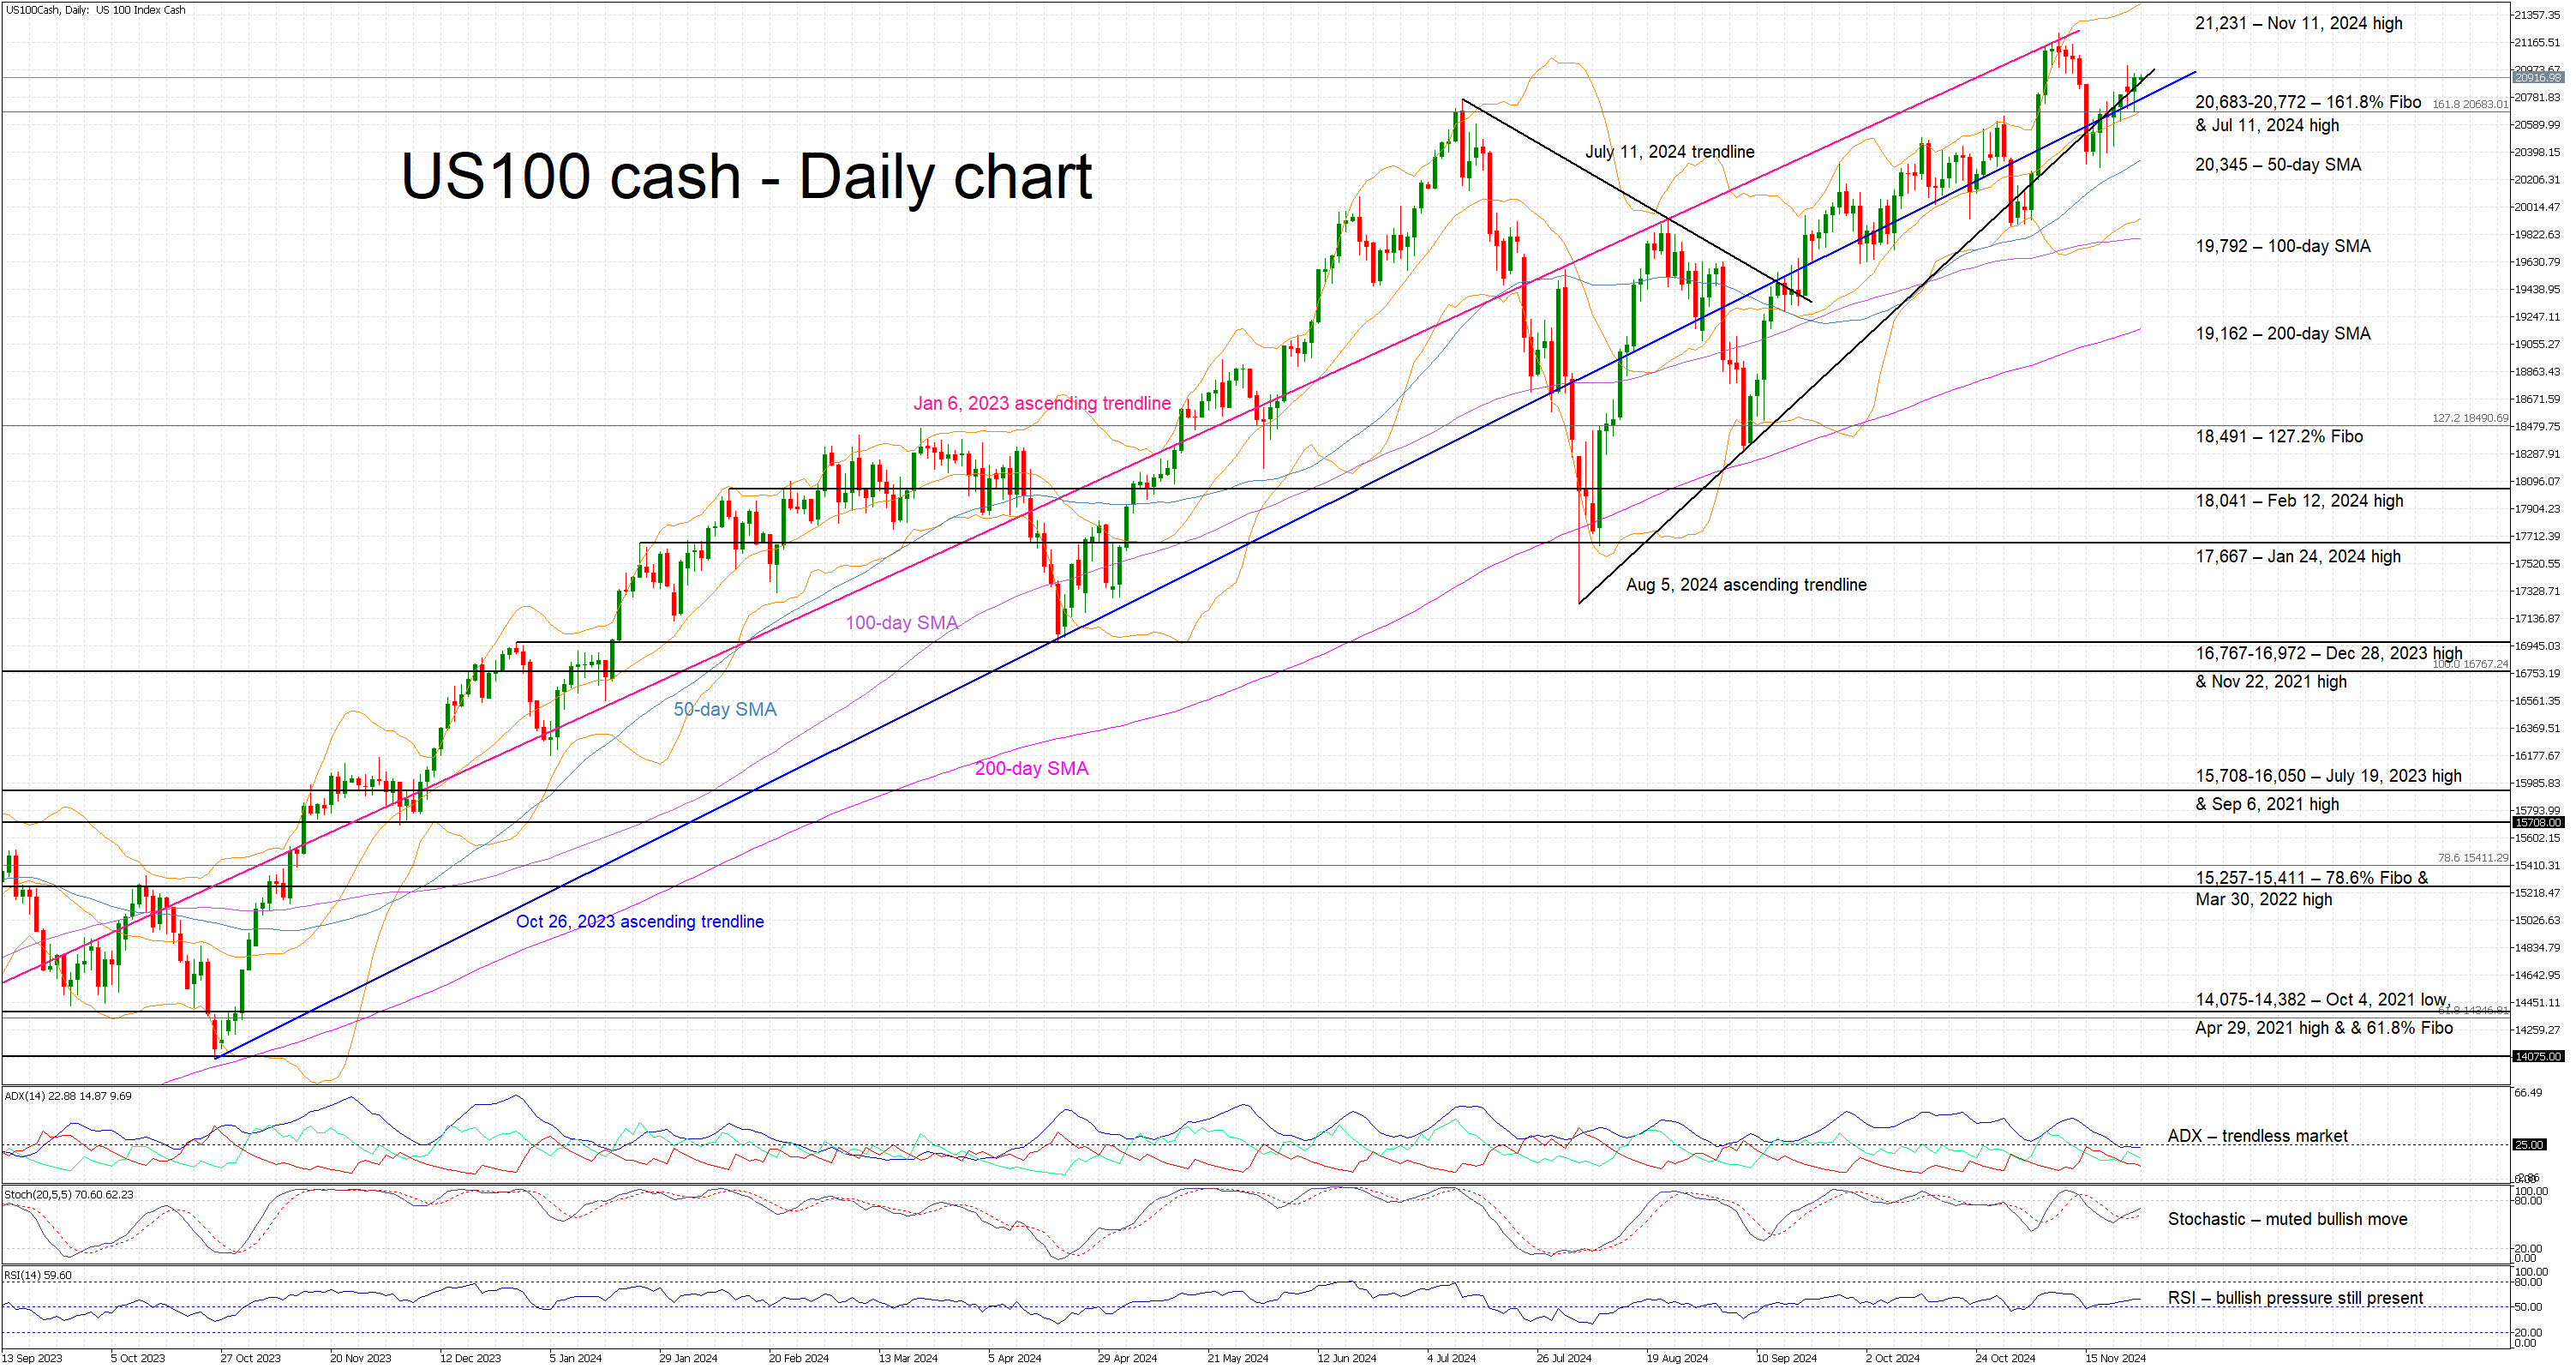
The US 100 cash index is trading sideways today, moving in parallel with the August 5, 2024 ascending trendline. Market sentiment is modestly bullish but quite fragile, as risky markets are trying to adjust to the latest developments in active conflict regions and the tariffs announcements by President-elect Trump. Meanwhile, the bullish trend since the August 5 low needs a new higher high to remain valid.
The momentum indicators are somewhat bullish at this juncture. More specifically, the RSI is hovering a tad above its midpoint and thus pointing to some lingering bullish pressure. More importantly, the stochastic oscillator is edging towards its overbought area (OB), but it appears to lack the momentum that resulted in the November 11, 2024 all-time high. Interestingly, the Average Directional Movement Index (ADX) is not convinced of the current movement, as it is hovering below its midpoint and thus signalling a trendless market.
Should the bulls remain confident, they could try to keep the US 100 index above the 20,683-20,772 area, and gradually push it higher towards 21,231. If successful, the door would then be wide open to a new all-time high, with the 21,500 level being the first target. Even higher, the 200% Fibonacci extension level of the November 22, 2021 – October 13, 2022 downtrend is positioned just north of 23,000.
If the bears manage to regain the reins, they could try to push the US 100 index below the busy 20,683-20,772 region, which is populated by the 161.8% Fibonacci extension level, the July 11, 2024 high and the August 5, 2024 and October 26, 2023 ascending trendlines. A move below this busy area could tip the balance in favour of the bears, potentially allowing them to test the support set by the 50- and 100-day simple moving averages (SMAs) at 20,345 and 19,792 respectively.
To sum up, the US 100 index is on a gentle upwards move, but momentum is fragile ahead of some key US data releases and a relatively quieter week due to the Thanksgiving holiday.
Euro and Pound Correct Ahead of Key Economic Data Releases
The start of the final trading week of November has been eventful. Several currency pairs experienced a "gap" or price difference between Friday's close and Monday's opening. For instance, the GBP/USD pair opened 60 pips lower, EUR/USD saw a 70-pip gap, and USD/JPY opened with a 50-pip difference. At the week's outset, the USD faced a downward pullback, which in some pairs has since transitioned to a sideways trend. Analysts attribute this sharp retreat to market reactions following Trump’s selection of a Treasury Secretary. Scott Bessent recently stated that tariffs should be introduced gradually, and his supporters believe he could help curb the growth of the U.S. budget deficit.
EUR/USD
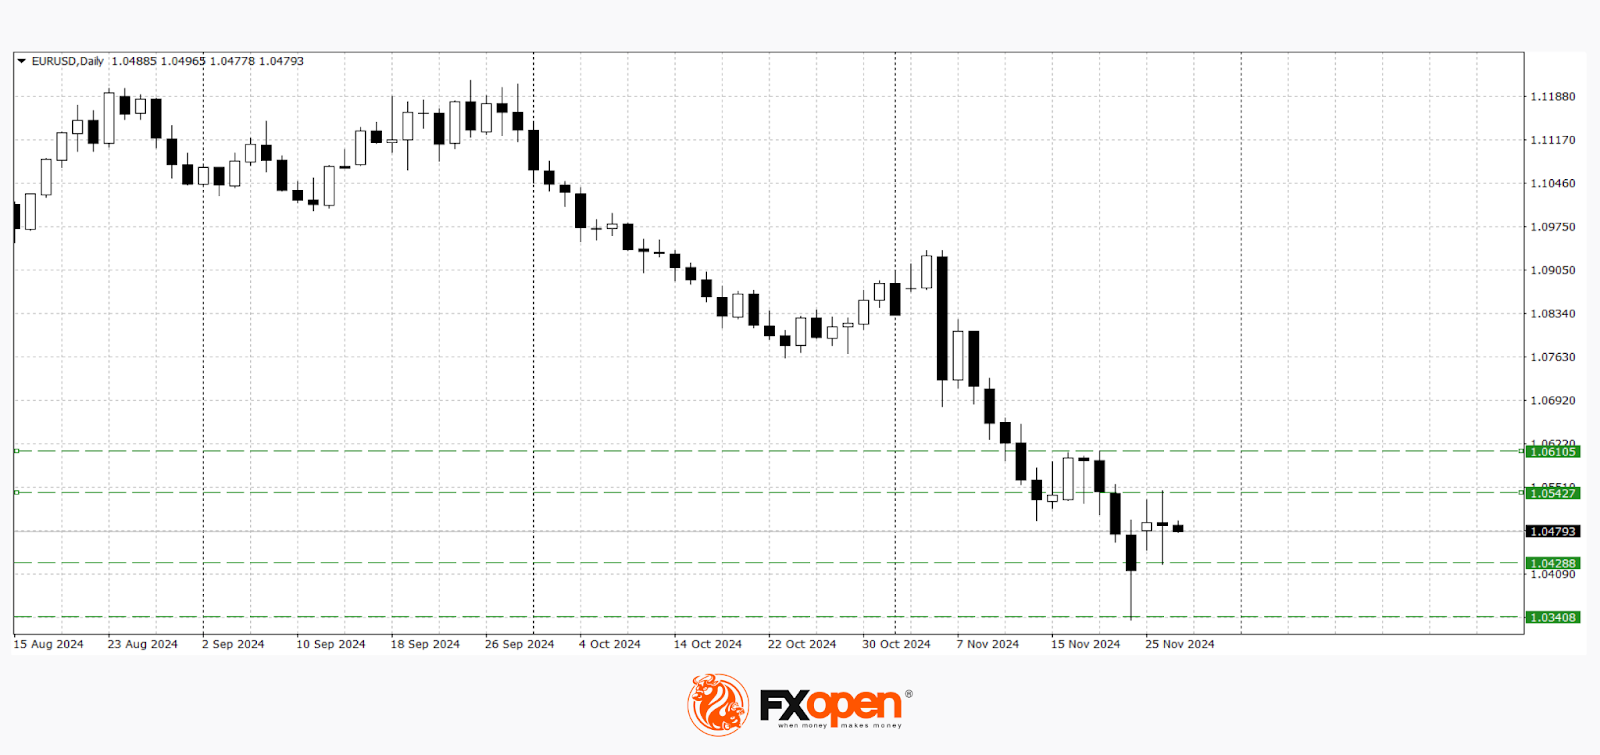
As anticipated, the EUR/USD pair has renewed last year’s lows, briefly trading below 1.0400. A sharp rebound from the 1.0330 level allowed buyers to regain momentum, pushing the pair up to 1.0540. Currently, the upward correction has shifted into a sideways movement within the 1.0500–1.0400 range. The next breakout with consolidation is likely to dictate the pair's direction:
A move above 1.0540 could prompt a test of the 1.0700–1.0800 zone.
A break below the recent low at 1.0330 might pave the way for a test of 1.0200–1.0000.
The upcoming trading sessions could be pivotal for EUR/USD, with the following key events on the calendar:
- Today at 11:00 (GMT+3): European Central Bank non-monetary policy meeting
- Today at 16:30 (GMT+3): U.S. GDP data for Q3
- Today at 18:00 (GMT+3): U.S. core personal consumption expenditures price index
- Tomorrow at 16:00 (GMT+3): Germany’s November consumer price index (CPI)
GBP/USD
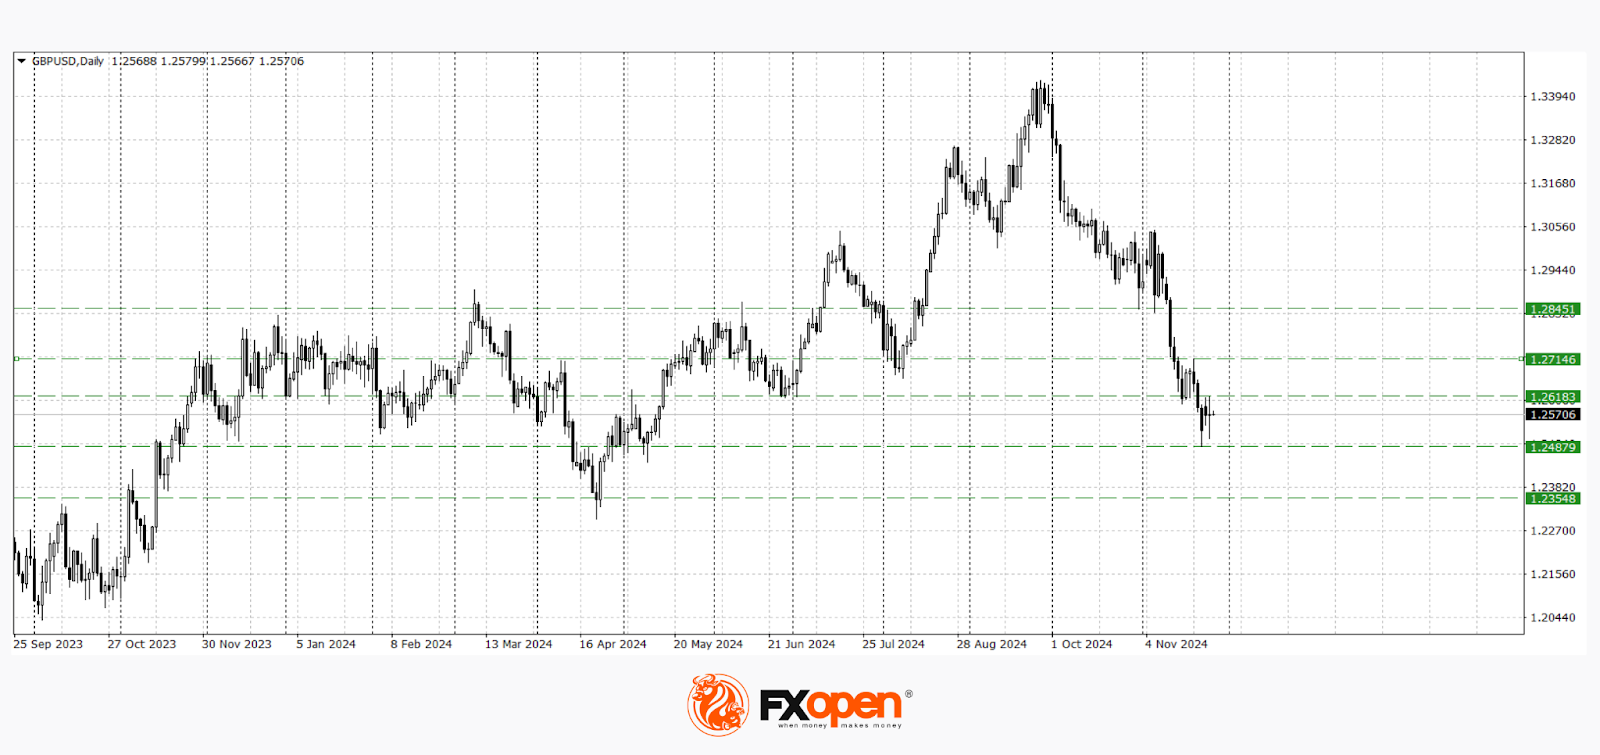
Technical analysis of the GBP/USD pair suggests price consolidation within the 1.2620–1.2480 range.
If buyers manage to push the pair above 1.2620 during upcoming sessions, a robust upward correction towards 1.2720–1.2840 could develop.
Conversely, breaking the support at 1.2480 could renew bearish momentum, targeting 1.2350–1.2300.
Important UK economic data is expected on Friday, including mortgage lending figures and the Bank of England's financial stability report.
Trade over 50 forex markets 24 hours a day with FXOpen. Take advantage of low commissions, deep liquidity, and spreads from 0.0 pips. Open your FXOpen account now or learn more about trading forex with FXOpen.
This article represents the opinion of the Companies operating under the FXOpen brand only. It is not to be construed as an offer, solicitation, or recommendation with respect to products and services provided by the Companies operating under the FXOpen brand, nor is it to be considered financial advice.
USDJPY Meets 152.00 Key Level
- USDJPY loses ground around 200-day SMA
- RSI and MACD head south
USDJPY has declined considerably toward the 200-day simple moving average (SMA) around 152.10, with the potential to hit the short-term uptrend line before heading upwards again.
The momentum oscillators are confirming the recent bearish movement. The RSI is pointing downwards, falling beneath the neutral threshold of 50, while the MACD is standing beneath its trigger line, losing some steam.
Further declines could see traders meeting the 151.30 support level, ahead of the 50-day SMA at 150.60. A tumble beneath these lines could endorse the bearish outlook, challenging the 149.15 barrier.
On the other hand, a pullback from either the 200-day SMA or the near-term rising trend line could lead the bulls towards the 153.25 resistance level. More increases could drive the market until the three-and-a-half-month high of 156.75.
To sum up, USDJPY is posting notable losses, but the outlook remains positive in the short-term view.

Picture for EUR/USD Looks Fragile, With Return to 1.0335 Still Very Well Possible
Markets
US President-elect Trump announcing he will raise tariffs on imports from Canada and Mexico by 25% and the levy on China by 10% in the end only had a limited impact on markets. Early rises in yields and the dollar were largely reversed. The US yield curve closed with the 2-y 1.2 bps lower (benchmark change) and the 10-y adding 3.3 bps. However, the biggest intraday swigs came in US trading hours, not immediately after the Trump announcements. US yields initially (re)gained a few basis points on mixed regional confidence and housing data. US consumer confidence rebounded to the best level since July last year. A $70 bln 5-y auction went ok, with a slightly above average bid-to-cover ratio (2.43) and a yield print close to the WI bid (4.197%). While individual policy makers evidently still put personal accents in their assessment of policy, the global tone from the Fed minutes of the November 7 meeting was that as inflation is continuing to move to the 2.0% target but the economy remaining near maximum employment, it would likely be appropriate to move gradually toward a more neutral policy stance. Uncertainty on the level of this neutral rate makes it difficult to assess the degree of policy restriction and is an additional reason for a cautious approach. Markets still see about a 60% chance on a December Fed rate cut. German yields remained under modest downward pressure easing between 0.8 bps (2-y) and 2.3 bps (10-y). US equities for now didn’t see much of a risk from the Trump tariffs announcement. The S&P 500 set a new record close (+0.57%). The dollar showed no clear directional pattern. DXY finish slightly higher from Monday’s close at 107.01.EUR/USD after an intraday rebound finish little changed (1.0489). The yen still outperformed (USD/JPY close 153.08 from 154.2).
Asian equity indices this morning are trading mixed as regional investors ponder the potential impact of Trump’s trade policy. Later today, the US calendar is well filled with amongst others a revision to the US Q3 GDP data, durable goods orders, jobless claims, the Chicago PMI and spending and income data, including the price deflators. Both the Y/Y headline (2.3%) and core (2.8%) PCE deflators are expected slightly higher from last month. The might have some intraday impact but the debate on a December rate cut won’t be concluded today as markets are counting down to the Thanksgiving weekend. US yields are in a mild correction after recent rally. In Europe, we look out how much room there is left after recent decline in yields. Even in case of a pause, the picture for EUR/USD looks fragile, with a return to the 1.0335 correction low still very well possible. Yen outperformance still continues, also this morning.
News & Views
The Reserve Bank of New Zealand lowered its policy rate for a second consecutive meeting by 50 bps, from 4.75% to 4.25%. RBNZ governor Orr suggested that a third such move would come at February 19 meeting conditional on economic projections panning out. The RBNZ puts an average policy rate of 3.83% forward in Q2 2025 (vs 4.36% in August forecasts). The landing zone remains broadly unaltered (3.17% average in Q4 2026 vs 3.13%) implying no intention to bring policy rates below neutral levels. Annual inflation forecasts for Q4 2024, 2025 and 2026 stand at 2.1%, 2.4% and 2.1%, close to August levels (2.3%-2.3%-2%). The downturn in domestic activity had stabilized in recent months, following the pronounced and broad-based deterioration observed in August. Growth is expected to recover during 2025, but considerable spare productive capacity remains in the economy. NZD swap rates rebound up to 10 bps at the front end of the curve as some expected more dovish language or even already a 75 bps rate cut today. NZD/USD leaves the YTD lows around 0.58 behind to currently change hands around 0.5870.
The pace of annual Australian inflation was unchanged in October (2.1% Y/Y), the lowest level since July 2021. The significant drop from 3.8% Y/Y in June Is mainly due to price falls in Electricity and Automotive fuel prices. Core measures show a more diffuse picture. Annual trimmed mean inflation was 3.5%, up from 3.2% and similar to where it was in August. The CPI excluding volatile items and holiday travel was 2.4% Y/Y, down from 2.7% in September. The next quarterly inflation report, used as key RBA-input will only be published on Jan 29. AUD/USD remains stuck near the recent lows sub-0.65...
EUR/USD Daily Outlook
Daily Pivots: (S1) 1.0428; (P) 1.0486; (R1) 1.0548; More...
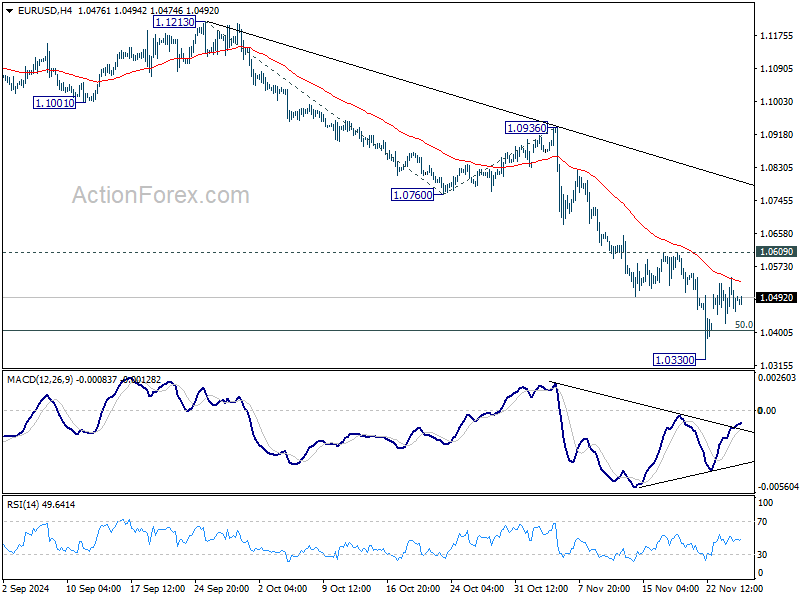
EUR/USD is staying in consolidation above 1.0330 and intraday bias remains neutral. Further decline is expected as long as 1.0609 resistance holds. On the downside, sustained trading below 1.0404 key fibonacci level will carry larger bearish implication and target next level at 161.8% projection of 1.1213 to 1.0760 from 1.0936 at 1.0203. However, firm break of 1.0609 will confirm short term bottoming, and turn bias back to the upside for 1.0760 support turned resistance first.
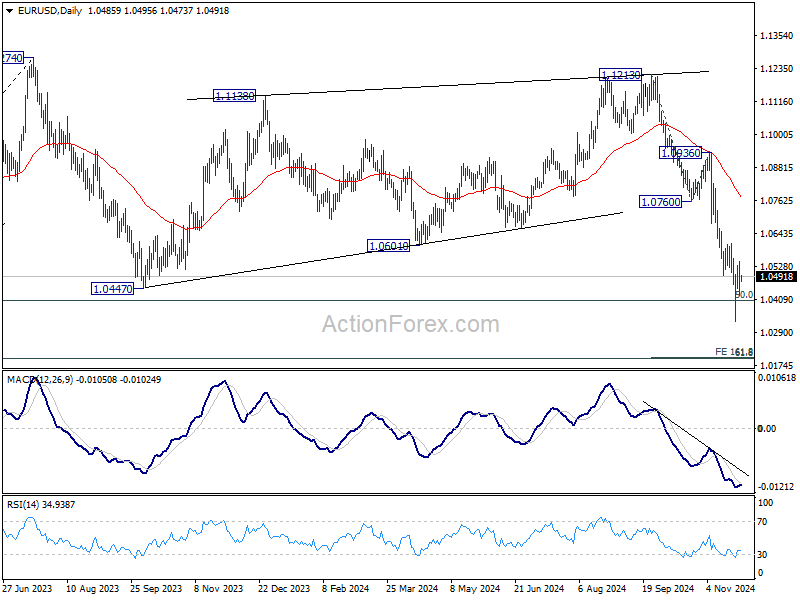
In the bigger picture, immediate focus is now on 50% retracement of 0.9534 (2022 low) to 1.1274 at 1.0404. Strong rebound from this level will keep price actions from 1.1273 (2023 high) as a medium term consolidation pattern only. However, sustained break of 1.0404 will raise the chance that whole up trend from 0.9534 has reversed. That would pave the way to 61.8% retracement at 1.0199 first. Firm break there will target 0.9534 low again.
USD/JPY Daily Outlook
Daily Pivots: (S1) 152.57; (P) 153.53; (R1) 154.07; More...
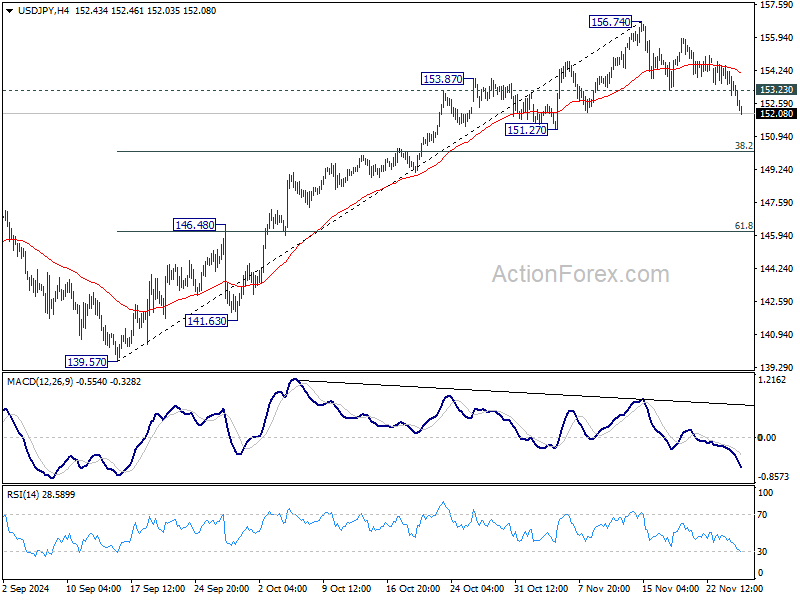
Intraday bias in USD/JPY stays on the downside as corrective fall from 156.74 is in progress. Deeper decline would be seen to 38.2% retracement of 139.57 to 156.74 at 150.18. On the upside, above 153.23 minor resistance will turn intraday bias neutral first. But risk will stay on the downside as long as 156.74 resistance holds, in case of recovery.
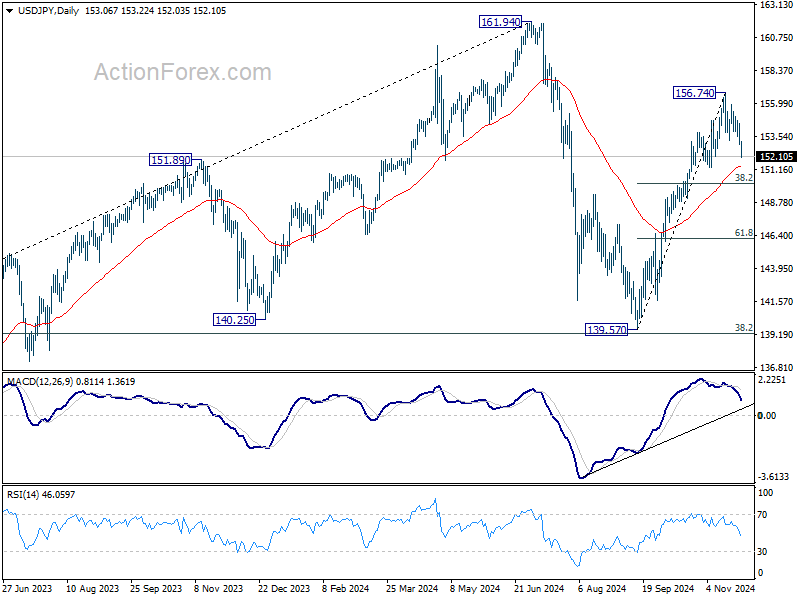
In the bigger picture, price actions from 161.94 are seen as a corrective pattern to rise from 102.58 (2021 low). The range of medium term consolidation should be set between 38.2% retracement of 102.58 to 161.94 at 139.26 and 161.94. Nevertheless, sustained break of 139.26 would open up deeper medium term decline to 61.8% retracement at 125.25.
GBP/USD Daily Outlook
Daily Pivots: (S1) 1.2511; (P) 1.2564; (R1) 1.2620; More...
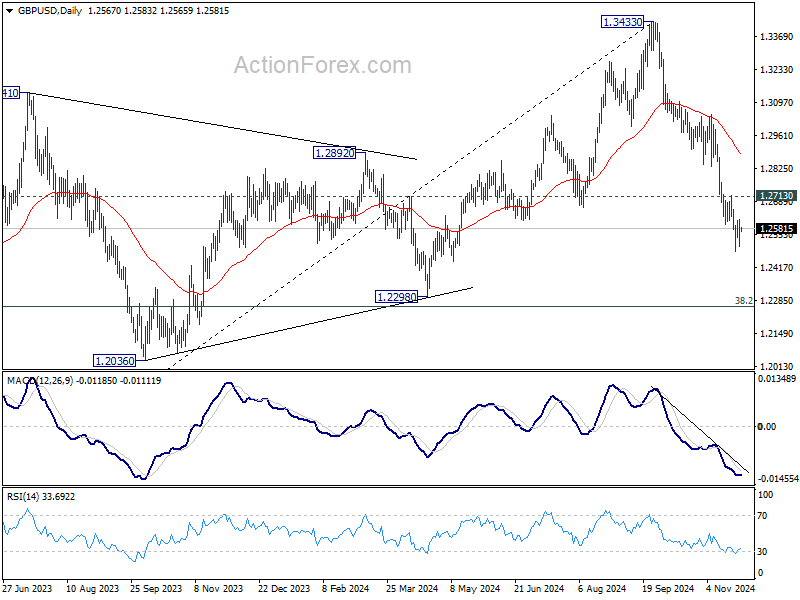
GBP/USD is staying in consolidation above 1.2486 and intraday bias remains neutral. Further decline is expected as long as 1.2713 resistance holds. On the downside, break of 1.2486 will resume the fall from 1.3433 to 1.2298 cluster support zone.
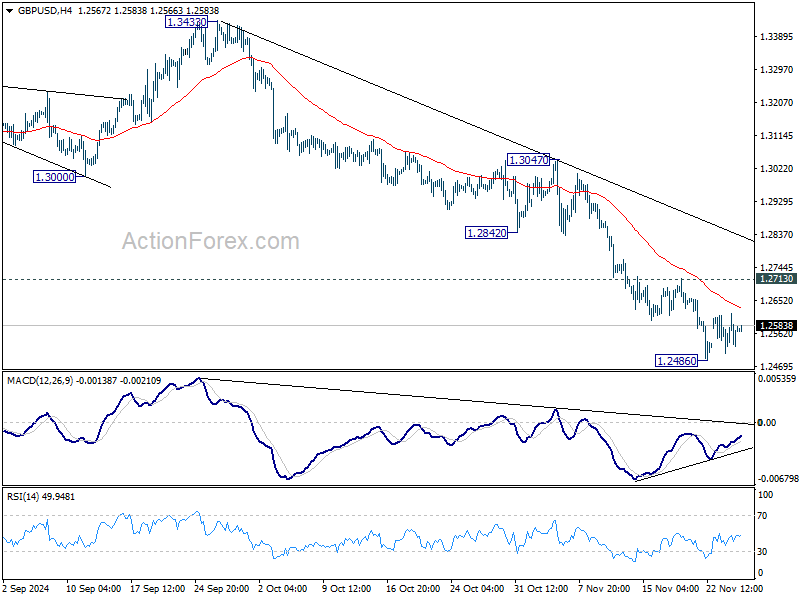
In the bigger picture, a medium term top should be in place at 1.3433, and price actions from there are correcting whole up trend from 1.0351 (2022 low). Deeper decline is now expected as long as 55 D EMA (now at 1.2893) holds, to 38.2% retracement of 1.0351 to 1.3433 at 1.2256, which is close to 1.2298 structural support. Strong support should be seen there to bring rebound.
USD/CHF Daily Outlook
Daily Pivots: (S1) 0.8840; (P) 0.8868; (R1) 0.8892; More…
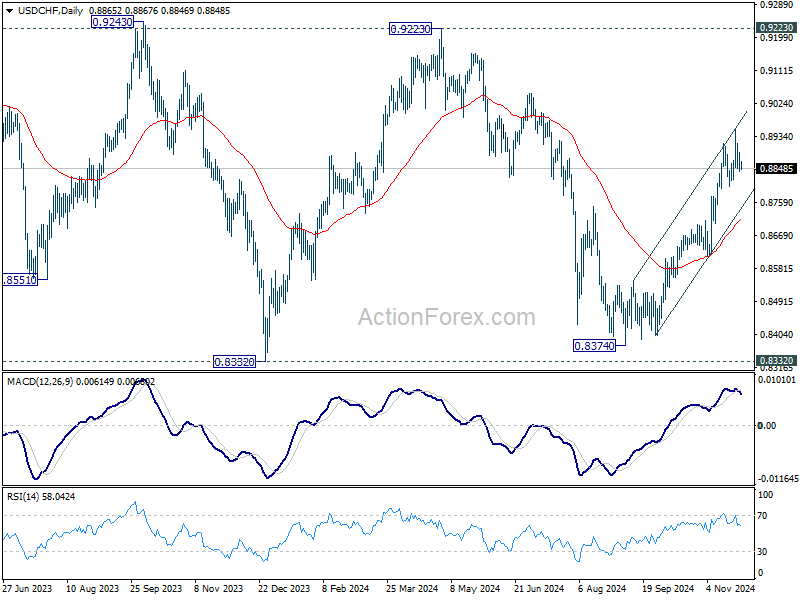
USD/CHF is staying in consolidation below 0.8956 and intraday bias remains neutral. Outlook will continue to stay bullish as long as 0.8800 support holds, in case of retreat. Break of 0.8956 will resume the rally from 0.8374, and target 0.9223 key resistance next.
In the bigger picture, price actions from 0.8332 (2023 low) are currently seen as a medium term corrective pattern. Rise from 0.8374 is seen as the third leg. Overall outlook will continue to stay bearish as long as 0.9223 resistance holds. Break of 0.8332 low is in favor at a later stage when the consolidation completes.
Ceasefire Gives Hope, US Data in Focus Before Thanksgiving
Even though Donald Trump’s tariff threats on China, Mexico and Canada didn’t concern Europe, the feeling in Europe was far from being comfortable yesterday. The word tariff gives cold chills especially to the European carmakers that already found themselves in crossfire with China. As such, Stellantis lost more than 5% yesterday while Volkswagen tanked another 2.76%.
Overall, Germany and Slovakia are the most vulnerable countries to any additional tariffs in Europe, because half of Germany’s GDP comes from exports, and cars make up to around 15% of these exports. Slovakia, on the other hand, has the highest per-capita car production globally, with automotive exports forming a significant part of its economy. The economic curse seems unrelenting for Germany. The country didn’t have time to get itself out of the energy crisis that the trade dispute is about to hit. Funny enough, you wouldn’t guess that the German economy is suffering badly when looking at the DAX valuations. The index trades near ATH levels, when the underlying economic fundamentals are telling a different story.
In the US, the market mood was better. Trump’s tariff threat, the rising inflation expectations as a result of them, and the cautious approach for further rate cuts from the latest Federal Reserve (Fed) minutes were outweighed by ceasefire news from the Middle East: Israel and Hezbollah inked a 60-day ceasefire agreement. The S&P500 posted its 52nd record high this year, the Dow Jones also extended its rally to a fresh record. Not everyone was happy, though. GM for example tanked 9% as its supply chain’s heavy reliance on both sides of its borders will explode the production costs and weigh on its profits.
Elsewhere, the energy companies had a slow session as crude oil consolidated and extended losses below the $70pb level on ceasefire news. Note that the news that OPEC+ is considering delaying the oil production restart beyond January has certainly tamed the selling pressure. Key nations at OPEC said that the timing may not be right for pushing 180’000 more barrels in an oversupplied market. The IEA for example predicts an oil surplus of more than 1mbpd next year – mainly due to the faltering Chinese demand. And that number risks being higher with Trump’s ‘drill baby drill’ policy. OPEC will meet at the start of next month and should drop plans to provide more oil in the next few months. And the latter should help throw a floor under the oil selloff, but will hardly reverse the medium-term negative outlook. Only a significant jump in demand, ideally from China, could do that. As such, US crude will likely consolidate below the 50-DMA.
In the FX, the US dollar eased yesterday as investors priced out a part of the geopolitical risks, while appetite in gold remained intact. The US 2-year yield extended a retreat, as the probability of a 25bp cut from the Fed jumped to 65% in the aftermath of the meeting minutes. Today, the US will release a crowded set of data before the Thanksgiving break. On the menu, the weekly jobless claims, the latest GDP update, durable goods orders and the core PCE index – the Fed’s favourite gauge of inflation. Quickly, the US economy is expected to have grown by around 2.8% in Q3 – slightly down from 3% printed previously but sales are expected to print a strong 3% growth (but we already knew that). Price pressures, however, are expected to have tamed in Q3 – which is good news for the Fed doves and the rate cut expectations. Yet, the core PCE index probably ticked higher to 2.8% in October, from 2.7% printed a month earlier. And that’s not great news for the inflation’s trajectory. Even less so as Trump’s tax cuts and tariffs are expected to give a boost to prices in the coming months. As such, a relatively strong growth number and softening price pressures last quarter will be welcome, but strong sales growth and a potential uptick in core PCE demand caution. I still believe that cutting first and seeing what happens is not the best strategy when the economic data remains strong. But I am not the Fed head. If the inflation data doesn’t surprise to the upside, investors will continue to back another 25bp cut in December and the latter could lead to a downside correction in the US dollar, and a rebound in major counterparts.
Elsewhere, the kiwi rallied against the greenback today following a widely expected 50bp cut from the Reserve Bank of New Zealand (RBNZ). Today’s cut marked the second consecutive 50bp cut, bringing total rate reductions to 125bp in just over three months, making the RBNZ the most aggressive rate cutter of the year. But the RBNZ predicted that the average cash rate falling to 3.83% by the middle of next year, suggesting that the policymakers, there, will move to a more gradual rate-cutting path moving forward. The latter could open the door for dipbuying opportunities after the kiwi dropped to the lowest levels in more than a year against the greenback. For those who are not willing to take the risk of a further dollar appreciation, shorting the euro against kiwi could be an alternative play provided the rising odds for more aggressive European Central Bank (ECB) cuts under Trump.