Sample Category Title
Loonie’s Turbulent Times Have Just Begun
The Canadian dollar collapsed by more than 1.4% against the US dollar after Trump threatened to impose new 25% tariffs on goods from Mexico and Canada and to increase tariffs on China by 10% immediately after taking office.
Following the announcement, USDCAD jumped to 1.4170, a high since 23 April 2020. The context is interesting in this case, as a few days earlier, the price of oil went into negative territory for the first time in history. Previously, the highest price of the pair was recorded in early 2016, when oil fell below $30. So, these were periods of extremely low oil prices compared to current oil prices.
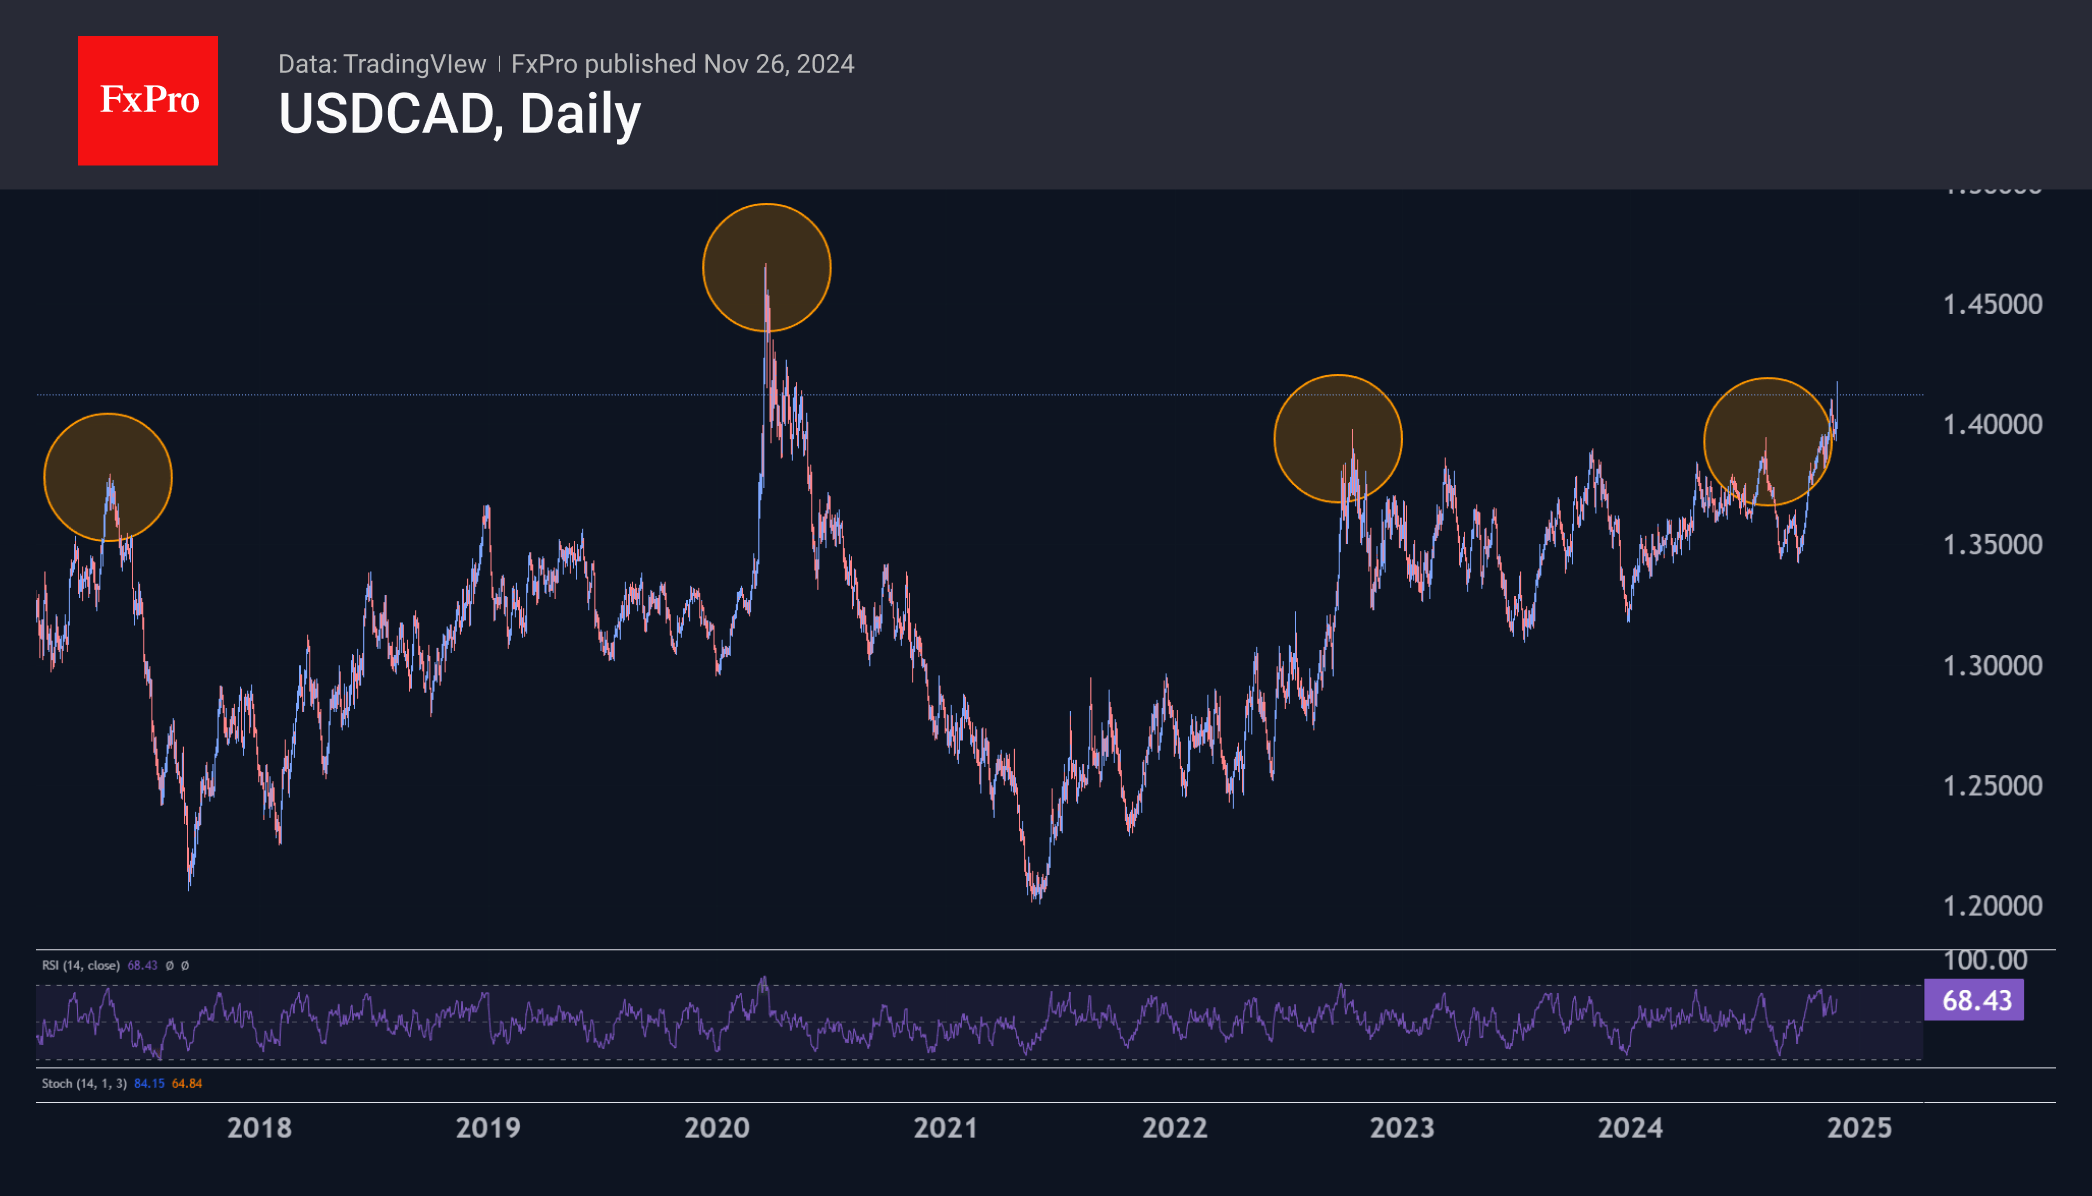
Over the past 20 years, USDCAD has only reached these levels during periods of turbulence, trading above 1.4100 for only a few dozen days cumulatively in the two episodes of 2016 and 2020. However, the phrase “period of turbulence” could well apply to the currency market for much of the Trump presidency, with sudden announcements and outbursts which are then dramatically reversed by periods of warming and de-escalation.
Historically, the Canadian dollar depreciated steadily against the US dollar between 1997 and 2003. This was also due to a period of extremely low energy prices caused by rising supply and the Asian crisis.
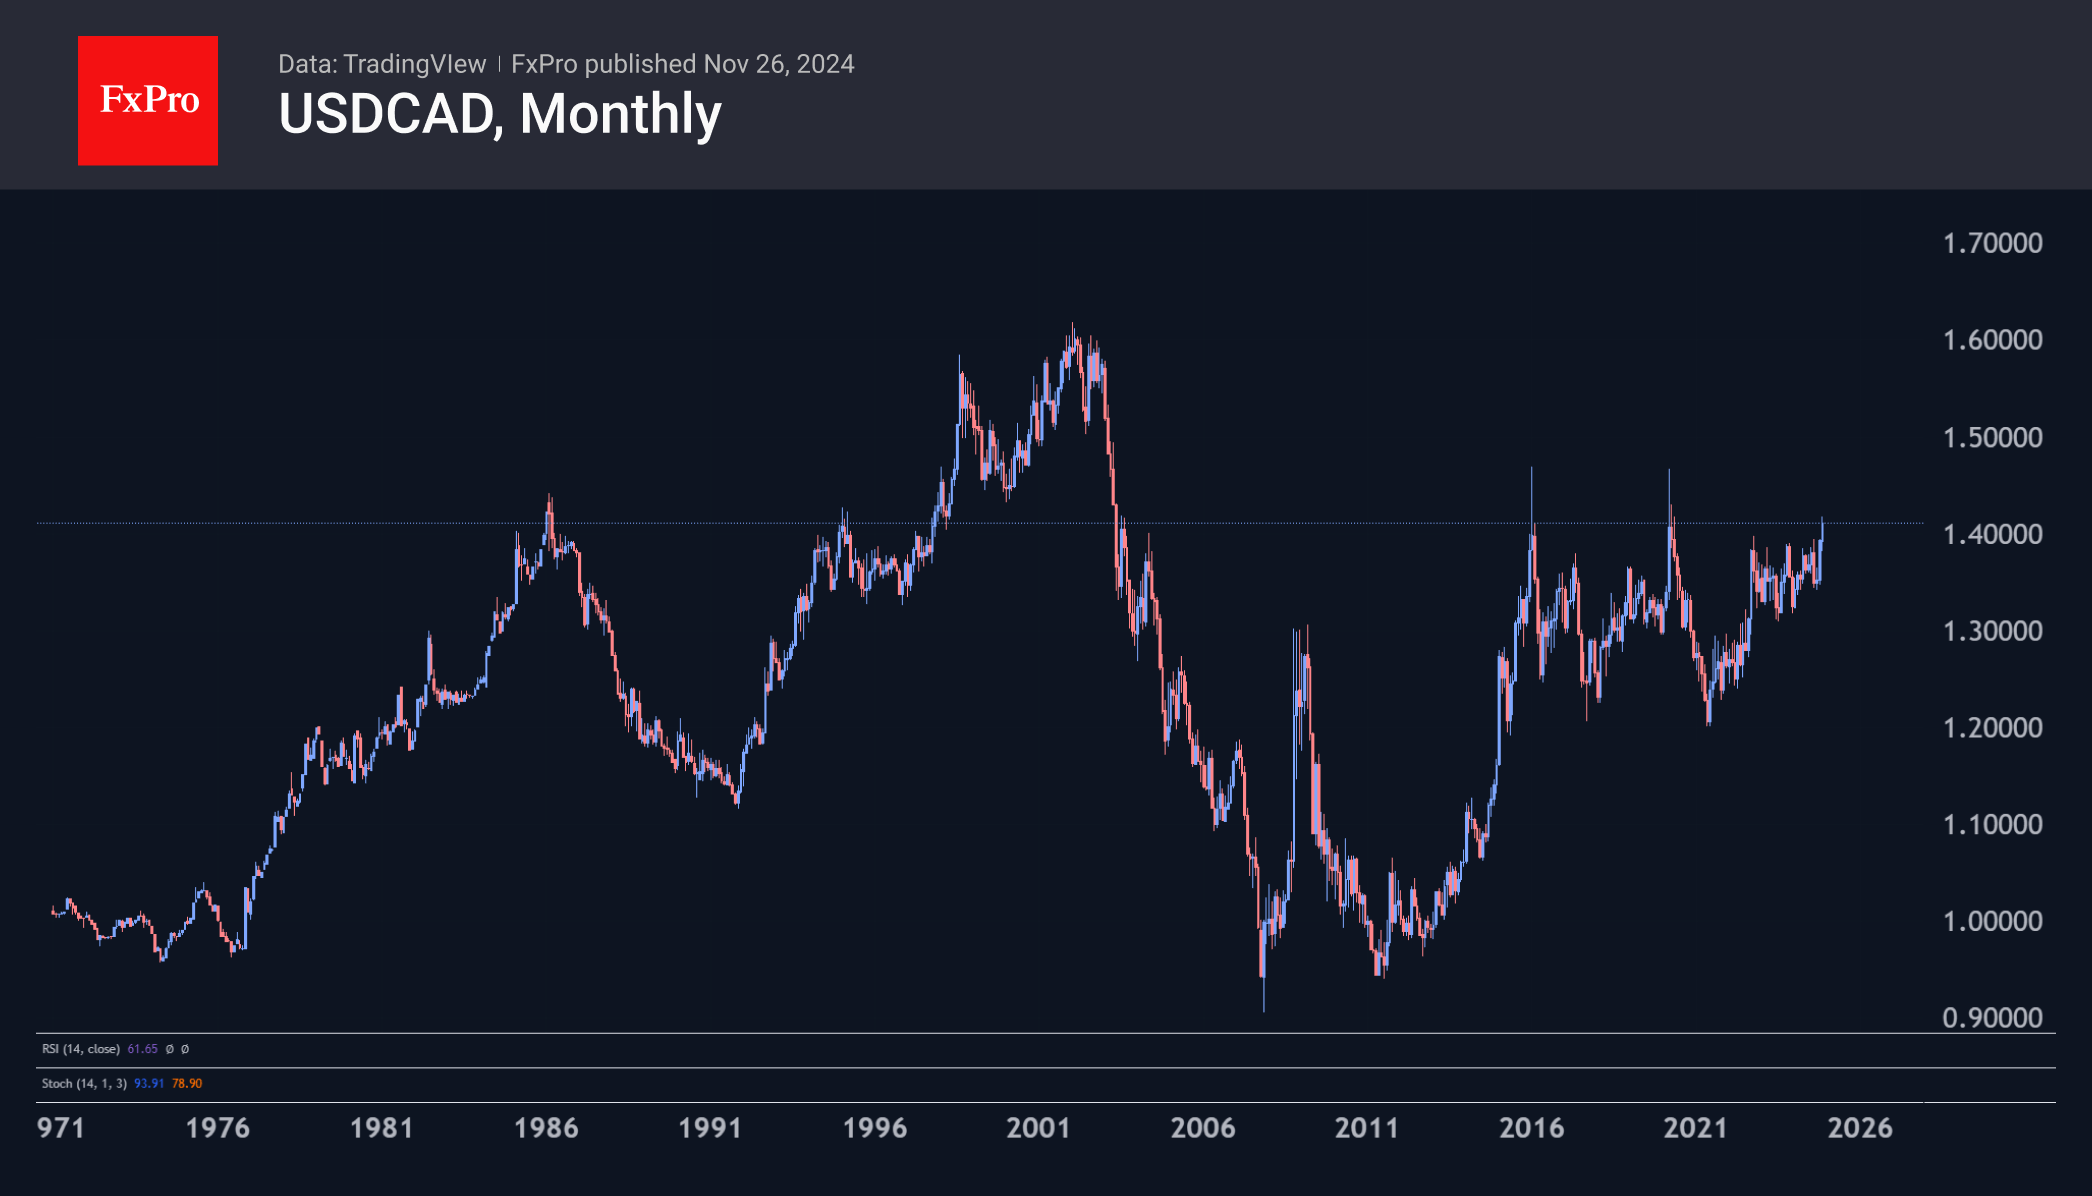
USDCAD has now reached levels above 1.4000, with oil prices much more comfortable. A further fall in ‘liquid gold’ prices could be the anchor that pulls the Canadian Loonie down. However, there is a positive side to this relationship: the Republican Party often supports the interests of companies involved in the production of conventional hydrocarbons.
Investors face a fork in the road here. The first path is to create the conditions for an increase in the price of oil. This could be done by increasing purchases into the Strategic Petroleum Reserve or by lobbying for the interests of US companies abroad through tariffs and sanctions.
The second way is to try to maximise overall profits by increasing production, the so-called “drill, baby, drill” that was so expected from Trump’s policy.
So far, we see more chances of the first scenario unfolding, which could be good news for the Canadian dollar in the long run. In the short term, however, the period of turbulence could continue, suggesting that the best time to open USDCAD shorts is yet to come.
On the daily timeframe, the pair is far from the overbought conditions that reversed the momentum earlier and could well slip into the 1.4500 area and higher before peaking.
AUDCAD Rebounds from Near Key Uptrend Line
- AUDCAD rebounds after consolidating near key uptrend line
- RSI and MACD are suggesting that momentum may be turning positive
- A break above 50-day EMA could confirm more advances
- For the outlook to darken, a dip below 0.9015 may be needed
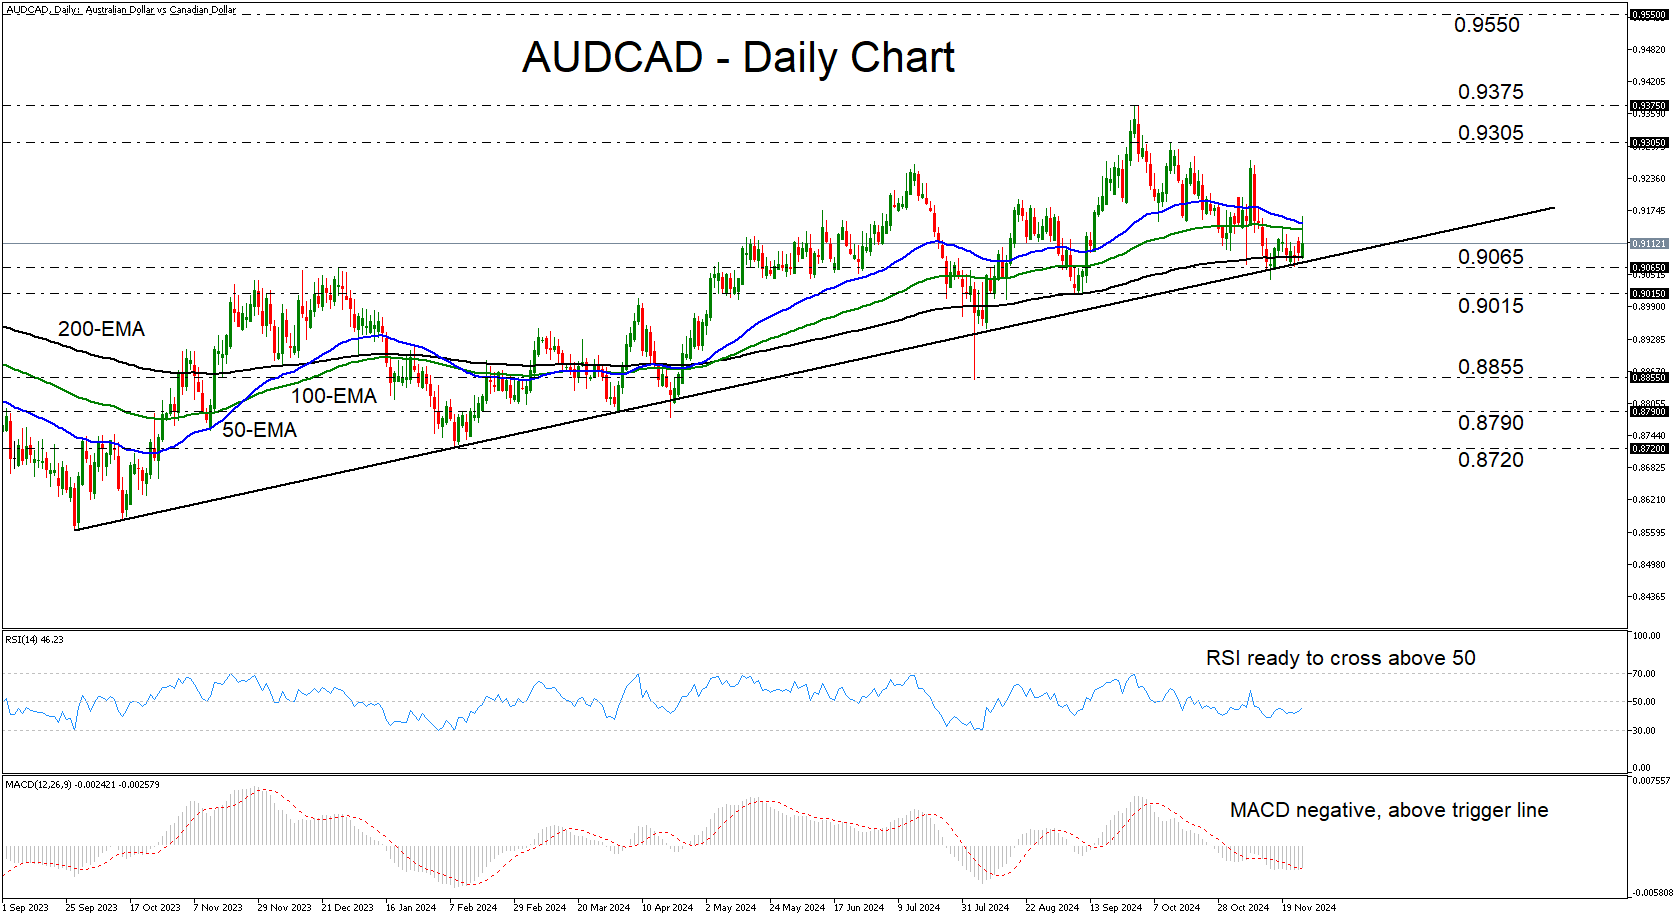
AUDCAD rebounded on Tuesday, after hitting support near the uptrend line drawn from the low of September 27, 2023, and the 200-day exponential moving average (EMA). Although the pair corrected decently after hitting a 21-month high of 0.9375 on September 30, the latest rebound keeps the broader uptrend intact.
The RSI and the MACD support the case for some more advances in the short run. The former has turned up and looks ready to cross above 50, while the latter, although negative, has already crossed above its trigger line.
If the bulls manage to climb above the 50-day EMA, they may feel confident to push the action towards the 0.9305 zone, or the 21-month high of 0.9375. That said, a break higher may be a stronger bullish signal as it would confirm a higher high on the weekly chart. Such a move could pave the way towards the 0.9550 zone, marked as resistance by the high of January 26, 2023.
For the outlook to turn bearish, the price may need to fall below 0.9015. Such a dip would not only solidify the break of the aforementioned uptrend line, but also confirm a lower low. The bears may then be encouraged to dive all the way down to the low of August 5 at 0.8855.
To recap, AUDCAD has been trading above a solid uptrend line since September 2023, and just this week, it rebounded after consolidating for a while near that zone. This keeps the broader outlook cautiously positive.
New Zealand Dollar Eyes RBNZ Rate Announcement
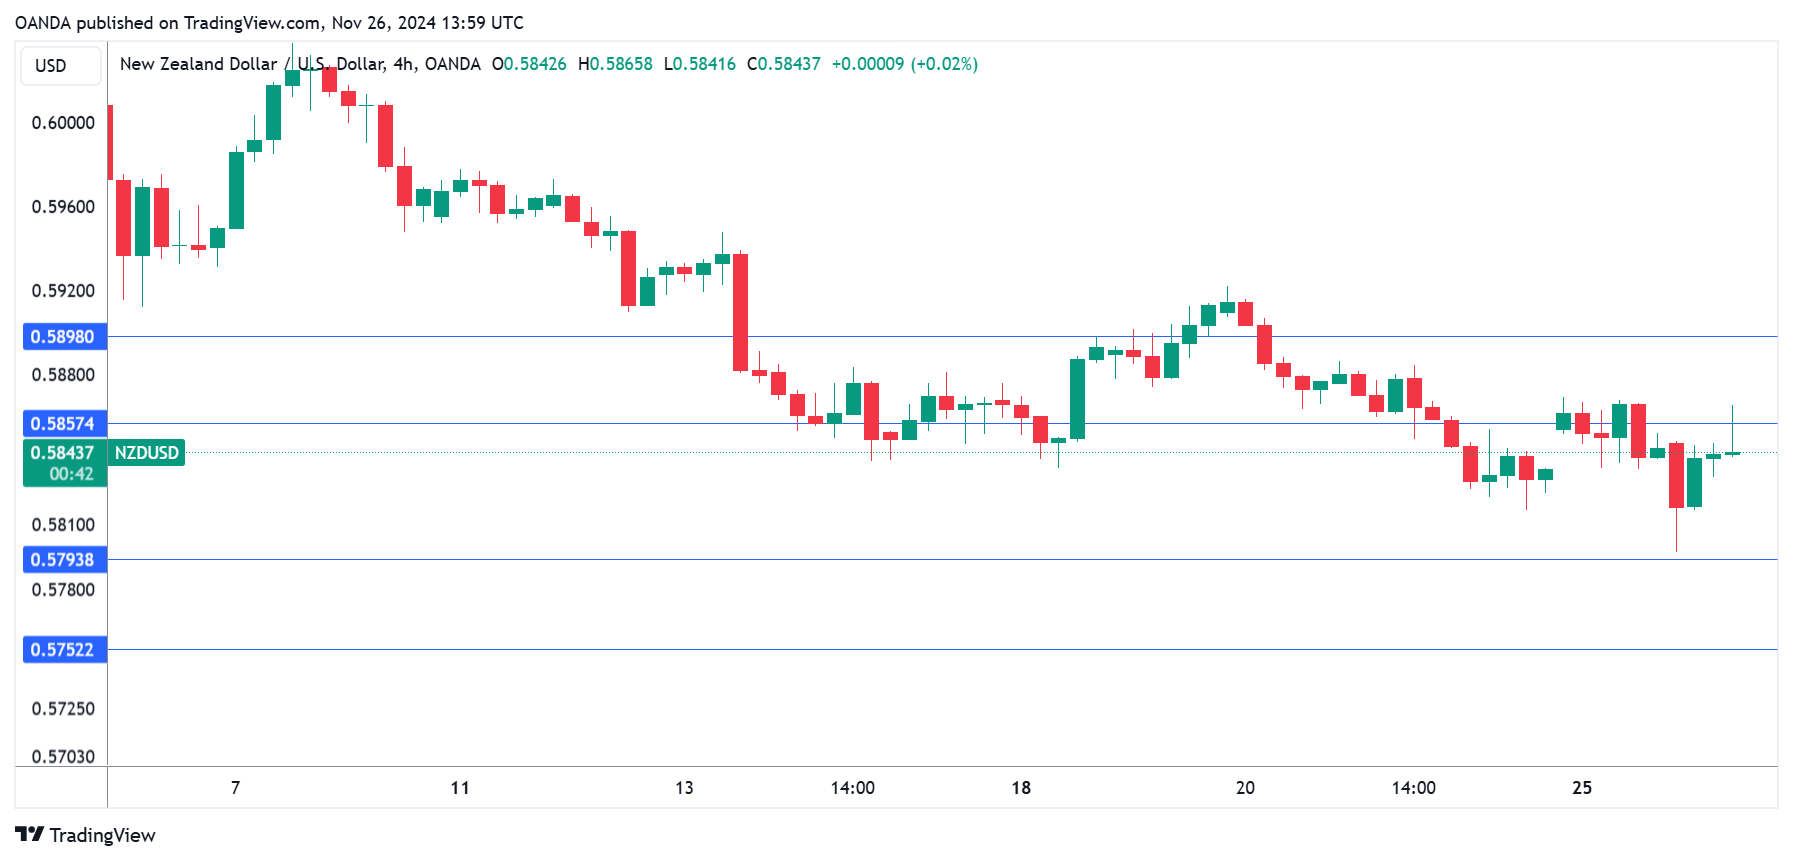
The New Zealand dollar is in positive territory on Tuesday, after a four-day losing streak. In the European session, NZD/USD is trading at 0.5850, up 0.09% on the day. Earlier, the New Zealand dollar fell as low as 0.5797, its lowest level since Nov. 1.
RBNZ expected to slash rates by 50 basis points
The Reserve Bank of New Zealand makes its rate announcement on Wednesday and the markets have priced in a jumbo rate cut of a 50 basis point for a second straight meeting. This would bring the cash rate to 4.25%, its lowest level since November 2022.
The RBNZ has done a good job of lowering inflation, which fell to 2.2% in the second quarter. This is the first time in over three years that inflation is within the target band of between 1 and 3 percent. Still, elevated rates have taken a heavy toll on the economy, as GDP declined 0.2% in the second quarter and likely fell in Q3 as well, which would mark a recession. The central bank’s aggressive rate-cutting is aimed at providing the economy with a much-needed boost.
The New Zealand dollar stands to be the big loser from an oversized rate cut. The currency plunged around 1% after the 50-bp chop in October and we could see another sharp drop on Wednesday if the central bank cuts again by 50 bp.
Will Fed minutes provide clues ahead of December meeting?
The Federal Reserve releases the minutes of the November meeting later today. At the meeting, the Fed lowered rates by 25 basis points. Investors will be looking for insights about what the Fed may have planned for the Dec. 18 meeting. A few weeks ago, a second straight 25-bp cut appeared likely but with the US economy remaining strong, the Fed may opt to pause. Interest-rate future markets are currently pricing in a cut at 59% and a pause at 41%, according to the CME’s Fed Watch.
NZD/USD Technical
- NZD/USD is testing resistance at 0.5857. Above, there is resistance at 0.5898
- There is support at 0.5793 and 0.5752
Sunset Market Commentary
Markets
This morning, (Asian) markets were ‘unsettled’ as US president-elect Trump via his ‘Truth’ social network announced additional tariffs on Canada and Mexico (25%) as he assesses they don’t do enough to stop what he calls the ‘invasion of drugs’ and ‘illegal aliens’ into the US. Also China will face an additional levy of 10% for not doing enough to stem the inflow of drugs and migrants to the US. At first instance, the announcement of these rather unexpected, basically non-economically driven tariffs firmly questioned yesterday’s market hope that the nomination Scott Bessent as US Treasury Secretary could be a harbinger of a more pragmatic approach from the Trump 2.0 administration. In a first reaction US yields and especially the dollar tried to reverse some of yesterday’s setback, but as was the case recently, the Trump trade (higher yields and higher dollar) failed to regain full momentum. US yields currently adds between 1.0/2.0 bps. In an interview on Bloomberg, Fed’s Kashkari indicated that tit-for-tat action on tariffs could be inflationary, but he still saw it reasonable to consider a December rate cut. Europe wasn’t directly affected by the Trump tariffs but he still has plenty of time to also reshape its trading relationship/practices with the EU. At least for now, further declines in EMU yields were limited. German currently show changes of less than 1 bp across the curve. European equities show most declines (EuroStoxx 50 -0.35%). US indices open mixed.
After finishing this report, the US consumer confidence (Conference Board) and the Minutes of the previous Fed meeting will be published. The US Treasury will sell $70 bln 5-y Notes.
On FX markets, the dollar failed to hold a brief ‘Trump-related’ spike higher at the opening. DYX trades little changed in a daily perspective (106.9) and this is also the case for EUR/USD (1.0495). The yen again outperforms with USD/JPY trading near 153.5 (from 154.23). The Canadian Loonie was hit the hardest by the Trump tariff announcement. USD/CAD is trading north of 1.41; at levels not seen since spring 2020. The Mexican peso (MXN) is also facing an uphill battle, but USD/MXN (20.583) for now holds just below the TYD top (20.8 area).
News & Views
Deputy governor of Sweden’s Riksbank Anna Seim touched on the topic of the neutral rate during a central bank seminar. Despite the inherent uncertainties associated with this theoretical construct, central banks use it as a gauge to help determine whether policy settings are either stimulative or restrictive. An update of the estimated level was due since the last one dated from 2017. Based on international studies, other central bank studies, pricing and surveys from financial markets and model-guesstimates, Seim concluded that “The long-term neutral interest rate, and thus the long-term normal policy rate, is probably between 1.5 and 3 per cent.” This is one percentage point lower than the 2017 range, meaning the Riksbank assumes it to remain near historically low levels. Seim’s message contrasts with the likes of the Bank of Canada, the Federal Reserve and the central bank of New Zealand. All of them raised their estimates. The deputy governor holds the view “that there is little to indicate that we are in a completely new world where the neutral interest rate has risen sharply, or will do so in the near future.” The implications for monetary policy are that policy rates around zero or even negative again cannot be ruled out in cases when inflation is far below target. Seim’s analysis paints a bleaker longer-term outlook for the Swedish krona as it offers the central quite some leeway to lower rates further from the current 2.75%. Money markets discount <100 bps of rate cuts over the next four meetings.
Hungary’s GKI business confidence index fell by more than 2 points in November to a 17-month low of -11.3. The outlook deteriorated in all four sectors surveyed, led by industry and construction. Trade remained the most pessimistic, services sector the least. The predictability of the business environment deteriorated to a 2-yr low. Price increase plans in the business sector increased noticeably compared to the previous month, rising to an 11-month high. The simultaneously published consumer confidence index decreased to a 12-month low on sharply increased dissatisfaction from households with their financial situation over the past 12 months. Views for the year ahead deteriorated somewhat, potentially on a significant uptick in inflation expectations. Perceptions of Hungary’s economy 12 months ahead were about the same. The economic sentiment indicator, which combines business and consumer confidence, dropped to the weakest level since October last year. A deteriorating (business) eco outlook and price rising expectations paints a stagflationary picture which may have originated from the recent sharp HUF depreciation. EUR/HUF today jumped to 411, matching the recent November 2-yr highs.
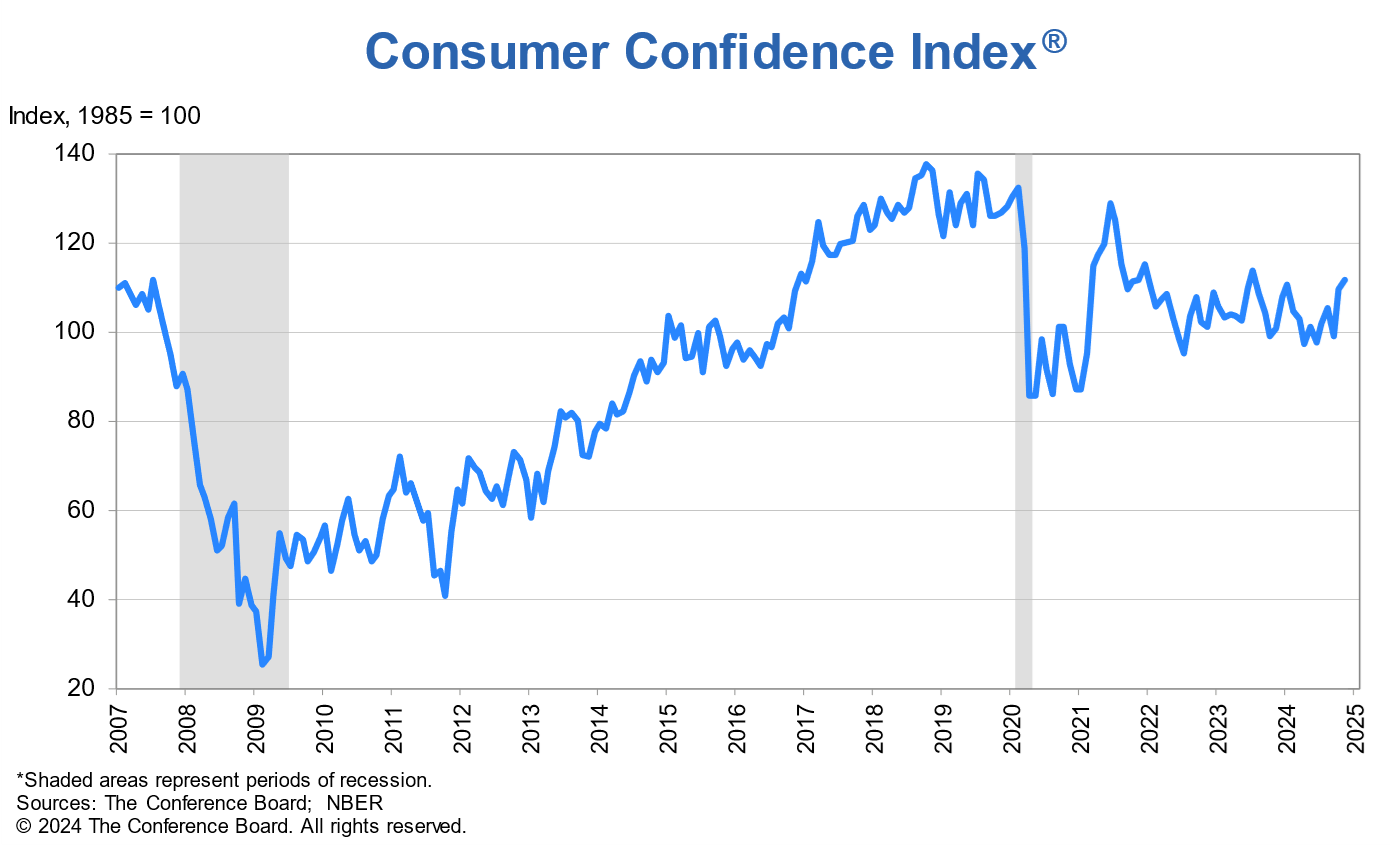
US consumer confidence rises to 111.7, driven by labor market optimism
US Conference Board Consumer Confidence Index increased to 111.7 in November, up from 109.6 in October, though slightly below the expected 112.0. Present Situation Index, which reflects consumers’ views on current economic conditions, saw a significant rise of 4.8 points to 140.9. Expectations Index, measuring consumer outlook for the next six months, inched up by 0.4 points to 92.3.
Dana M. Peterson, Chief Economist at The Conference Board, noted that “consumer confidence continued to improve in November and reached the top of the range that has prevailed over the past two years.”
The improvement was primarily driven by stronger consumer sentiment regarding the labor market, with future job availability optimism reaching its highest level in nearly three years.
However, expectations for future business conditions remained steady, and consumers were slightly less optimistic about future income prospects.
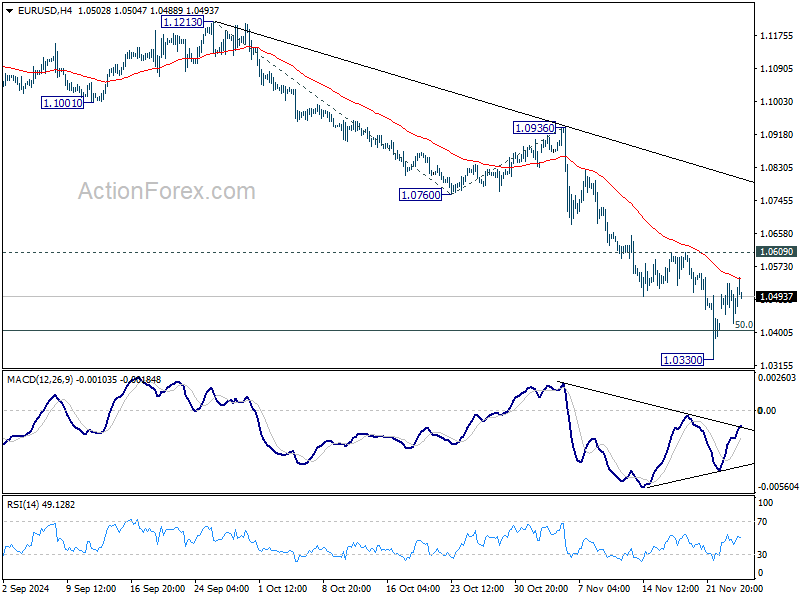
EUR/USD Mid-Day Outlook
Daily Pivots: (S1) 1.0453; (P) 1.0492; (R1) 1.0534; More...
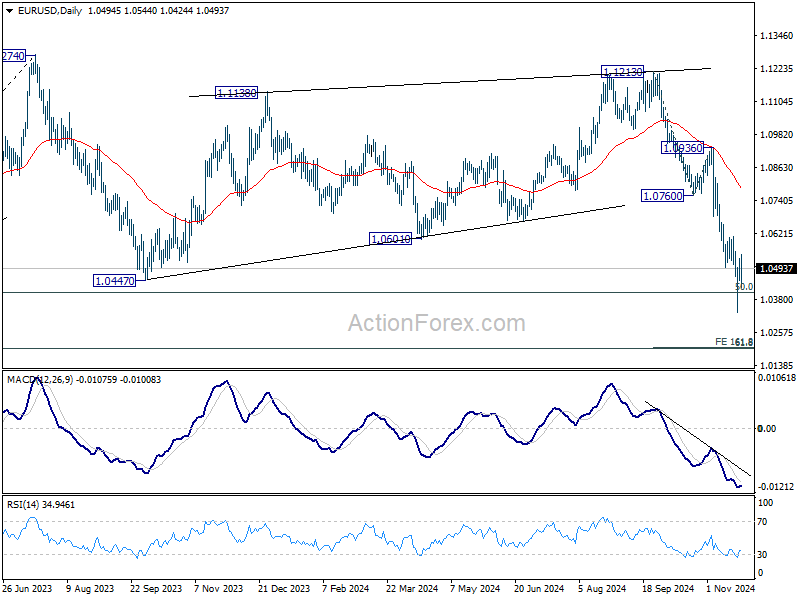
Intraday bias in EUR/USD remains neutral and outlook is unchanged. More consolidations could be seen above 1.0330 temporary low but further decline is expected as long as 1.0609 resistance holds. On the downside, sustained trading below 1.0404 key fibonacci level will carry larger bearish implication and target next level at 161.8% projection of 1.1213 to 1.0760 from 1.0936 at 1.0203. However, firm break of 1.0609 will confirm short term bottoming, and turn bias back to the upside for 1.0760 support turned resistance first.
In the bigger picture, immediate focus is now on 50% retracement of 0.9534 (2022 low) to 1.1274 at 1.0404. Strong rebound from this level will keep price actions from 1.1273 (2023 high) as a medium term consolidation pattern only. However, sustained break of 1.0404 will raise the chance that whole up trend from 0.9534 has reversed. That would pave the way to 61.8% retracement at 1.0199 first. Firm break there will target 0.9534 low again.
GBP/USD Mid-Day Outlook
Daily Pivots: (S1) 1.2536; (P) 1.2575; (R1) 1.2608; More...
Intraday bias in GBP/USD remains neutral and more consolidations would be seen above 1.2486. Further decline is expected as long as 1.2713 resistance holds. On the downside, break of 1.2486 will resume the fall from 1.3433 to 1.2298 cluster support zone.
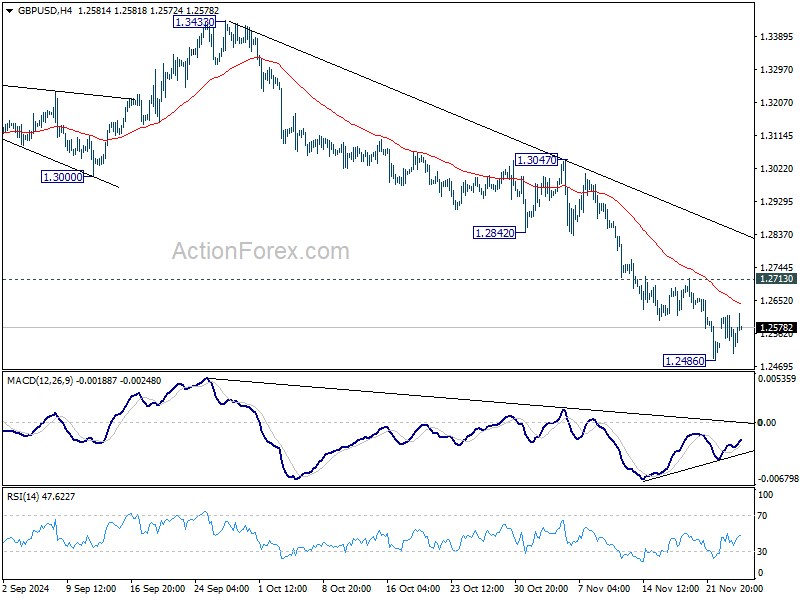
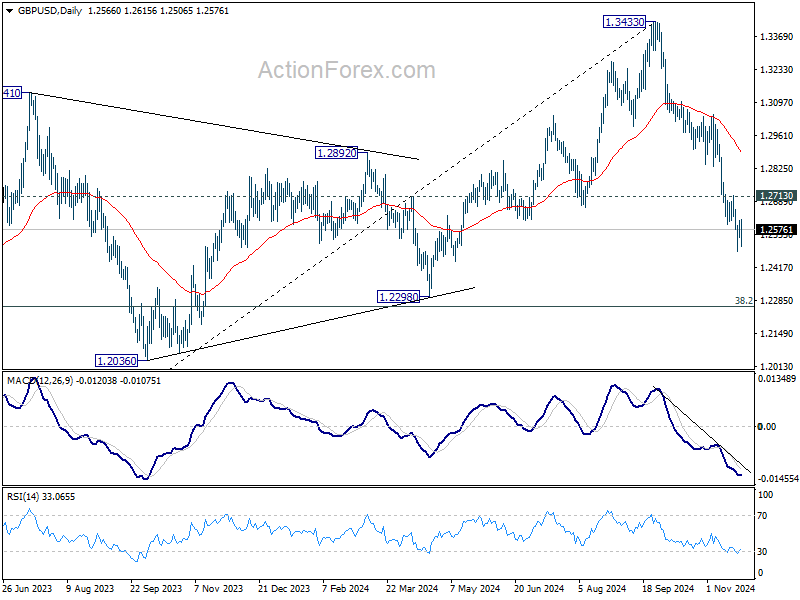
In the bigger picture, a medium term top should be in place at 1.3433, and price actions from there are correcting whole up trend from 1.0351 (2022 low). Deeper decline is now expected as long as 55 D EMA (now at 1.2893) holds, to 38.2% retracement of 1.0351 to 1.3433 at 1.2256, which is close to 1.2298 structural support. Strong support should be seen there to bring rebound.
USD/CHF Mid-Day Outlook
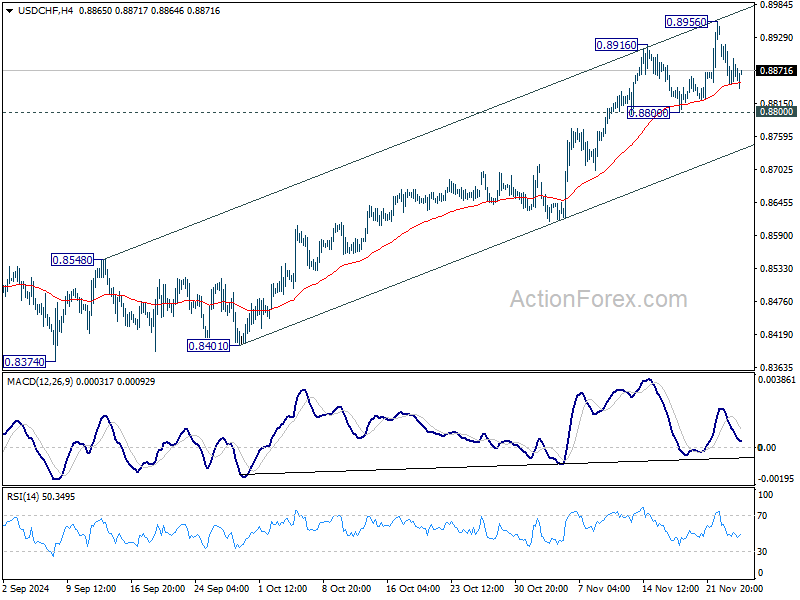
Daily Pivots: (S1) 0.8835; (P) 0.8877; (R1) 0.8905; More…
Intraday bias in USD/CHF stays neutral and more consolidations would be seen below 0.8956. Outlook will continue to stay bullish as long as 0.8800 support holds, in case of retreat. Break of 0.8956 will resume the rally from 0.8374, and target 0.9223 key resistance next.
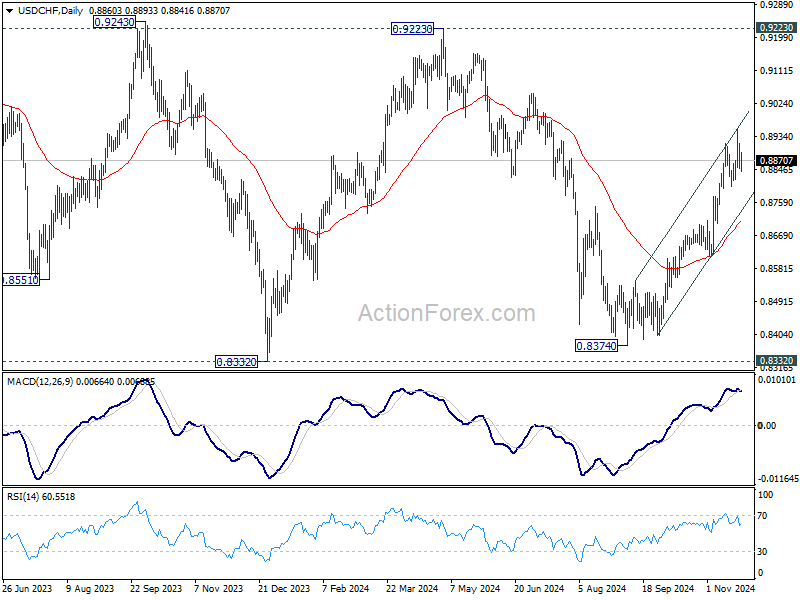
In the bigger picture, price actions from 0.8332 (2023 low) are currently seen as a medium term corrective pattern. Rise from 0.8374 is seen as the third leg. Overall outlook will continue to stay bearish as long as 0.9223 resistance holds. Break of 0.8332 low is in favor at a later stage when the consolidation completes.
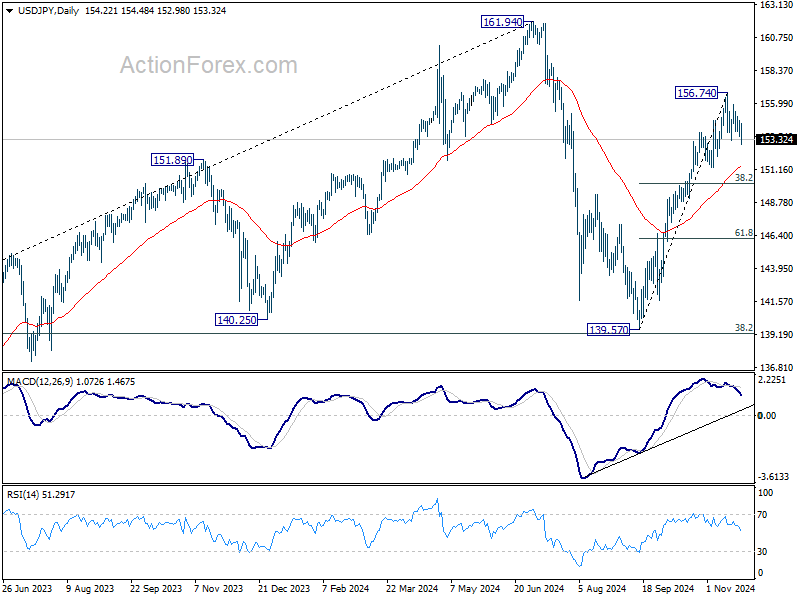
USD/JPY Mid-Day Outlook
Daily Pivots: (S1) 153.58; (P) 154.15; (R1) 154.75; More...
USD/JPY's break of 153.27 minor support suggests that correction from 156.74 is extending lower. Intraday bias is back on the downside for 38.2% retracement of 139.57 to 156.74 at 150.18. For now, risk will stay on the downside as long as 156.74 resistance holds, in case of recovery.
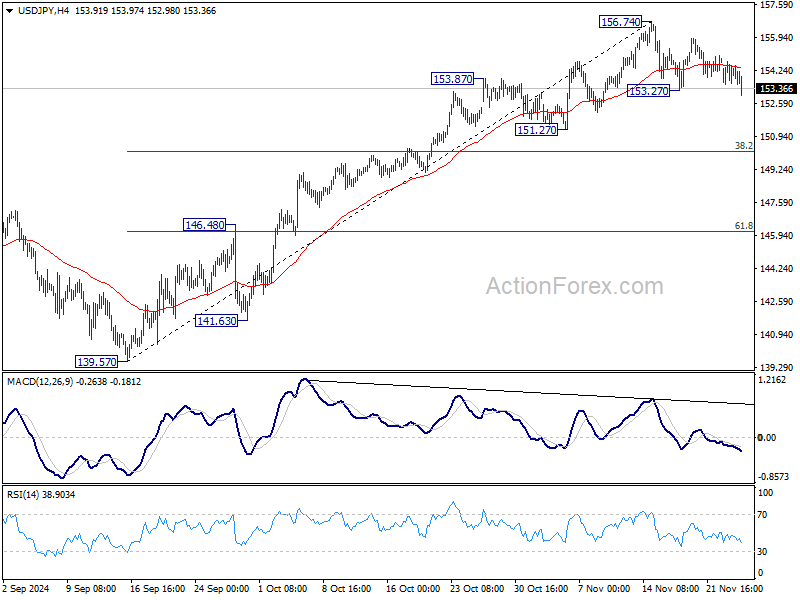
In the bigger picture, price actions from 161.94 are seen as a corrective pattern to rise from 102.58 (2021 low). The range of medium term consolidation should be set between 38.2% retracement of 102.58 to 161.94 at 139.26 and 161.94. Nevertheless, sustained break of 139.26 would open up deeper medium term decline to 61.8% retracement at 125.25.