
Sample Category Title
GBP/JPY Daily Outlook
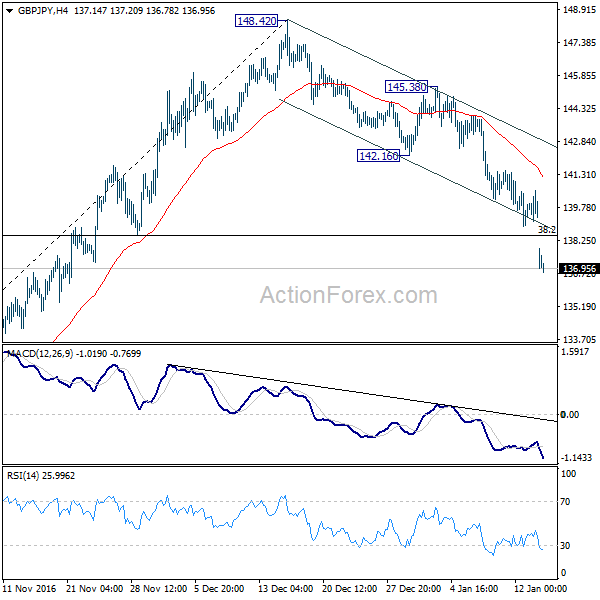
Daily Pivots: (S1) 138.89; (P) 139.73; (R1) 140.39; More...
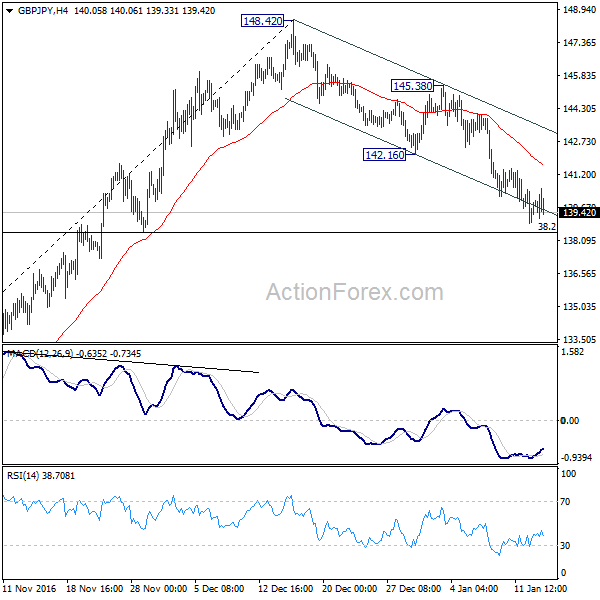
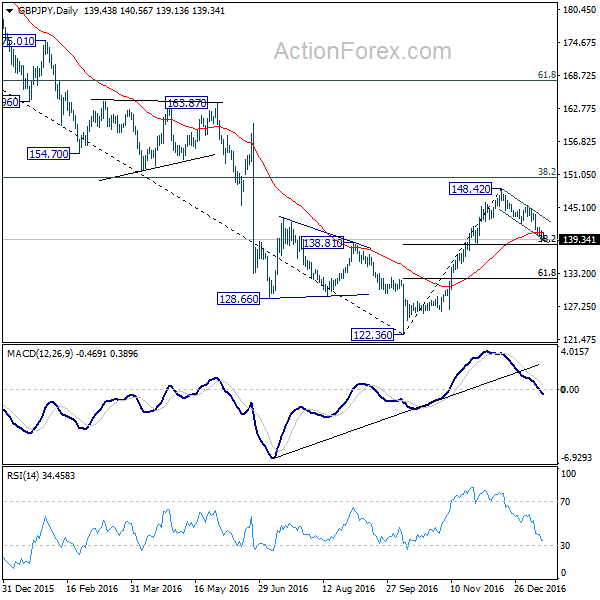
GBP/JPY's decline from 148.20 accelerated by breaking the channel line decisively. 38.2% retracement of 122.36 to 148.42 at 138.46 was also taken out firmly. The development suggests that whole corrective rise from 122.36 has completed at 148.42. Intraday bias stays on the downside for 61.8% retracement at 132.31 and below. On the upside, break of 142.16 support turned resistance is needed to indicate completion of such decline. Otherwise, outlook will stay bearish in case of recovery.
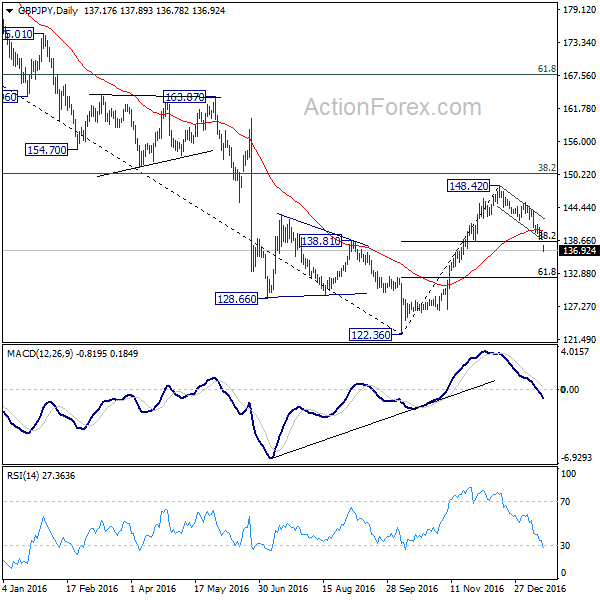
In the bigger picture, price actions from 122.36 medium term bottom are seen as developing into a corrective pattern. Upside is so far limited by 38.2% retracement of 195.86 to 122.36 at 150.4 for setting the medium term range. At this point, we don't expect a break of 122.36 in near term and the corrective pattern would extend for a while.
Subscribe to our daily and mid-day newsletter to get this report delivered to your mail box
FX 2017: JPY – Yield Curve Control To Keep Yen Weak
Recent correction does not change our relatively positive outlook over USDJPY this year. Donald Trump's victory at the US presidential election last November triggered sharp rally in interest rates and USD, facilitated by unwinding of USD shorts and opening of USD longs. Despite a pullback after soaring to a recent high 118.66 in mid-December, reflation trades, hinging on the bets that Trump's administration would drive quicker growth and inflation, remain in play and should push USDJPY higher after consolidation. Yield curve targeting announced in September indicates that BOJ would strive to keep the 10-year JGB yields close to its target by buying sufficient amounts of bonds. This, together with the sharp rise in US yields, helps accelerate divergence of Japanese yields from those in the US, pressuring Japanese yen. We do not feel surprised if prices corrects to 110-112 in 1Q17. Rather, it offers a buying opportunity for a resumption of recent rally. Risk to USDJPY's strength is slower-than-expected and/or milder-than-expected implementation of Trump's pro-growth policy.
BOJ's Shift to Yield Curve Control. In September, BOJ announced a policy called “QQE with Yield Curve Control”, effectively shifting its monetary stimulus from money supply expansion to interest rate control. As mentioned in the accompanying statement, the new policy framework consists of two major components, namely, 'yield curve control' in which the Bank will control short-term and long-term interest rates, and 'inflation-overshooting commitment' in which the Bank commits itself to expanding the monetary base until the year-on-year rate of increase in the observed consumer price index (CPI) exceeds the price stability target of 2% and stays above the target in a stable manner. For “yield curve control”, BOJ noted that it would purchase JGBs so that 10-year JGB yields would remain around 0%. The purchases would be conducted more or less in line with the current pace, an annual pace of increase in the amount outstanding of its JGB holdings at about 80 trillion yen. BOJ also noted that JGBs with a wide range of maturities would continue to be eligible for purchase, while the guideline for average remaining maturity of the Bank's JGB purchases will be abolished. For short term rate, BOJ would apply a -0.1% rate to the Policy-Rate Balances in current accounts held by financial institutions at BOJ. In a nutshell, BOJ would strive keep its 10-year government bond yield at 0%, in contrast with usual central bank practice of controlling only short-term rates.
The chart below shows that USDJPY has been highly correlated with US-Japan 10-year yield spreads, over the past months. Hopes that Trump's pro-growth policy would drive higher economic expansion and inflation, and facilitate a tighter monetary policy stance, have lifted Treasury yields and USD of late. With the market shy of pricing in three Fed funds rate hikes (as signaled in the December dot plot) this year, there is room for USD to rally further should incoming macroeconomic data eventually convince traders that more rate hikes are possible. Fed's hawkish and BOJ's determination to keep long-term yields near 0% reveal monetary policy divergence and help widening yield differential, a factor facilitating the rise of USDJPY
Oil Price and Inflation Outlook:
Energy price contributes to about 7% of US headline inflation. Yet, the correlation of the two can be as higher as 0.96, say, in October. The synchronized decline in USDJPY and crude oil prices over the past weeks is not coincidental, but driven by diminished inflation expectations amidst falling oil prices. If crude oil prices manage to extend gains as driven by tightening of global demand/supply fundamentals this year, inflation expectations, and therefore yields, should climb higher, and vice versa.
Japan's inflation expectations have remained subdued. BOJ's December survey shows that only 64.7% of the respondents forecast consumer price to rising this year. This marks a drop from 65.1 in the previous quarter and the lowest since 4Q12. As noted in the December monetary statement, BOJ acknowledged that the year-on-year CPI (CPI, all items less fresh food) has been “slightly negative” and that “inflation expectations have remained in a weakening phase”. The central bank continued to expect inflation to increase towards its 2% target eventually. While BOJ upgraded its economic assessment, the Cabinet Office released the upgraded estimates in December. It now expects real GDP to grow +1.5% in the next fiscal year starting April 1, up from +1.2% previously. Inflation would was revised lower to +1.1% from +1.4% previously. The Cabinet Office also unveiled that the government's initial budget for next year would increase to 97.5 trillion yen. Weakness in Japanese yen would raise import price while higher oil price might help lift inflation, we expect to stay far below BOJ's +2% target. This suggests that BOJ would at least maintain the existing stimulus measures, i.e. keeping interest rates, both long term and short term, at exceptionally low levels.
Dollar Down But Not Out Yet after Selloff, Trump Inauguration Key
Dollar ended the week broadly lower, except versus Sterling, after US president-elect Donald Trump disappointed the markets by not giving any details on his policies during the first post election press conference. Dollar index reached as low as 100.72 before recovering to close at 101.18. Meanwhile, the greenback also took out key near term support level against Euro, Yen and Canadian Dollar, which carries some bearish implications. However, treasury yields staged a strong rebound on Friday, which could provide some relieves to Dollar bullish. 10 year yield closed at 2.380, after dipping to as low as 2.309, comparing to prior week's close at 2.418. Stocks were also resilient with NASDAQ closing a fresh record of 5574.12. DJIA stayed in tight range of around 200 pts. below 20000 handle. There are still prospects for the greenback to strike back is Trump delivers in his inauguration on January 20.
Technically, Dollar index's correction from 103.82 extended lower last week and breached 55 day EMA (now at 101.04), and 38.2% retracement of 95.88 to 103.82 at 100.79. Such decline is still seen as a near term corrective pull back only. And hence, strong support should be seen at 100.79 fibonacci level and bring rebound. A break above 102.95 resistance will turn focus back to 103.82. However, considering bearish divergence condition in daily MACD, sustained break of 100.79 will argue that whole rise from 91.91 is also finished . And in that case, deeper fall should be seen to 99.43 support and below.
10 year yield seems to be losing some downside momentum ahead of 55 day EMA (now at 2.281). Immediate focus will be on 2.432 minor resistance this week. Break there would possibly bring retest of 2.621 resistance. At this point, we don't expect an upside breakout yet and more consolidation would be seen. Meanwhile, below 55 day EMA will likely extend the correction lower to 38.2% retracement of 1.336 to 2.621 at 2.130.
S&P 500 lost much momentum as it faces resistance from upper channel line. Nonetheless, SPX is holding well above 2233.62 key near term support level. Hence, the rise fro 2083.79 is still intact. Such rise is still expected to continue to next medium term projection level at 61.8% projection of 1074.77 to 2134.71 from 1810.10 at 2465.14. But a break of 2233.62 will bring deeper fall to lower channel line (now at 2128).
Hence to conclude, which the greenback was down, it isn't out yet. Resilience in stocks and yields would provide support to Dollar in general. But Dollar's fate will heavily depend on whether Trump would turn his words into actions. Regarding trading strategies, our positives were both stopped by the unexpected weakness in Dollar. We will keeps our hands off this week and see whether the greenback is in genuine trend reversal, or it's just a blip.
EUR/USD Weekly Outlook
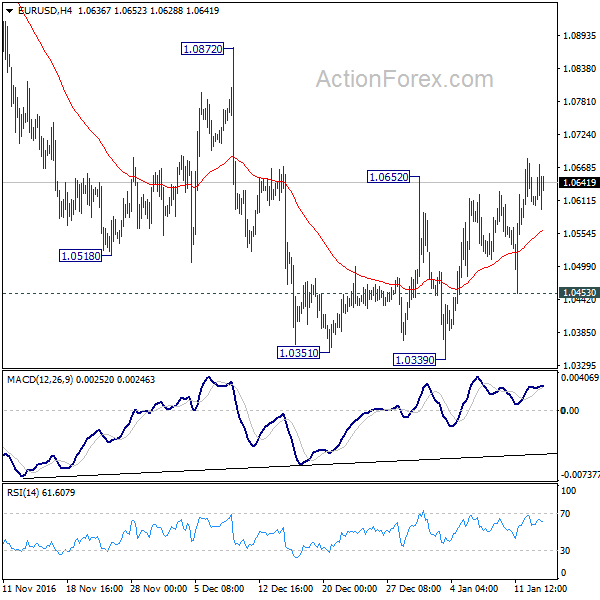
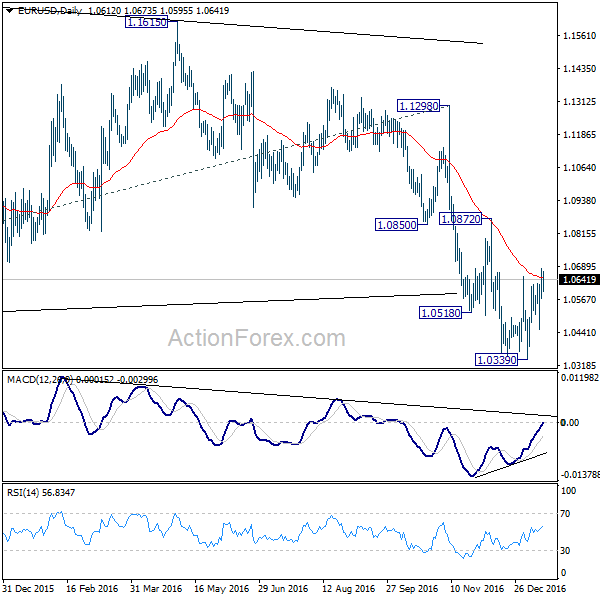
EUR/USD's rebound from 1.0339 extended higher last week. Break of 1.0652 resistance indicates bottoming. Initial bias stays mildly on the upside this week for 1.0872 resistance and possibly above. On the downside, below 1.0453 minor support will turn bias back to the downside for 1.0339 support. Break there will extend the larger down trend towards parity.
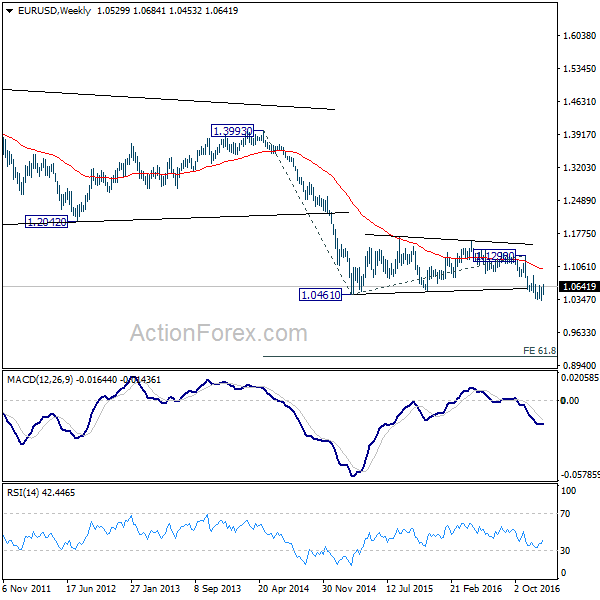
In the bigger picture, whole down trend from 1.6039 (2008 high) is in progress. Such down trend is expected to extend to 61.8% projection of 1.3993 to 1.0461 from 1.1298 at 0.9115. On the upside, break of 1.1298 resistance is needed to confirm medium term bottoming. Otherwise, outlook will stay bearish in case of rebound.
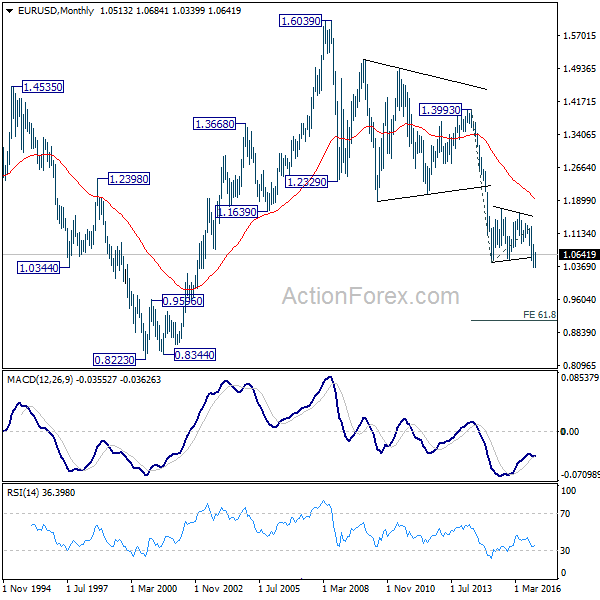
In the long term picture, the down trend from 1.6039 (2008 high) is still in progress and there is no clear sign of completion. We'd expect more downside towards 0.8223 (2000 low) as long as 1.1298 resistance holds.
Subscribe to our daily and mid-day newsletter to get this report delivered to your mail box
EUR/USD Weekly Outlook
EUR/USD's rebound from 1.0339 extended higher last week. Break of 1.0652 resistance indicates bottoming. Initial bias stays mildly on the upside this week for 1.0872 resistance and possibly above. On the downside, below 1.0453 minor support will turn bias back to the downside for 1.0339 support. Break there will extend the larger down trend towards parity.
In the bigger picture, whole down trend from 1.6039 (2008 high) is in progress. Such down trend is expected to extend to 61.8% projection of 1.3993 to 1.0461 from 1.1298 at 0.9115. On the upside, break of 1.1298 resistance is needed to confirm medium term bottoming. Otherwise, outlook will stay bearish in case of rebound.
In the long term picture, the down trend from 1.6039 (2008 high) is still in progress and there is no clear sign of completion. We'd expect more downside towards 0.8223 (2000 low) as long as 1.1298 resistance holds.
Subscribe to our daily and mid-day newsletter to get this report delivered to your mail box
USD/JPY Weekly Outlook
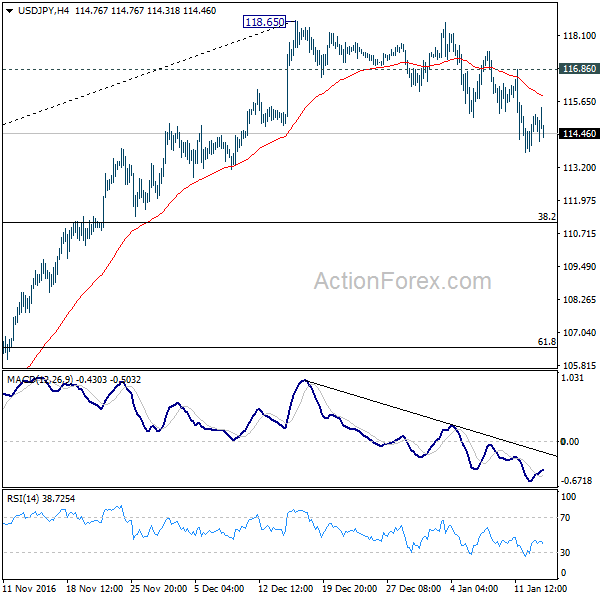
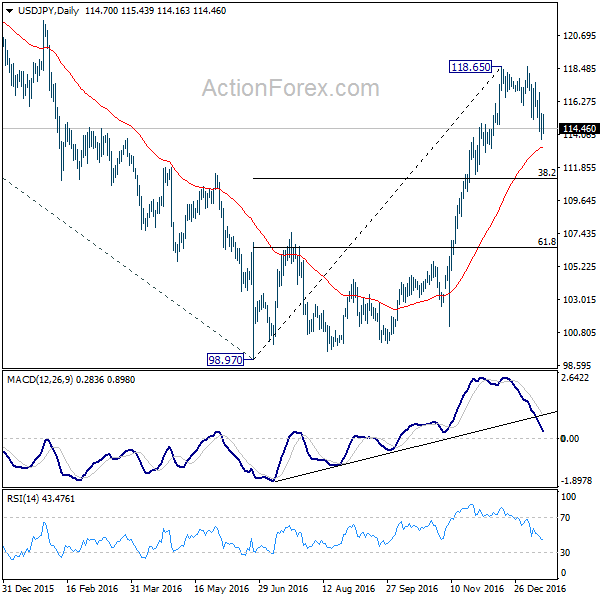
USD/JPY's fall last week confirmed topping at 118.65. Price actions from there is expected to develop into a corrective pattern. Deeper fall is expected as long as 116.86 resistance holds to 38.2% retracement of 98.97 to 118.65 at 111.13. At this point, we'd expect strong support from there to contain downside and bring rebound. Above 116.86 minor resistance will turn bias to the upside for 118.65 high. However, sustained break of 111.13 will argue that whole rise from 98.97 has completed and bring deeper fall to 61.8% retracement at 106.48 and below.
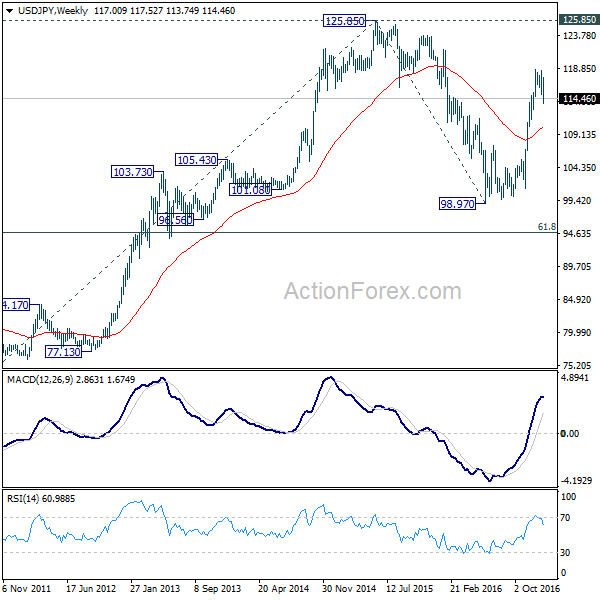
In the bigger picture, price actions from 125.85 high are seen as a corrective pattern. The impulsive structure of the rise from 98.97 suggests that the correction is completed and larger up trend is resuming. Decisive break of 125.85 will confirm and target 61.8% projection of 75.56 to 125.85 from 98.97 at 130.04 and then 135.20 long term resistance. Rejection from 125.85 and below will extend the consolidation with another falling leg before up trend resumption.
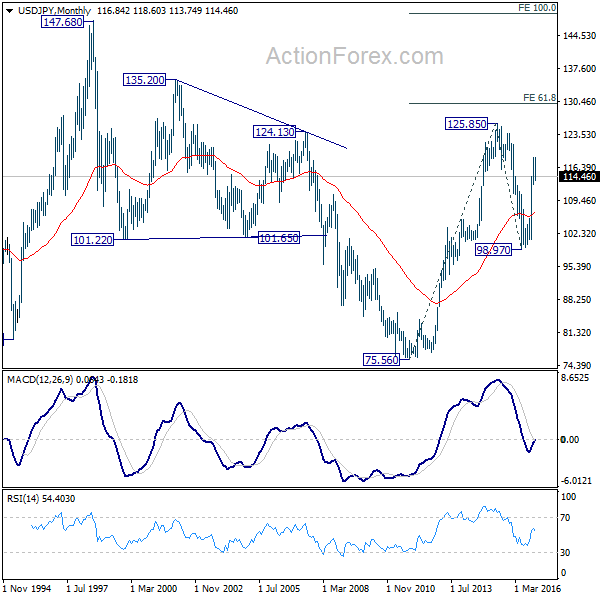
In the long term picture, the rise from 75.56 long term bottom to 125.85 medium term top is viewed as an impulsive move. Price actions from 125.85 are seen as a corrective move which could still extend. But, up trend from 75.56 is expected to resume at a later stage for above 135.20/147.68 resistance zone.
Subscribe to our daily and mid-day newsletter to get this report delivered to your mail box
GBP/USD Weekly Outlook
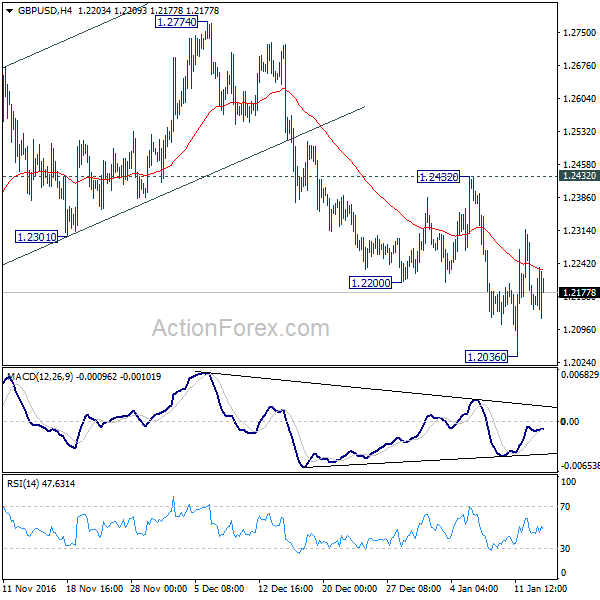
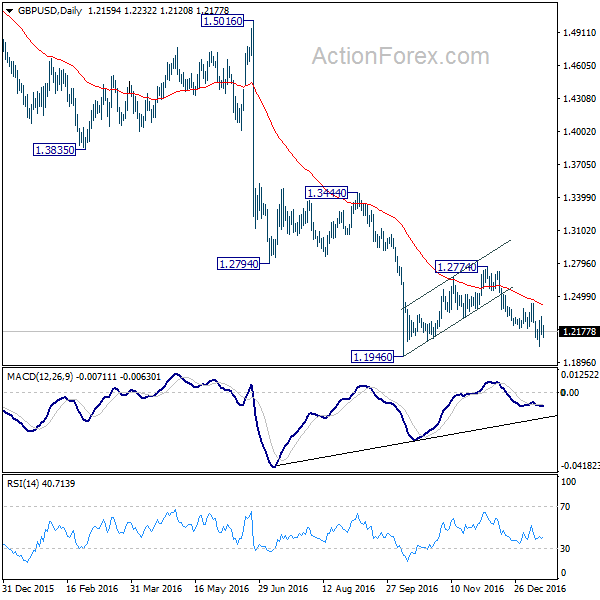
GBP/USD dipped to as low as 1.2036 last week but recovered since then. Initial bias stays neutral this week first. Deeper fall is still expected as long as 1.2432 resistance holds. Below 1.2036 will target a test on 1.1946 low. Decisive break there will confirm our bearish view and resume the larger down trend. However, break of 1.2432 will suggest that consolidation pattern from 1.1946 is extending with another rise.
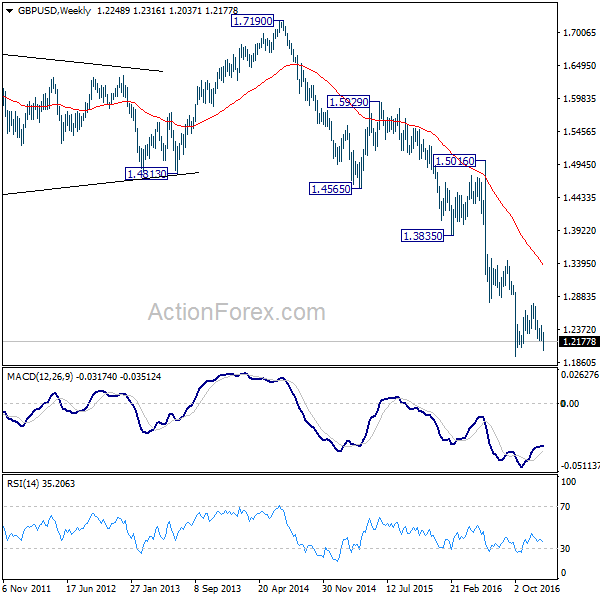
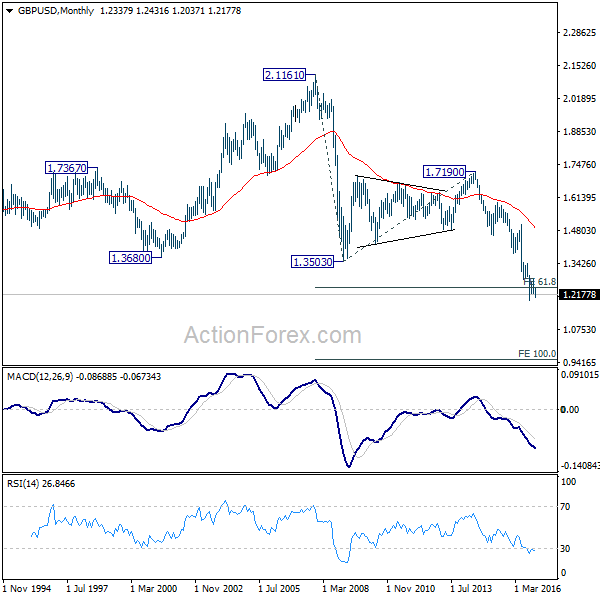
In the bigger picture, fall from 1.7190 is seen as part of the down trend from 2.1161. There is no sign of medium term bottoming yet. Sustained trading below 61.8% projection of 2.1161 to 1.3503 from 1.7190 at 1.2457 will target 100% projection at 0.9532. Overall, break of 1.3444 resistance is needed to confirm medium term bottoming. Otherwise, outlook will remain bearish.
In the longer term picture, no change in the view that down trend from 2.1161 is still in progress. Current momentum suggests that the down trend will go deeper than originally expected.
Subscribe to our daily and mid-day newsletter to get this report delivered to your mail box
USD/CHF Weekly Outlook
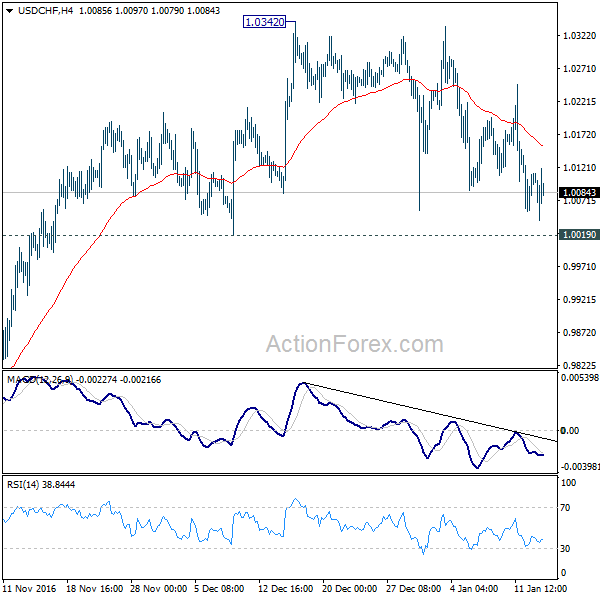
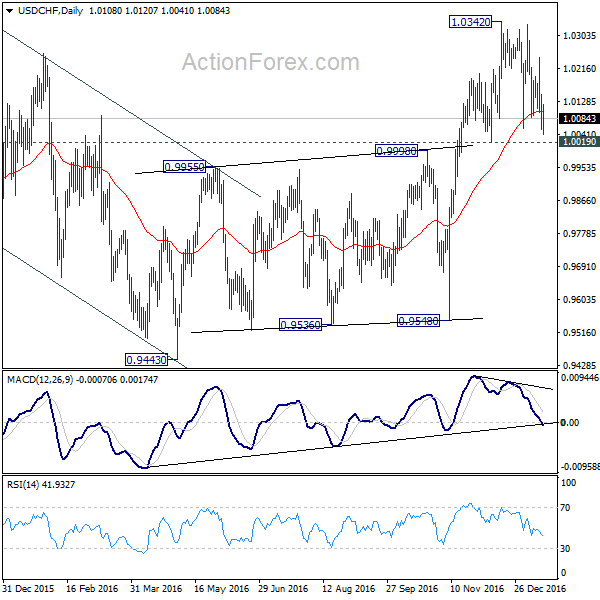
USD/CHF dipped mildly lower last week but stayed in range of 1.0019/0342. Initial bias remains neutral this week first. As long as 1.0019 support holds, further rally is still mildly in favor. Firm break of 1.0342 will confirm up trend resumption. However, sustained break of 1.0019 will indicate near term reversal and could bring deeper fall bring to 0.9443/9548 support zone.
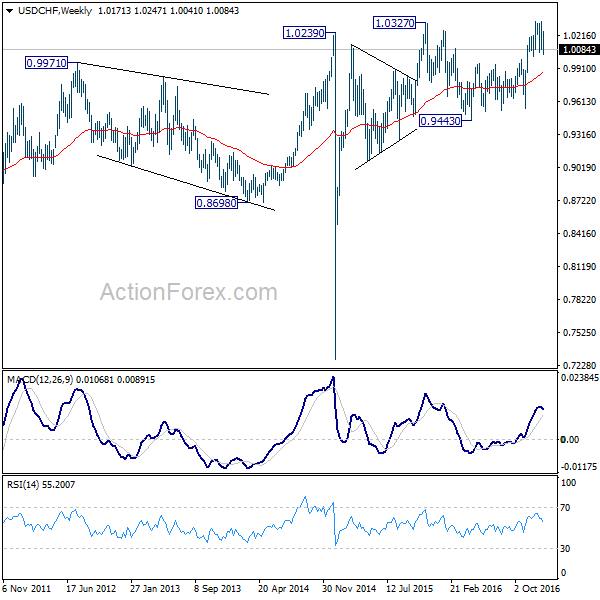
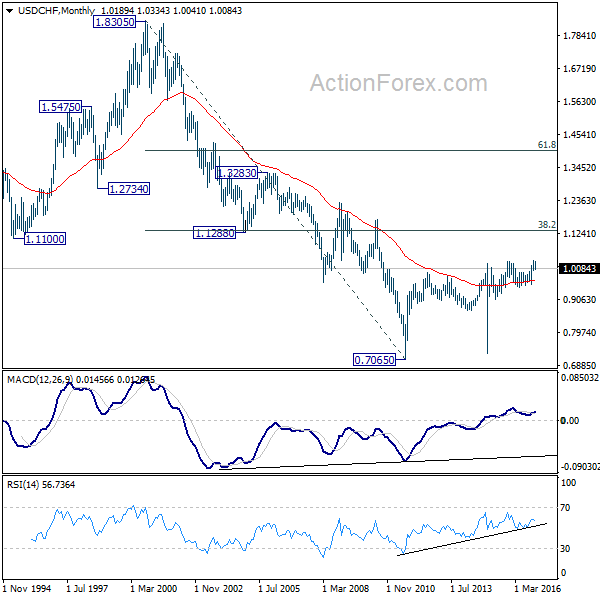
In the bigger picture, the corrective fall from 1.0327 should have completed at 0.9443 already. Rise from 0.9443 could be resuming the long term rally from 2011 low at 0.7065. But decisive break of 1.0327 is needed to confirm. In that case, next medium term upside target will be 38.2% retracement of 1.8305 to 0.7065 at 1.1359. Rejection from 1.0327 will extend the sideway pattern with another fall back to 0.9443/9548 support zone.
Subscribe to our daily and mid-day newsletter to get this report delivered to your mail box
AUD/USD Weekly Outlook
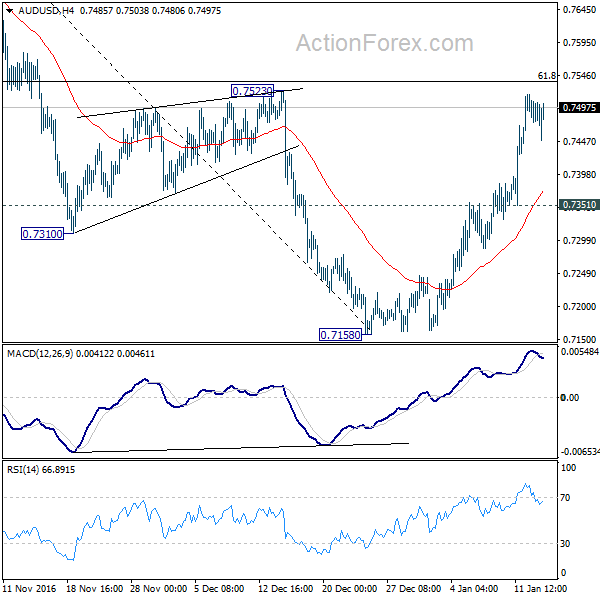
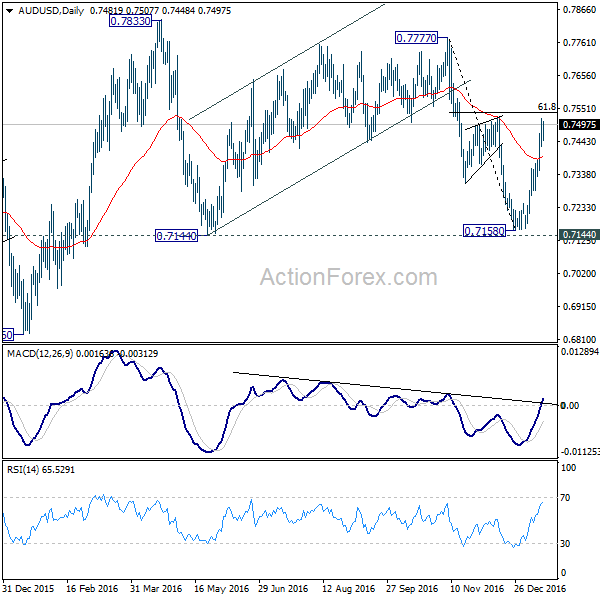
AUD/USD's rebound from 0.7158 extended last week and the stronger than expected rise is mixing up outlook. Initial bias stays on the upside this week for 61.8% retracement of 0.7777 to 0.7518 at 0.7541. At this point, we'd expect strong resistance from 0.7777/7833 to limit upside. On the downside, below 0.7351 minor support will turn bias back to the downside for 0.7144 key support level.
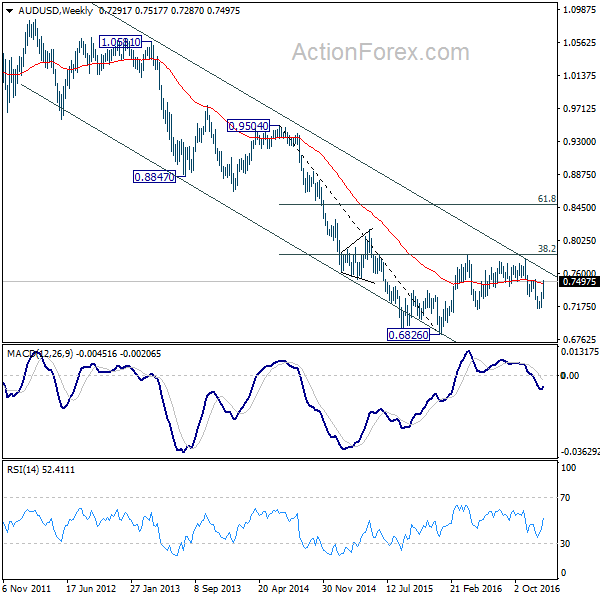
In the bigger picture, AUD/USD is staying inside long term falling channel and it's likely that the down trend from 1.1079 is still in progress. Break of 0.6826 low will confirm this bearish case. We'll be looking for bottoming sign again as it approaches 0.6008 key support level. Meanwhile, sustained break of 0.7833 resistance will be a strong sign of medium term reversal.
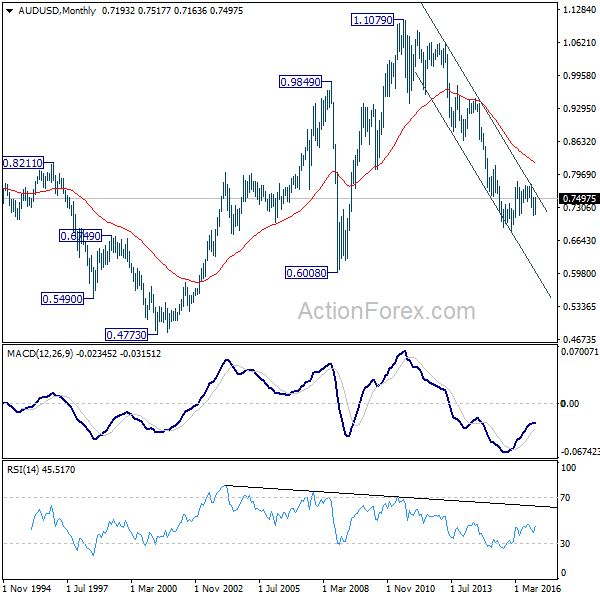
In the longer term picture, while the down trend from 1.1079 might extend lower, we're not anticipating a break of 0.6008 (2008 low) yet. We'll look for bottoming above there to reverse the medium term trend.
Subscribe to our daily and mid-day newsletter to get this report delivered to your mail box
USD/CAD Weekly Outlook
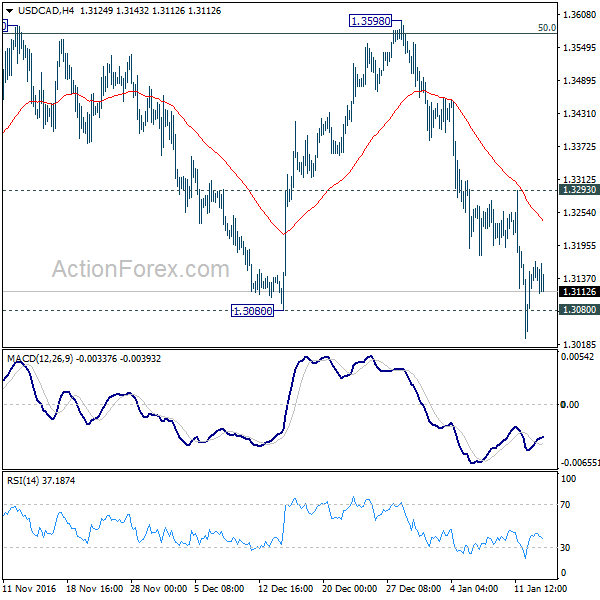
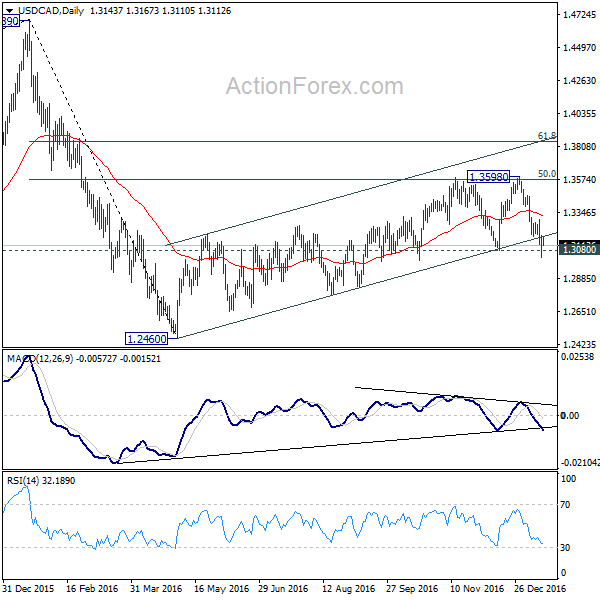
USD/CAD's fall from 1.3598 extended lower last week. The breach of 1.3080 key support level could have completed a double top pattern (1.3588, 1.3598) and indicates reversal. That is, whole corrective rise from 1.2460 is finished. Deeper decline is now expected this week as long as 1.3293 resistance holds. USD/CAD would now target a test on 1.2460 low.
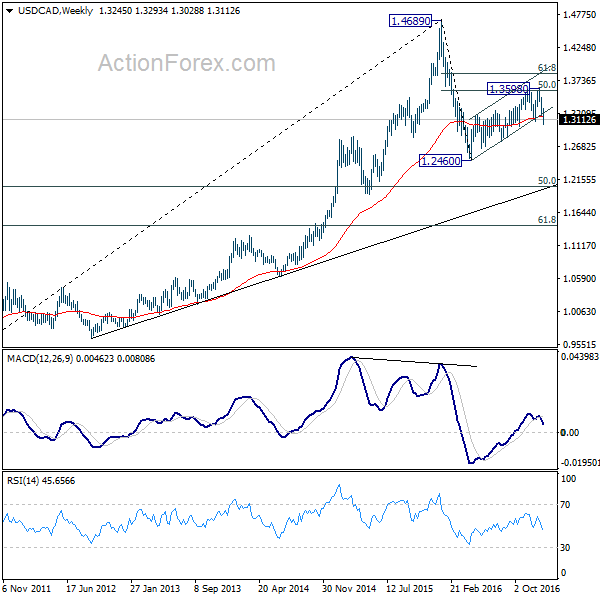
In the bigger picture, price actions from 1.4689 medium term top are seen as a correction pattern. The first leg has completed at 1.2460. The second leg is likely finished at 1.3598 too after hitting 50% retracement of 1.4689 to 1.2460 at 1.3575. Break of 1.3080 would now likely resume the fall from 1.4689 through 1.2460 to 50% retracement of 0.9406 to 1.4689 at 1.2048. We'd start to look for reversal signal below 1.2460 again to complete the correction. In case of another rise, we'll look for topping sign at 61.8% retracement of 1.4689 to 1.2460 at 1.3838.
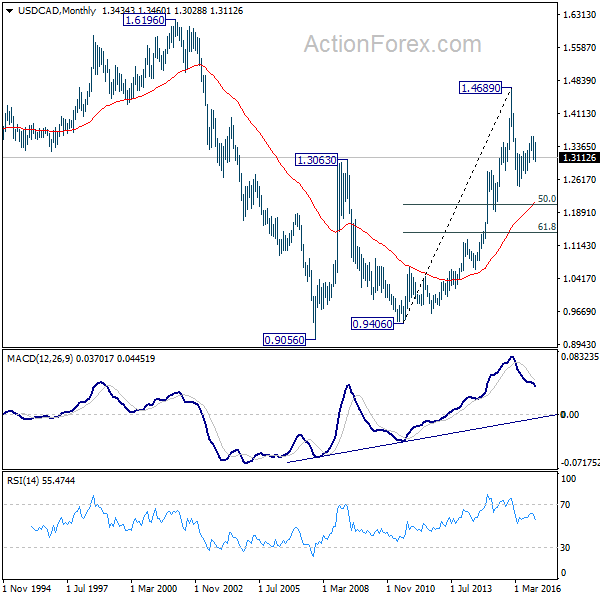
In the longer term picture, rise from 0.9056 (2007 low) is viewed as a long term up trend. It's taking a breath after hitting 1.4689. But such rise expected to resume later to test 1.6196 down the road.
Subscribe to our daily and mid-day newsletter to get this report delivered to your mail box
GBP/JPY Weekly Outlook
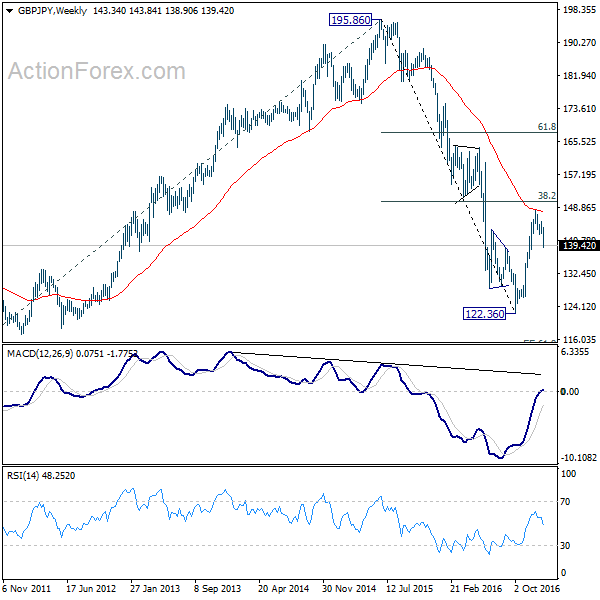
GBP/JPY's fall from 148.42 resumed last week and initial bias stays on the downside this week for 38.2% retracement of 122.36 to 148.42 at 138.46. Sustained trading below 138.46 will affirm the case that corrective rise from 122.36 has completed at 148.42 already. In that case, deeper fall should be seen to 61.8% retracement at 132.31 and below. On the upside, break of 142.16 support turned resistance will turn bias to the upside for 145.38 resistance and above.
In the bigger picture, price actions from 122.36 medium term bottom are seen as developing into a corrective pattern. Upside is so far limited by 38.2% retracement of 195.86 to 122.36 at 150.4 for setting the medium term range. At this point, we don't expect a break of 122.36 in near term and the corrective pattern would extend for a while.
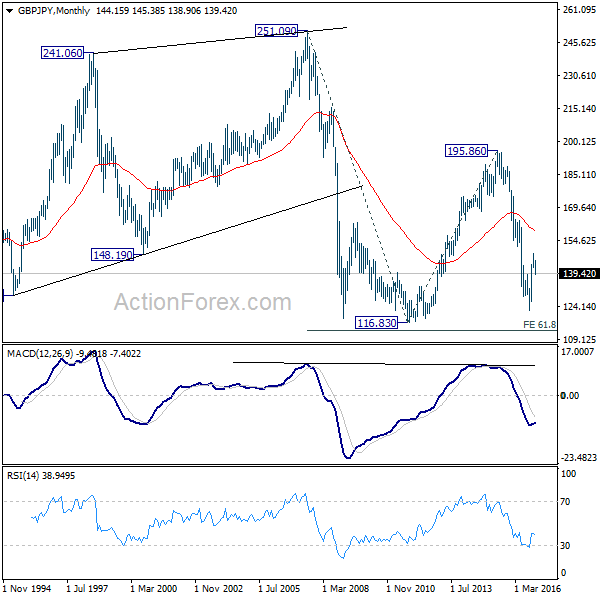
In the longer term picture, while price actions from 122.36 would develop into a medium term correction, fall from 195.86 is still seen as resuming the down trend from 251.09 (2007 high). Hence, after the correction from 122.36 completes we'd expect another fall through 116.83 low.
Subscribe to our daily and mid-day newsletter to get this report delivered to your mail box