Sample Category Title
ECB’s Villeroy sees more rate cuts as US inflation risks resurface under Trump
French ECB Governing Council member Francois Villeroy de Galhau shared his outlook on inflation and global growth risks today with France Inter, suggesting a period of moderate inflation within France alongside more rate cuts from ECB. He also projected that France’s unemployment rate could temporarily increase to around 8% before stabilizing back to 7%.
Villeroy raised concerns over the inflationary impact of US President-elect Donald Trump’s proposed economic policies, specifically warning that Trump’s program “risks bringing back inflation to the United States.” He suggested this could slow global growth, although the full extent of this impact remains uncertain and could vary between the US, China, and Europe.
A particular focus of Villeroy's remarks was on Trump’s proposed tariffs, which aim to eliminate the US trade deficit by imposing a 10% or higher tax on all imported goods.
Villeroy argued that such protectionist policies could ultimately hurt US consumers, noting, “Protectionism almost always means reduced purchasing power for consumers.”
USDJPY Stretches Uptrend into 155 Area
- USDJPY resumes uptrend, unlocks 3½-month high
- Short-term bias is positive; July’s barrier could pose a test
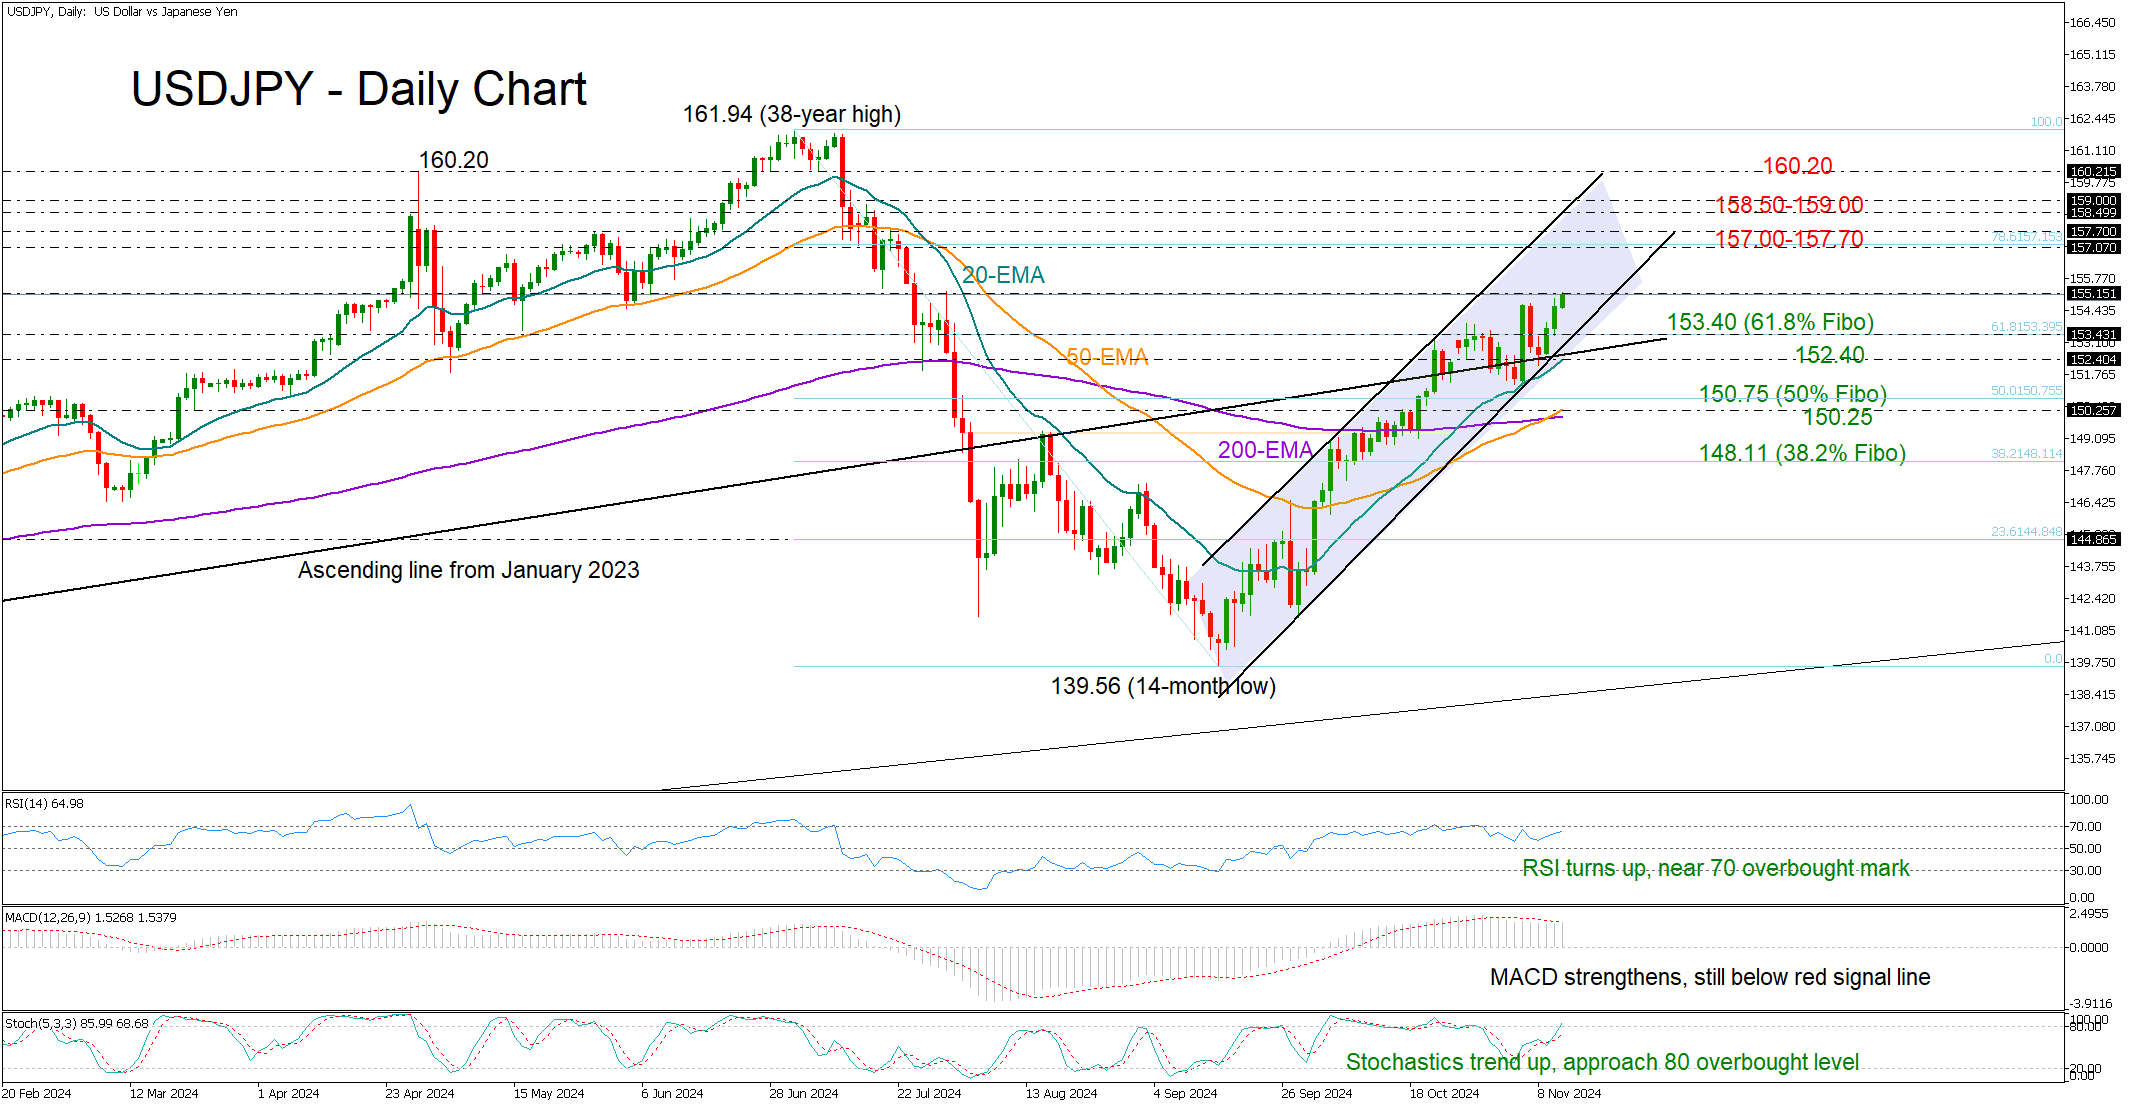
USDJPY broke into the 155.00 territory for the first time since July, reigniting optimism that the upleg which started in mid-September has more room to run.
That said, the pair seems to be facing an obstacle near the 155.20 level – the same zone that sparked a sharp downfall at the end of July. With the RSI and stochastic oscillator edging toward overbought territory, a potential slowdown or consolidation could be on the cards.
Hence, for the bulls to maintain momentum, they'll need to decisively pierce through the 155.20 wall. Such a move could pave the way for the next target range around 158.50-159.00, where the upper boundary of the upward-sloping channel lies. From there, the 160.20 mark could be the next major hurdle.
Otherwise, a pullback could initially take a halt somewhere between the 61.8% Fibonacci retracement of the previous downleg at 153.40 and the 20-day exponential moving average (EMA) at 152.40. If the bears breach that floor, confirming a negative shift in market sentiment, the spotlight may immediately fall on the 50% Fibonacci mark of 150.75 and the 50- and 200-day EMAs. Further downside could see the pair test the 38.2% Fibonacci level at 148.11.
In summary, USDJPY is back in an uptrend, though for a continuous rally, the bulls must successfully close above the 155.20 barrier.
GBP/USD Outlook: Bears Take a Breather After Sharp Three-Day Fall
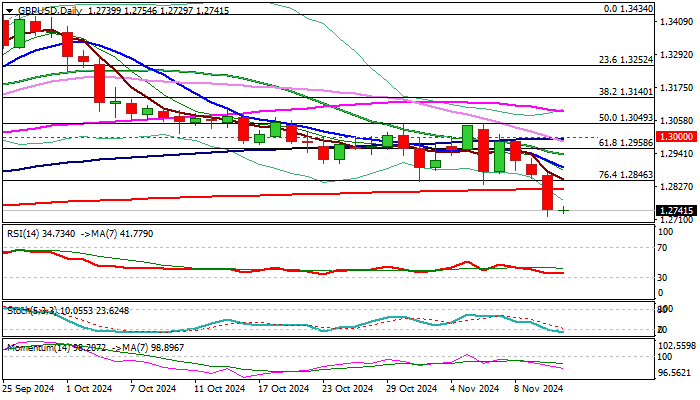
Cable is holding within a narrow consolidation in early Wednesday’s trading as bears started to run out of steam after steep fall (down 1.85%) in past three days.
Tuesday’s break and close well below pivotal supports at 1.2846 (Fibo 76.4% of 1.2664/1.3434 / former base) and 1.2817 (200DMA) generated strong bearish signal.
Markets await release of US inflation data for October (due later today) for fresh signals that keeps the pair in a quiet mode this morning.
Broken 200DMA / Fibo reverted to resistances which should ideally cap upticks to keep larger bears intact and guard falling 10DMA (1.2894) and 20DMA (1.2938) violation of which would question bears and risk test of upper breakpoint at 1.3000 (psychological / 100DMA).
Res: 1.2776; 1.2817; 1.2846; 1.2894.
Sup: 1.2719; 1.2664; 1.2612; 1.2599.
USD/JPY at a Three-Month Peak: No One Opposes the US Dollar
The USD/JPY currency pair has climbed to a three-month high of 154.87, driven by the strengthening US dollar following Donald Trump’s election victory. Markets anticipate that Trump’s protectionist policies, which are expected to bolster the US economy, might also fuel inflation, prompting the Federal Reserve to maintain higher interest rates than previously anticipated.
In Japan, producer prices rose at their fastest pace in 14 months in October, signalling persistent inflation pressures. Attention is shifting towards Japan’s GDP data for Q3 2024, set to be released on Friday, which will provide further insight into the economic trends affecting the yen.
The Bank of Japan is under scrutiny as it contemplates an interest rate increase to 1% per annum during the first half of fiscal 2025. However, Japanese monetary authorities remain cautious, considering the external economic factors and the challenges posed by persistent inflation.
Technical analysis of USD/JPY
On the H4 USD/JPY chart, the market continues developing the third wave of growth to the level of 156.15. After reaching this level, we will consider the probability of the start of correction to the level of 154.15. Further, we expect the beginning of a new wave of growth to the level of 157.00. Technically, this scenario is confirmed by the MACD indicator. Its signal line is above the zero level and is directed upwards.
On the H1 USD/JPY chart, the market has formed a consolidation range around the 154.15 level and continues developing the wave to 156.15 with an upward exit. After reaching this level, we expect a correction towards 154.15, initially targeting 155.20. Technically, this scenario is confirmed by the Stochastic oscillator. Its signal line is above the level of 50 and is directed upwards.
Euro Hits Yearly Lows, Pound Dips Below 1.2800
Looking at recent moves in major currency pairs, it’s clear that market participants have come to terms with Donald Trump's victory in the U.S. presidential election and are starting to prepare for changes to the global economic landscape. Among the new president’s campaign promises was the introduction of additional tariffs on imports to the U.S. For instance, Trump has proposed around a 25% tariff on Mexican imports and a range of 10% to 20% for goods from European nations. Unsurprisingly, the prospect of potential trade wars is impacting the pricing of pairs such as EUR/USD and GBP/USD.
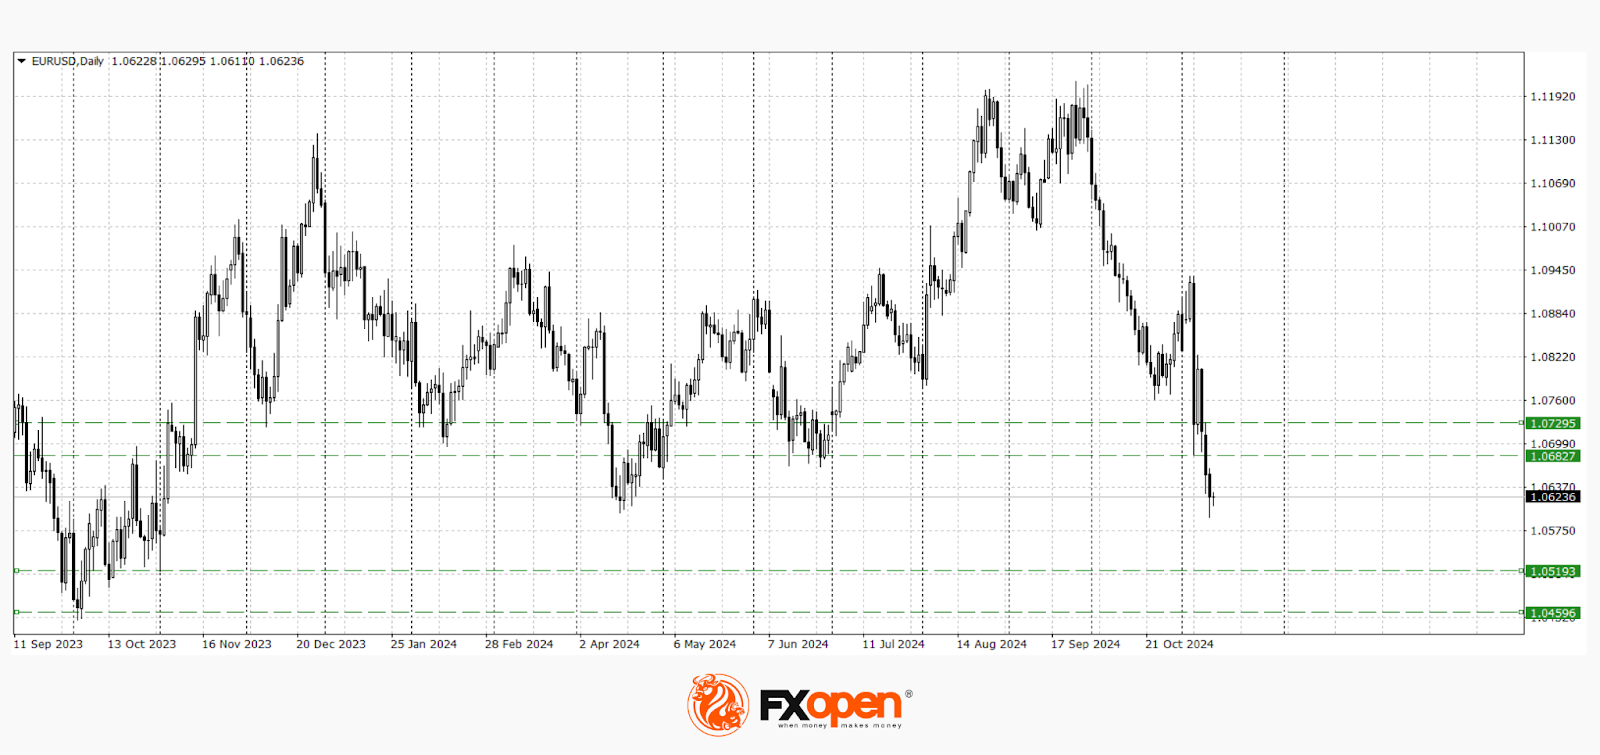
EUR/USD
The Euro has been in decline for the second consecutive week. Yesterday, it hit a new yearly low near 1.0600 but found support at 1.0590, bouncing slightly. If the 1.0600-1.0580 range turns into resistance, the pair may test the lows seen in 2023, around 1.0520-1.0460. A sustained upward move is likely only if the pair firmly clears 1.0730-1.0680.
The following news could significantly influence EUR/USD pricing:
- Today at 11:00 (GMT +3), a European Central Bank meeting on non-monetary policy
- Today at 13:30 (GMT +3), Germany's 10-year treasury bond auction
- Today at 16:30 (GMT +3), release of the U.S. core consumer price index (CPI)
GBP/USD
Yesterday, GBP/USD sellers broke through a critical support range at 1.2830-1.2800, with the price declining to 1.2720 before correcting to 1.2760. The price’s behavior around the 1.2800-1.2760 range will be key for identifying the next trend. A rejection at this level may lead to further declines towards 1.2720-1.2700, while a break above 1.2800 could signal the start of an upward correction.
Key events that could affect GBP/USD today:
- 12:45 (GMT +3) – Speech by Bank of England Monetary Policy Committee member Catherine Mann
- 13:00 (GMT +3) – Release of data on the sale of 4-year treasury securities in the UK
- 21:30 (GMT +3) – Speech by Federal Reserve official Jeffrey Schmid

Trade over 50 forex markets 24 hours a day with FXOpen. Take advantage of low commissions, deep liquidity, and spreads from 0.0 pips. Open your FXOpen account now or learn more about trading forex with FXOpen.
This article represents the opinion of the Companies operating under the FXOpen brand only. It is not to be construed as an offer, solicitation, or recommendation with respect to products and services provided by the Companies operating under the FXOpen brand, nor is it to be considered financial advice.
Elliott Wave View on DAX Looking for Larger Degree Correction
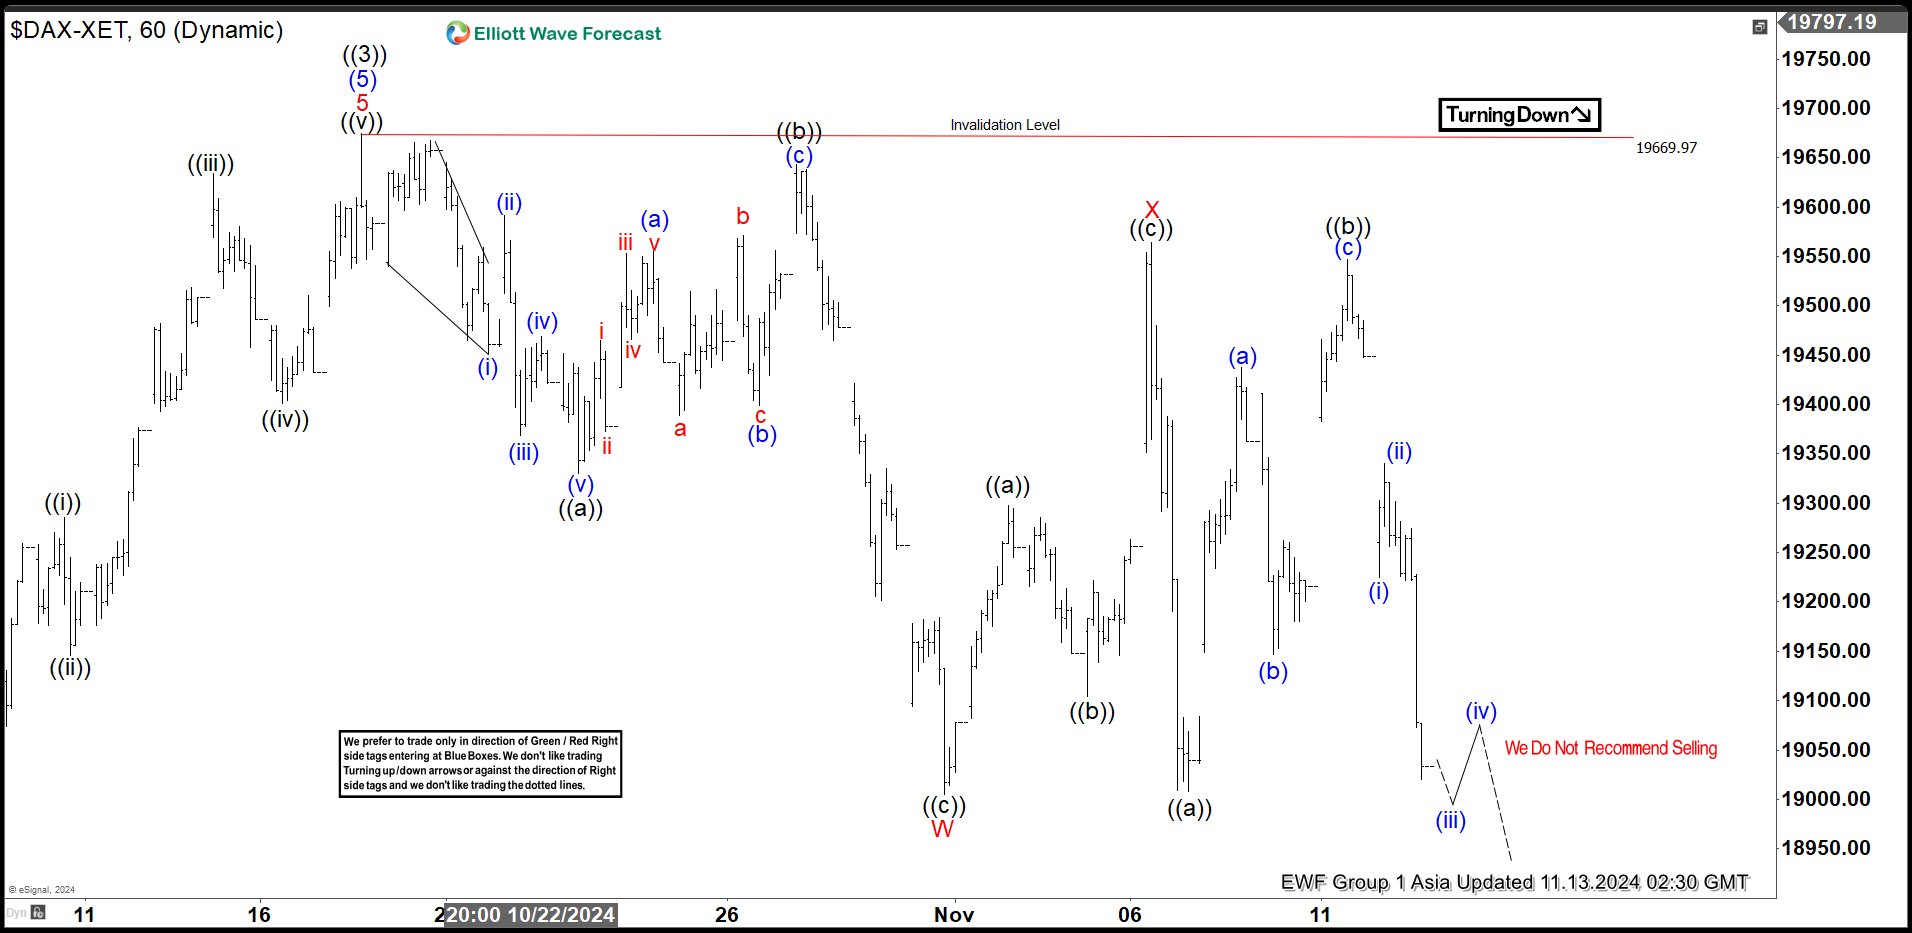
Short Term Elliott Wave View in DAX suggests rally to 19670 ended wave ((3)). Wave ((4)) pullback is currently in progress as a double three Elliott Wave structure. Down from wave ((3)), wave (i) ended at 19451.7 and rally in wave (ii) ended at 19591.5. Wave (iii) lower ended at 19368.69 and wave (iv) rally ended at 19468.6. Final wave (v) lower ended at 19330.1 which completed wave ((a)). Rally in wave ((b)) ended at 19643.12 with internal subdivision as a zigzag. Up from wave ((a)), wave (a) ended at 19555.45 and wave (b) ended at 19399.16. Wave (c) higher ended at 19643.12 which completed wave ((b)) in higher degree.
Wave ((c)) lower ended at 19004.97 which completed wave W in higher degree. Up from wave W, wave ((a)) rally ended at 19297.6 and wave ((b)) ended at 19104.59. Wave ((c)) higher ended at 19563.97 which completed wave X in higher degree. Index has turned lower in wave Y with internal subdivision as a zigzag structure. Down from wave X, wave ((a)) ended at 19007.88. Wave ((b)) rally ended at 19456.9 and Index has turned lower. Near term, as far as pivot at 19669.9 high stays intact, expect Index to extend lower.
DAX 60 Minutes Elliott Wave Chart
DAX Elliott Wave Video
https://www.youtube.com/watch?v=rclDuhY9QCs
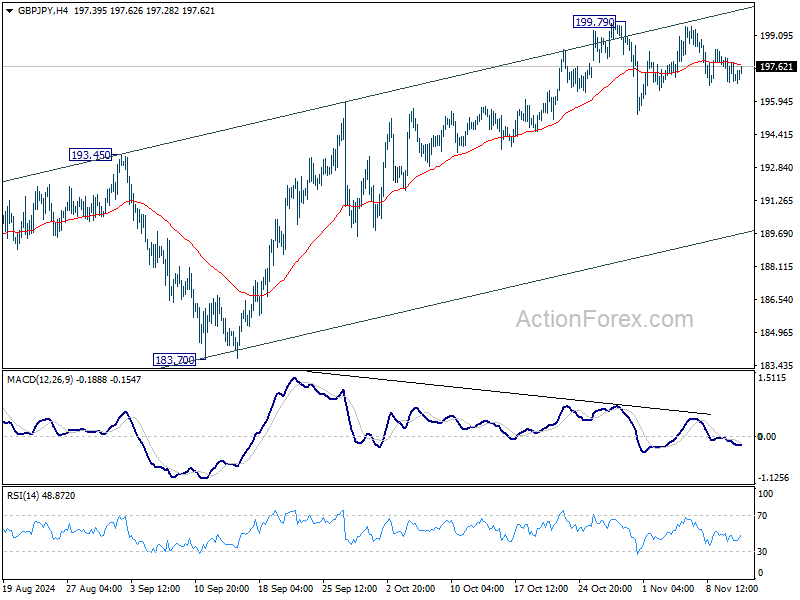
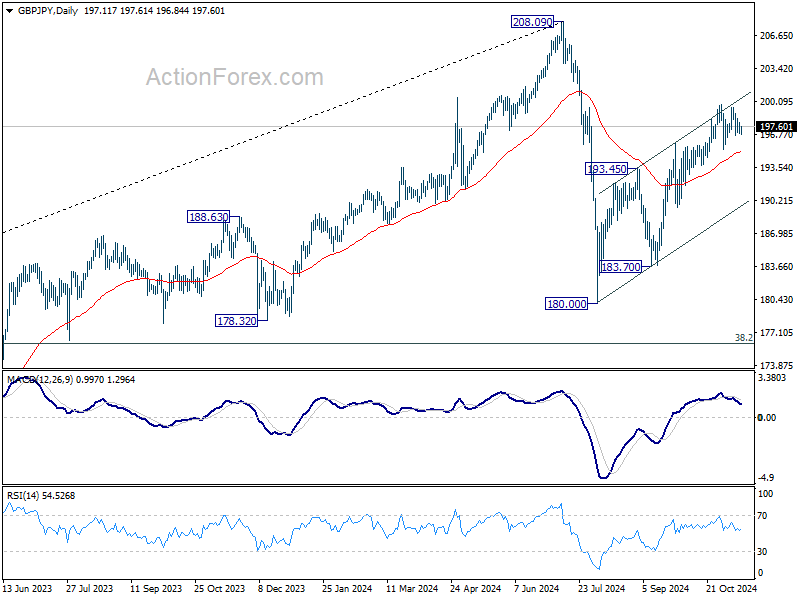
GBP/JPY Daily Outlook
Daily Pivots: (S1) 196.64; (P) 197.36; (R1) 197.82; More...
GBP/JPY continues to trade sideway and intraday bias remains neutral. Further rally is expected as long as 55 D EMA (now at 195.05) holds. Above 199.79 will resume the rebound from 180.00 to retest 208.09 high. However, sustained break of 55 D EMA will argue that the corrective rise has completed already, and turn near term outlook bearish for 180.00/183.70 support zone.
In the bigger picture, price actions from 208.09 are seen as a correction to whole rally from 123.94 (2020 low). The range of consolidation should be set between 38.2% retracement of 123.94 to 208.09 at 175.94 and 208.09. However, decisive break of 175.94 will argue that deeper correction is underway.
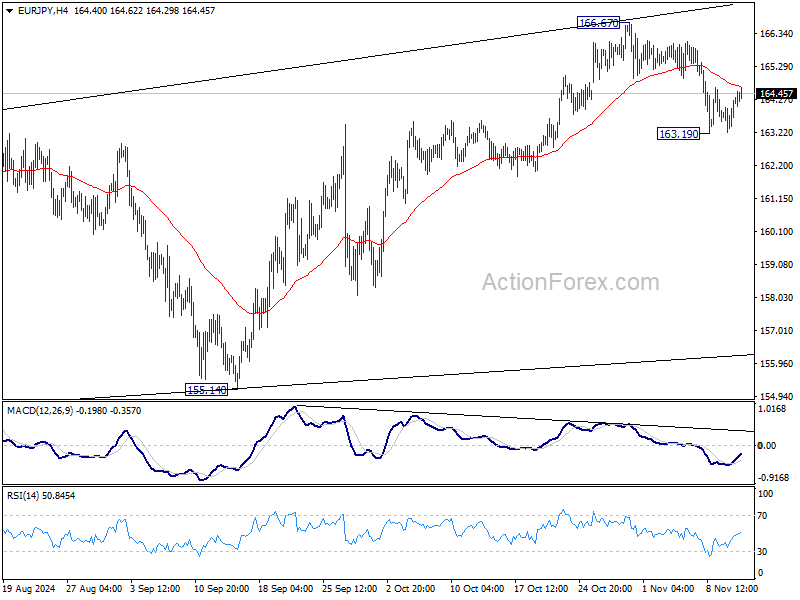
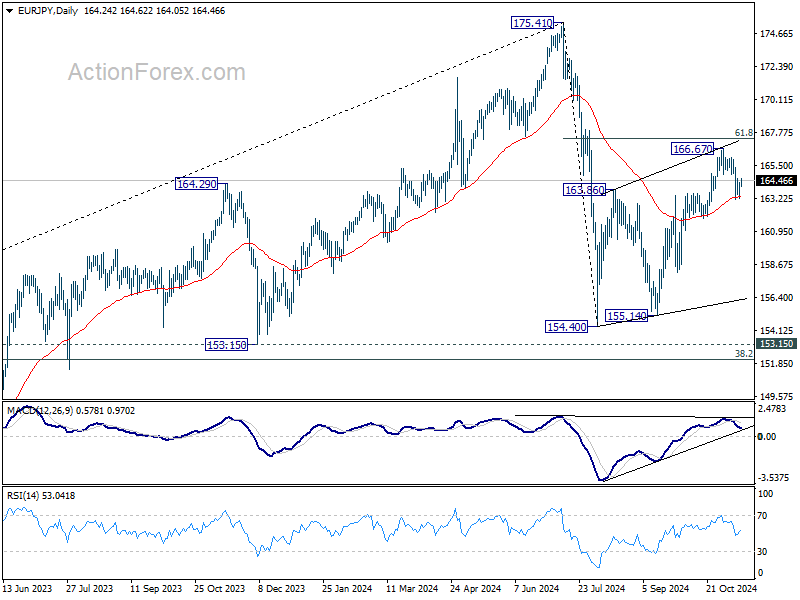
EUR/JPY Daily Outlook
Daily Pivots: (S1) 163.56; (P) 163.95; (R1) 164.64; More....
EUR/JPY turned sideway after drawing support from 55 D EMA (now at 163.34), and intraday bias is turned neutral first. On the downside, sustained trading below 55 D EMA will argue that whole corrective rise from 154.40 has completed with three waves up to 166.67. Deeper decline should then be seen back to 154.40/155.14 support zone. On the upside, break of 166.67 will target 61.8% retracement of 175.41 to 154.40 at 167.38 instead.
In the bigger picture, price actions from 175.41 are seen as correction to rally from 114.42 (2020 low). The range of consolidation should have been set between 38.2% retracement of 114.42 to 175.41 at 152.11 and 175.41 high. However, decisive break of 152.11 would argue that deeper correction is underway.
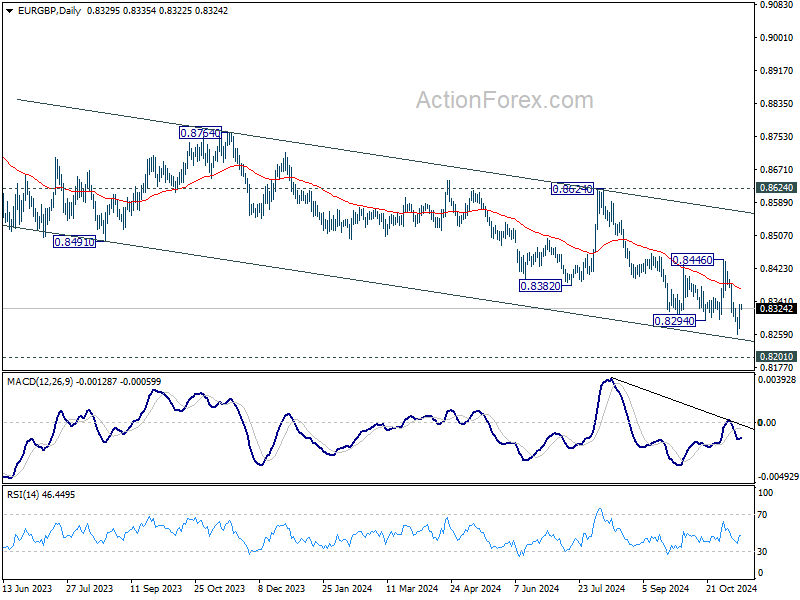
EUR/GBP Daily Outlook
Daily Pivots: (S1) 0.8294; (P) 0.8315; (R1) 0.8354; More...
Intraday bias in EUR/GBP is turned neutral again with break of 0.8324 minor resistance. Some consolidations could be seen but further decline is expected as long as 0.8446 resistance holds. Break of 0.8259 will resume larger down trend to 0.8201 key support.
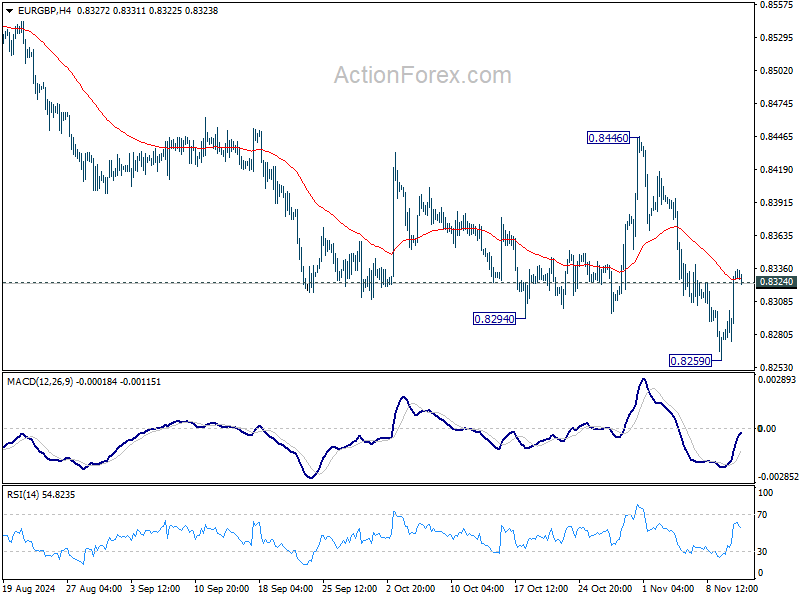
In the bigger picture, down trend from 0.9267 (2022 high) is in progress. Next target is 0.8201 (2022 low), but strong support should be seen there to bring rebound. However, outlook will remain bearish as long as 0.8624 resistance holds even in case of strong rebound. Decisive break of 0.8201 will indicate long term bearish reversal.
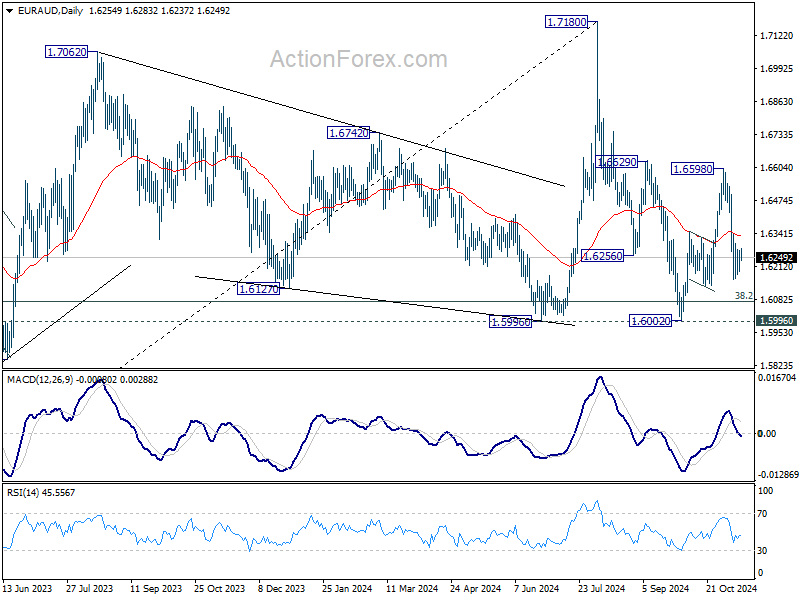
EUR/AUD Daily Outlook
Daily Pivots: (S1) 1.6211; (P) 1.6245; (R1) 1.6293; More...
Intraday bias in EUR/AUD remains neutral, and risk will stay mildly on the downside as long as 1.6598 holds, in case of stronger rebound. On the downside, break of 1.6161 will resume the decline from 1.6590 to target a test on 1.5996/6002 key support zone.
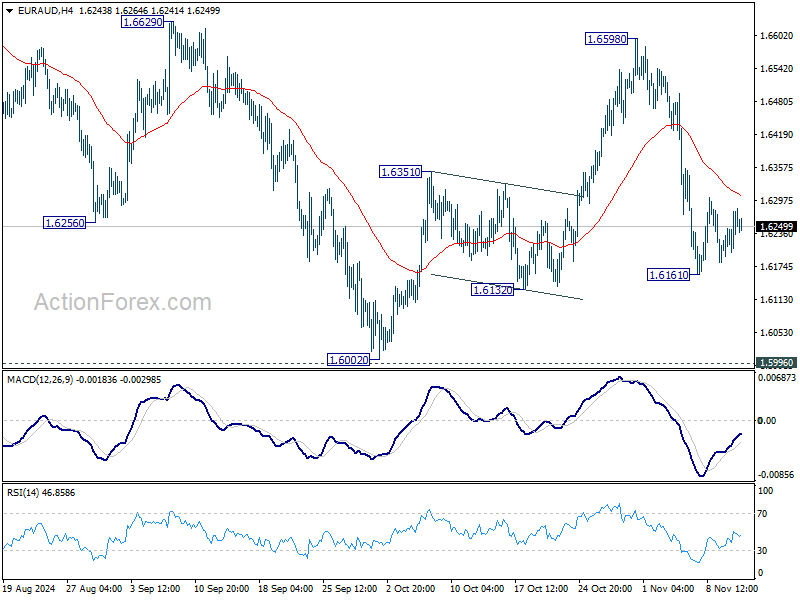
In the bigger picture, as long as 1.5996 cluster support , up trend from 1.4281 (2022 low) is still expected to resume through 1.7180 at a later stage. However decisive break of 1.5996 will argue that the medium term trend might have reversed. Deeper fall would be seen to 61.8% retracement of 1.4281 (2022 low) to 1.7180 at 1.5388, even as a correction.