Sample Category Title
How Markets Will React to US Election Results
Market picture
Polls and forecasts have yet to produce a clear frontrunner in the US presidential race. In recent days, there has been a widespread view that markets are pricing in a Trump victory, but for many investors it is too close to call, increasing the potential for movement when the results are announced.
Remember that in addition to the presidential election, there will also be votes for the Senate and the House of Representatives. The latest estimates suggest that the main candidates have an equal chance of winning. The Senate is expected to be controlled by the Republicans (69% chance), while the House of Representatives is expected to go to the Democrats (56% chance). The most significant impact on the markets would be the consolidation of power in the hands of one party, enabling it to implement its initiatives quickly. The expected outcome would force the president to compromise, which would take time, smoothing out the overall impact but not eliminating it.
If Harris wins
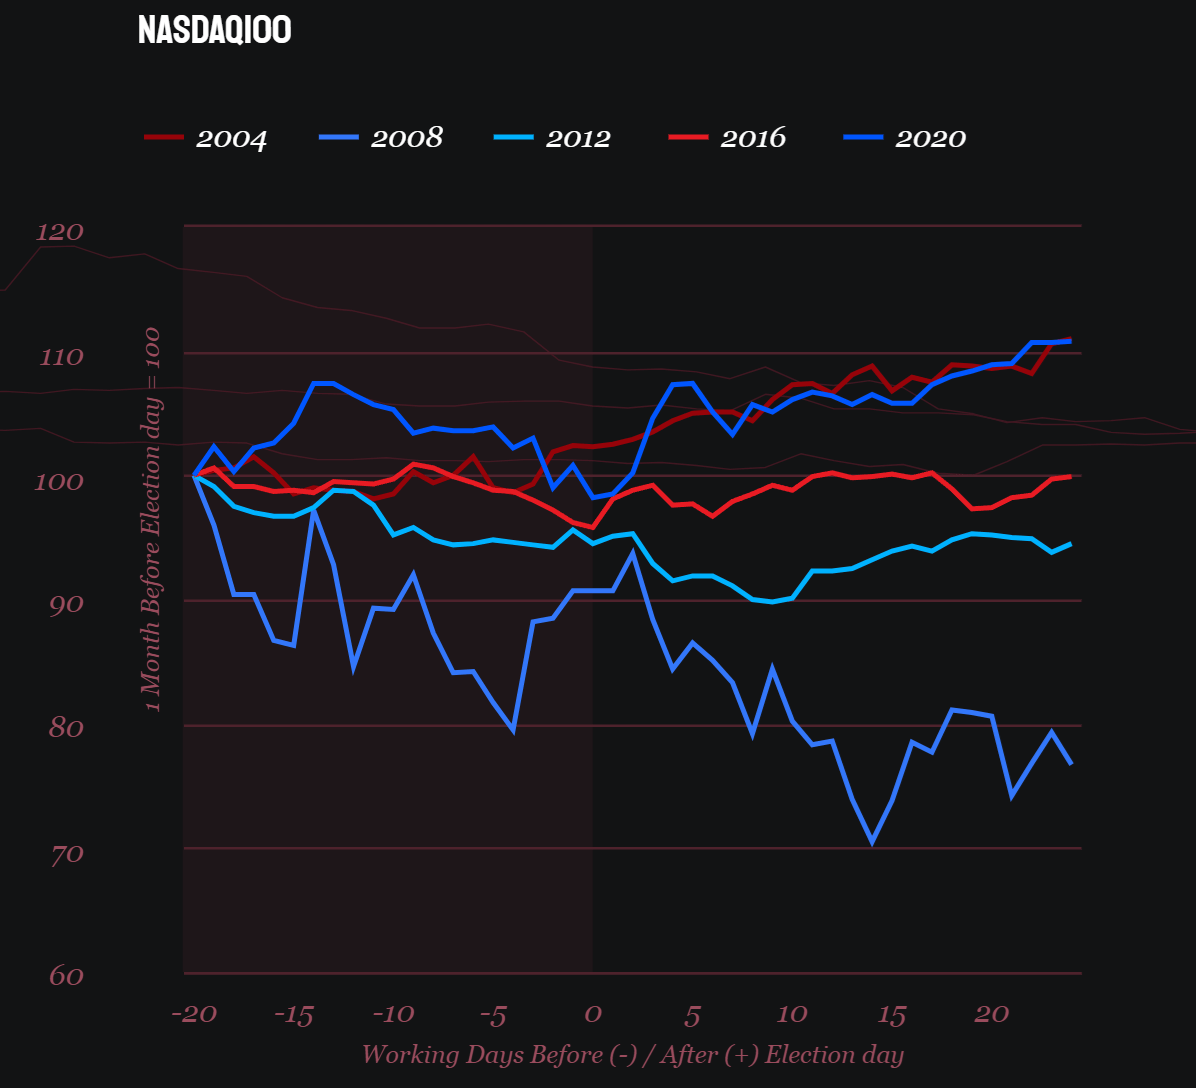
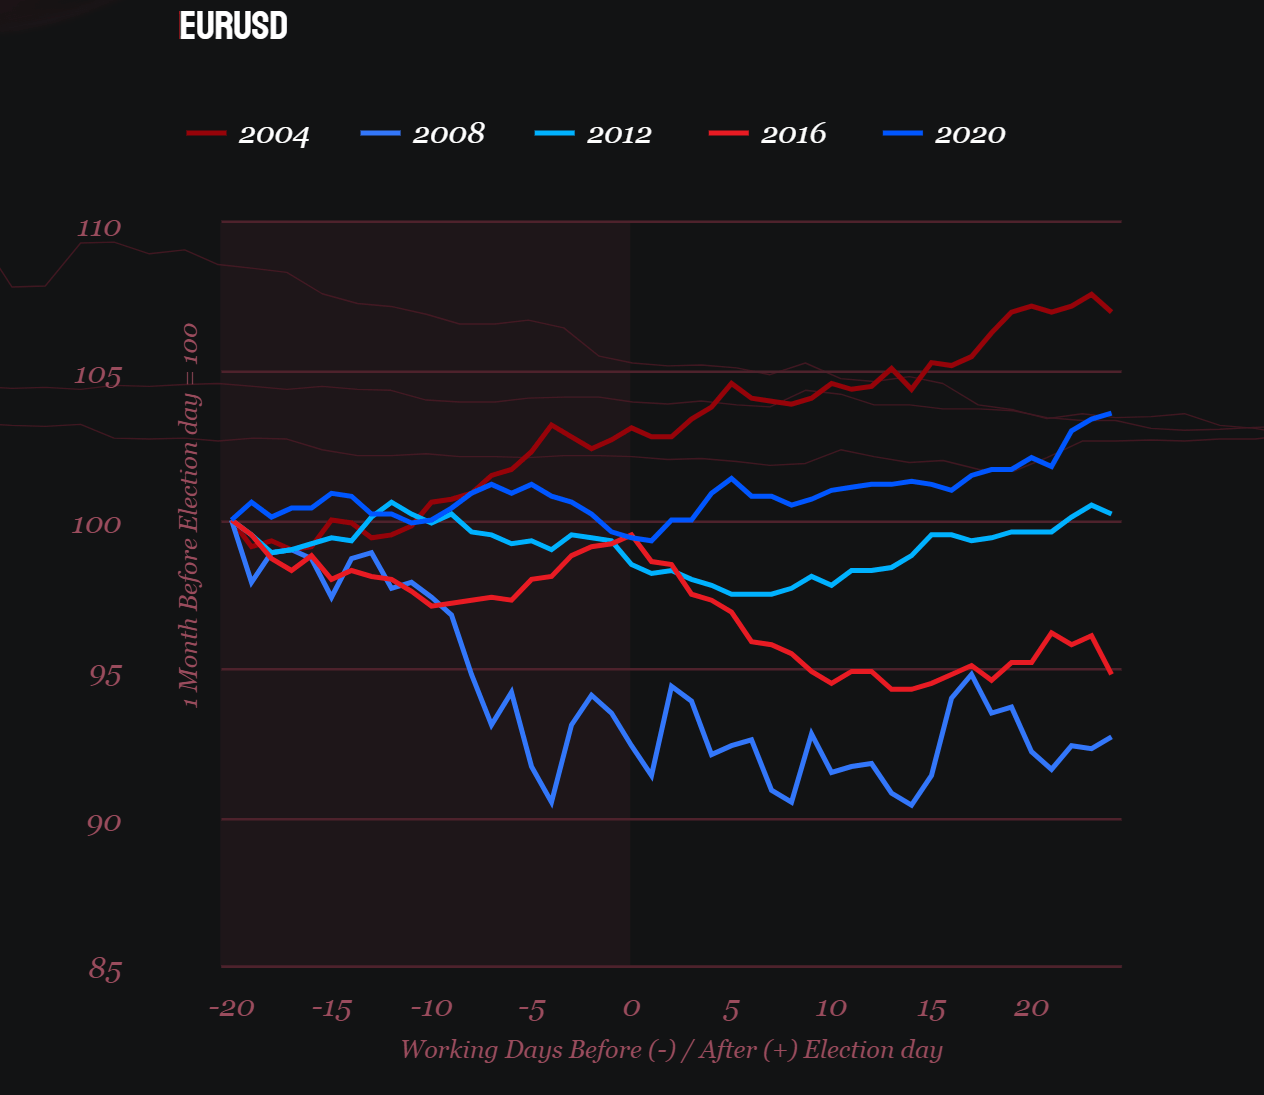
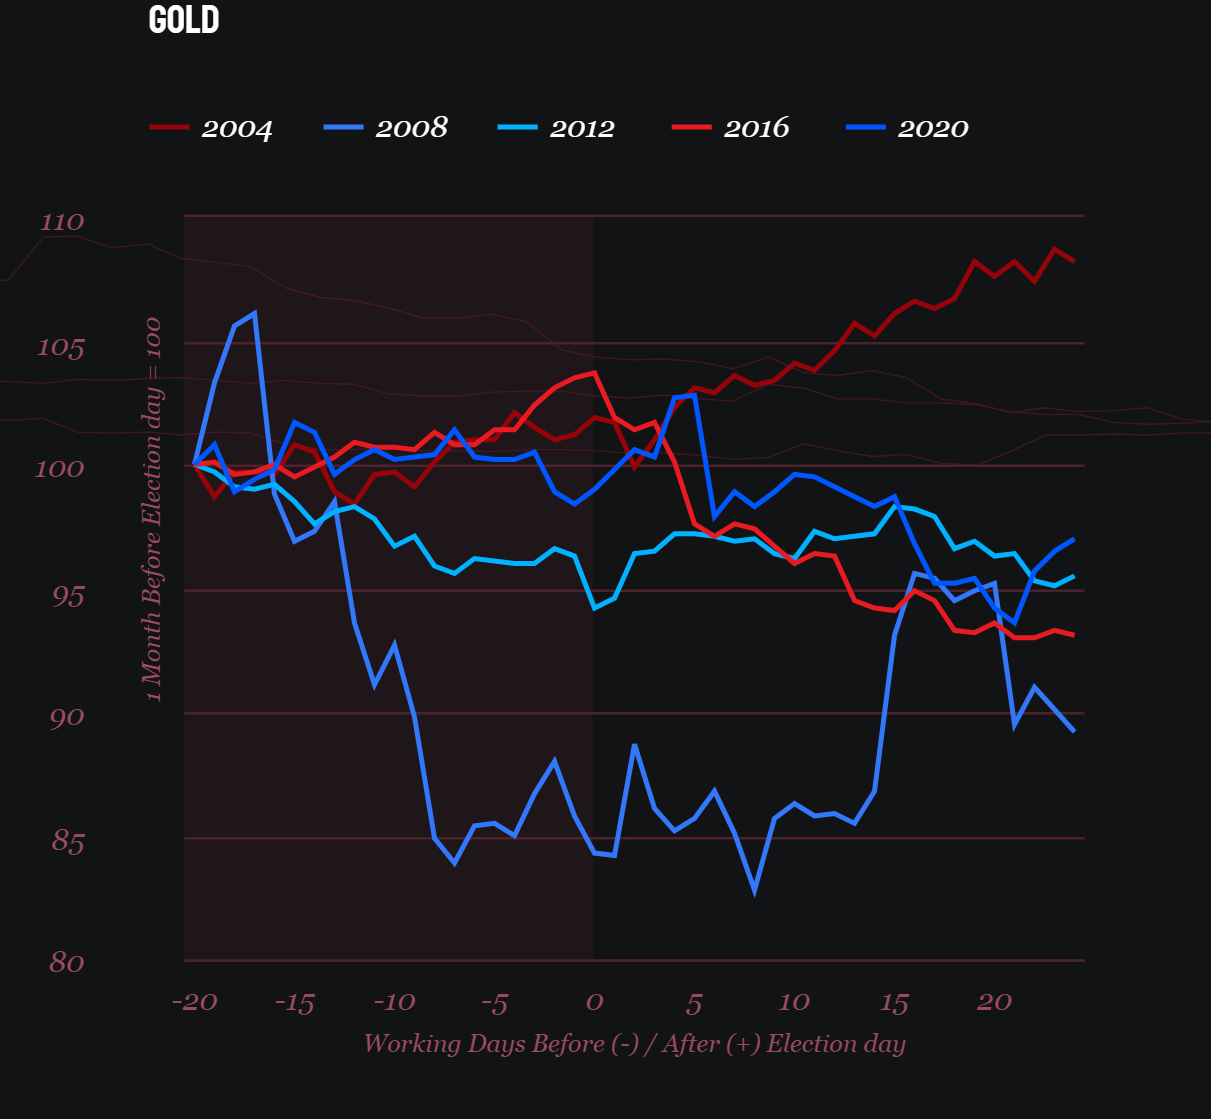
The arrival of Democrat Harris in the White House will maintain the status quo on key policies. This could be good news for alternative energy, as defences against Chinese competition are likely to increase. The arrival of the Democrats in 2020 has also been good for the Russell 2000 index, which has rushed to catch up with the rest of the market in anticipation of consumer stimulus. In the currency market, a rise in consumer spending could push the dollar lower. The Dollar Index would then move towards the 90-100 area from the current 104.3. Since 2008, the EURUSD has gained between 0.7% and 3.5% intraday on a Democratic victory. Gold has gained 2-5% intraday on a Democratic victory, but the dynamics have been mixed since then.
If Trump wins
Trump’s return to the White House is potentially good news for big business, as it could lead to new tax cuts and trade barriers with a wide range of trading partners, from nearby Canada and Mexico to the EU and China. That was roughly the outcome after 2018. Rapid implementation of his reforms could bring capital inflows to the US, ensuring that stock indices outperform. We should also expect increased traction for hydrocarbon companies, given the industry’s lobby among Republicans.
At the same time, this is potentially good news for the dollar, which added impressively in 2018-2020 as trade disputes have intensified. You can’t do without them with a new ex-president. The US currency could also benefit from a rising risk premium, which goes hand in hand with Trump’s heightened tone in meetings with colleagues and his frequent mood swings. The DXY could then return to its 2022 highs within a couple of years, 10% above current levels.
Gold rose 5% intraday on Trump’s election, only to erase the gains before the end of the day and lose 14% by the end of the year. In general, however, gold is more tied to monetary policy cycles than to individual presidents. Assuming higher inflation in the US under Trump, we should expect higher Fed rates and more pressure on the price of the ounce.
Whoever wins
Investors are increasingly focusing on the dynamics of the budget deficit. A couple of years ago, markets chastised the UK for announcing ‘unfunded’ tax cuts. The same could be happening in the US. We do not rule out the possibility that the persistent fall in bond prices (rising yields) and the pull on the dollar and gold since September are a manifestation of concern about this issue. The candidates are avoiding this uncomfortable topic but will surely return to it immediately after the victory speech. There is potential for volatility in the first few days after the election, as well as a commitment to the original campaign promises.
Stock indices tend to rally soon after an election, after a period of sluggishness in the weeks leading up to it. But it’s worth noting that in previous elections, equity indices have corrected more deeply and accelerated higher than we’ve seen now. A repeat of all-time highs is likely, but it’s hardly reasonable to expect 10% or 15% gains for the rest of the year after election day, as we saw in 2016 and 2020, or even 7%, as was the case in 2012.
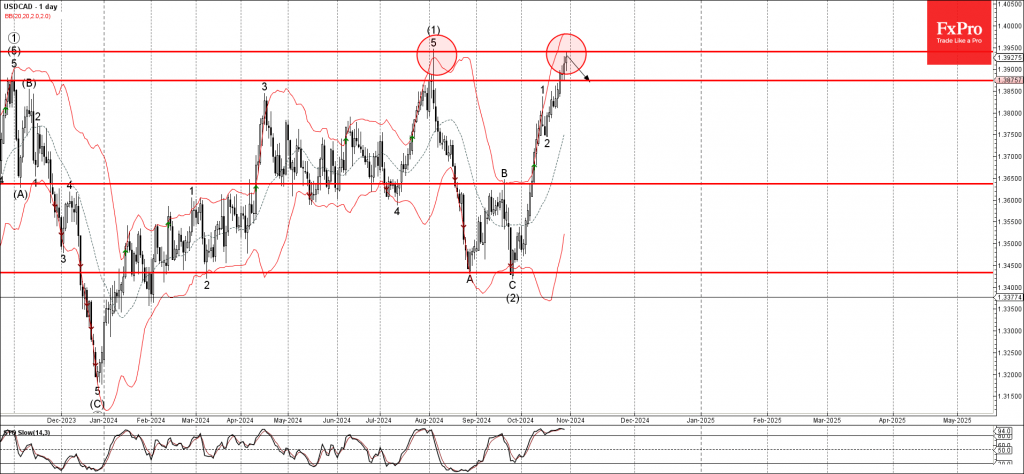
USDCAD Wave Analysis
- USDCAD reversed from strong resistance level 1.3940
- Likely to fall to support level 1.3875
USDCAD currency pair today reversed down from the strong resistance level 1.3940 (which stopped the previous intermediate impulse wave (1) at the start of August).
The downward reversal from the resistance level 1.3940 stopped the earlier impulse waves 3 and (3).
Given the strength of the resistance level 1.3940 and the strongly overbought daily Stochastic indicator, USDCAD currency pair be expected to fall further toward the next support level 1.3875.
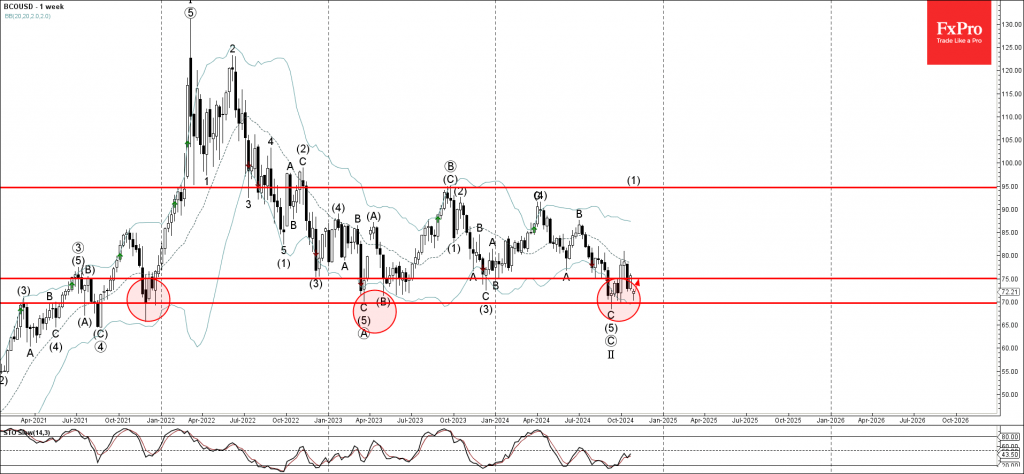
Brent Crude Oil Wave Analysis
- Brent crude oil reversed from long-term support level 70.00
- Likely to rise to resistance level 75.00
Brent crude oil recently reversed up from the major long-term support level 70.00 (which has been reversing the price from the end of 2021).
The support zone near the support level 70.00 was strengthened by the lower daily and the weekly Bollinger Bands.
Given the strength of the support level 70.00 and the bullish divergence on the weekly Stochastic indicator, Brent crude oil can be expected to rise to the next resistance level 75.00.
Sunset Market Commentary
Markets
With central banks in full data dependence mode, every eco figure counts. It makes trading more volatile from one policy meeting to the next. A disappointing September PMI survey and confirmation of the disinflation trend convinced the ECB into conducting back-to-back rate cuts in October and convinced markets that a 50 bps December rate cut could be in the cards. Today’s data show that the ECB was trigger-happy and that (EMU) money market better pare those acceleration wagers. We pointed out the discrepancy between soft EMU survey data and more robust hard data. Since the former are released in a more timely manner, they tend to grab most attention. For once it's the other way around. The gap between a PMI-prognoses flat quarterly growth figure and the effective 0.4% Q/Q print was even bigger than expected. On a national level, Spain stuck with its stellar 0.8 Q/Q growth, while both France (0.4%) and Germany (0.2%) beat consensus. Italy (0%) was the outlier with net exports working as a drag. GDP data helped EUR/USD together with national inflation prints to an intraday top of 1.0859, creating more breathing space around the 10778/61 support zone. Inflation is the second piece of the puzzle. The ECB knew in advance that base effects would lift headline inflation rapidly back above the 2% inflation target after a one-off lower in September. National numbers in Spain show a 0.6% M/M and 1.8% Y/Y increase with core PCI unexpectedly ticking up to 2.5% Y/Y. Belgian inflation rose by 0.5% M/M to 3.2% Y/Y. German inflation accelerated from 0% in September to 0.4% M/M in October (vs 0.2% expected) with the annual reading up at 2.4% Y/Y (from 1.8%). EMU numbers will be published tomorrow. Daily changes on the German yield curve range between +4.6 bps (2-yr) and -3.4 bps (30-yr) compared to yesterday evening’s close. However, we must add a significantly lower opening, copying the late swoon in US yields yesterday (related to Trump losing his 56-44 lead against Harris in election prediction models?). The US agenda was buzzing as well today. ADP employment change showed 233k net job growth in October, the most since July 2023, with a 15k upward revision for September and smashing 111k consensus. The US economy continued to grow at a solid pace in Q3 (2.8% Q/Qa) with consumption against amongst the drivers (+3.7% Q/Qa). Core PCE rose by 2.2% Q/Q, slightly stickier than 2.1% consensus. Pending home sales completed the hattrick, rising an impressive 7.4% M/M (2.2% Y/Y). US yields made an obvious attempt to build on this month’s gains on such good eco data, but the move lacked strength with nearby US elections causing some paralysis as well. Daily changes currently range between +3.8 bps (2-yr) and -3 bps (30-yr).
News & Views
UK Chancellor Reeves presented the first Labour budget before Parliament today. A raft of tax increases is projected to raise some £40bn to boost spending on public services and to cover a £22bn fiscal “black hole”. It’s the biggest revenue-raising package in a generation, consisting of an increase in the Capital Gains Tax and in the national insurance payroll tax for businesses. Reeves also lowered the threshold at which companies start paying the latter. On spending, she raises minimum wages and pensions but income tax thresholds will not be frozen beyond 2028-29. Reeves pledged to raise defense spending to 2.5% of GDP. With the hefty tax increase, Reeves seeks to balance day-to-day spending with revenues. This stability rule is met in 2027-28, two years earlier than required. Reeves tweak to the debt measure the government uses for its long-term debt reduction target frees up $70bn in additional room to invest. The autumn Budget comes with new OBR forecasts. Growth for this year and the next was upgraded to 1.1% and 2% and will vary between 1.5% and 1.8% in the four years after. CPI will average 2.5% in 2024 before picking up to 2.6% in 2025 and only settling at 2% by 2029. The OBR said the “Budget increases spending by £70 billion annually, with two-thirds on current and one-third on capital spending. Half is funded through tax increases which raise £36 billion annually and push the tax take to a record 38% of GDP. The rest is funded by £32 billion more borrowing annually.” It speaks of one of the “largest fiscal loosening in recent decades.” The UK’s Debt Management Office also updated borrowing forecasts for the occasion. It raised planned gilt sales for 2024-2025 to just shy of £300bn. That’s up £20bn compared to the April revision but in line with expectations. UK bond markets needed some time to digest Reeves’ plans. Gilts sell off across the curve, pushing yields between 4-8 bps higher; the front end underperforming. Sterling lost ground and trades in the meantime at EUR/GBP 0.835.
BoJ to Stand Pat; Yen Under Pressure
- BoJ expected to leave rates at 0.25%
- Lowest inflation since April at 2.5%
- Yen dives to new 3-month low
- Decision comes out on Thursday at 03:00 GMT
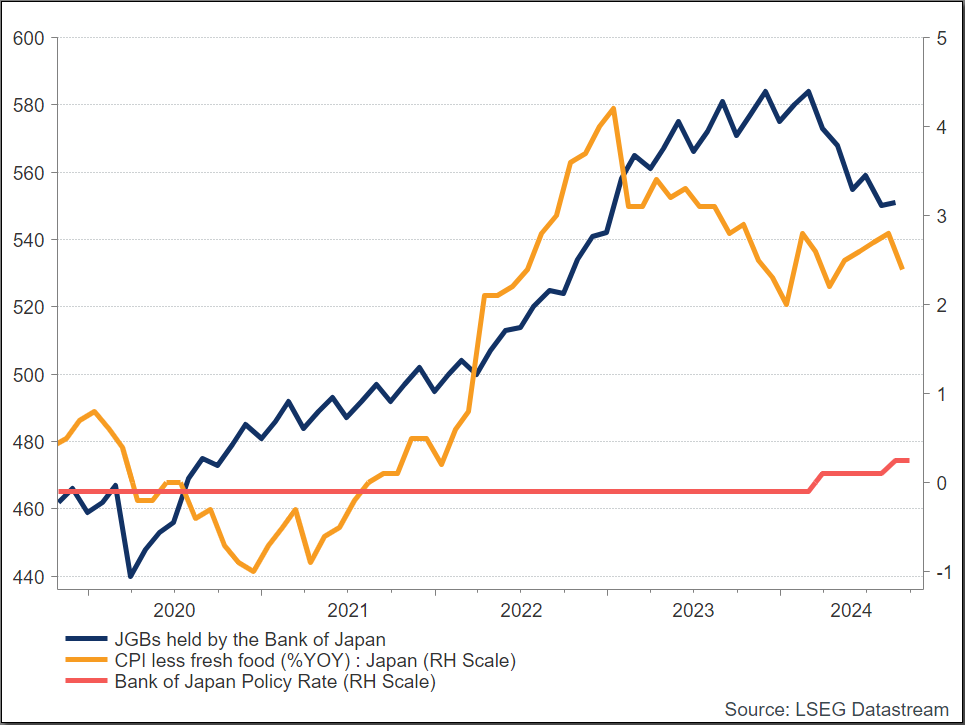
BoJ to leave rates unchanged
The Bank of Japan (BoJ) is anticipated to maintain its existing interest rates during the policy meeting on October 31. This decision reflects Governor Kazuo Ueda’s prudent strategy, highlighting the necessity to evaluate risks, especially those associated with the US economy and fluctuating markets. The Bank of Japan earlier terminated its negative interest rate policy in March and elevated its short-term policy target to 0.25% in July. Nonetheless, with inflation consistently near 2% and no imminent indications of escalation, the BoJ is not hastening to execute any rate increases.
Quarterly report
The Bank of Japan's quarterly report, which will feature updated GDP and inflation projections, is expected to offer insights into the timing of forthcoming interest rate increases. Analysts anticipate that the BoJ will emphasize risks, including sluggish global growth and market volatility, which may reduce the probability of a year-end rate increase. The post-meeting briefing by Governor Ueda will be scrutinized for indications concerning the speed and timing of forthcoming interest rate increases.
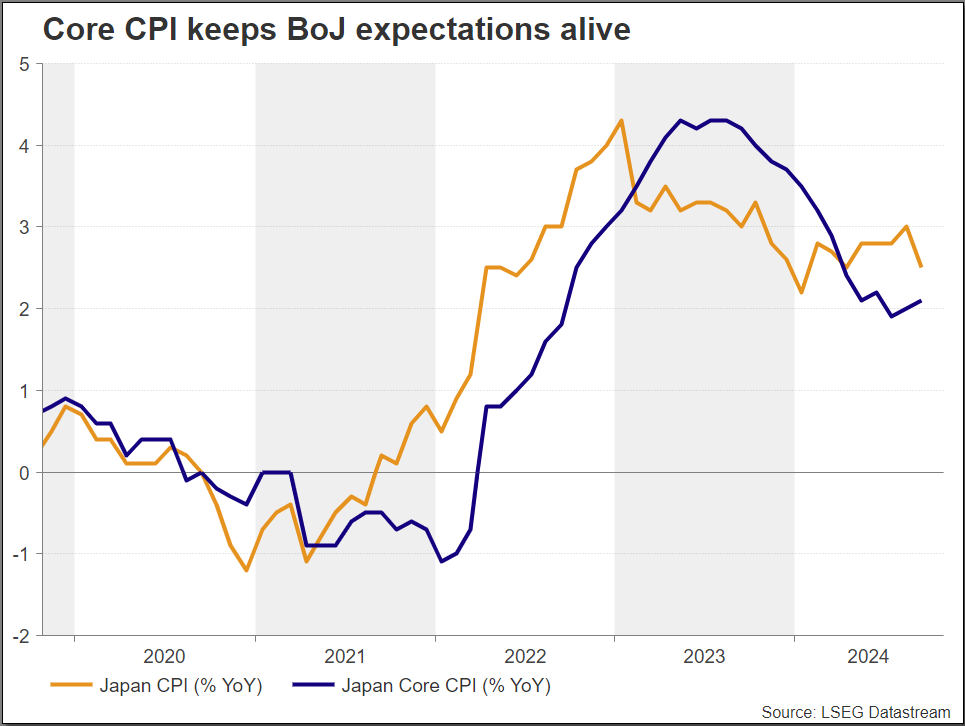
Inflation
As of September, Japan's annual inflation rate is 2.5%, a decrease from 3.0% in the preceding month. This signifies the lowest inflation rate since April. The decline is ascribed to subdued rises in electricity and gas prices, together with tempered expenses for food, furnishings, transportation, and cultural activities.
Japan's inflation rate has been comparatively low in relation to other G7 nations, attributable in part to government-imposed price controls, an elderly demographic, and negative interest rates. These elements have contributed to maintaining inflation stability amid global economic pressures.
Recent Elections and Political Landscape
The general election held on October 27, caused a notable transformation in Japan's political landscape. Prime Minister Shigeru Ishiba's governing coalition lost its majority in the lower chamber for the first time in 15 years. This loss has generated political uncertainty, hindering attempts to retract monetary stimulus. The election outcomes have compelled the ruling Liberal Democratic Party (LDP) to pursue coalitions with minor opposition parties to establish a government.
Economic Outlook for 2025
The economic forecast for Japan in 2025 is cautiously hopeful, as the International Monetary Fund (IMF) anticipates a small recovery fueled by growing real earnings and heightened consumption. Notwithstanding obstacles including supply chain interruptions and a waning influx from tourism, economic growth is anticipated. Important factors influencing this outlook include the anticipated increase in wages, which will boost household purchasing power and domestic demand, as well as the Bank of Japan's likely continuation of policy normalization, potentially leading to further interest rate hikes. Although headline inflation is anticipated to decelerate, core inflation may continue to be bolstered by increased wage growth. Moreover, political stability will be crucial, as prospective leadership changes may influence economic policies and investor confidence. Japan is shifting from stagnation to modest growth, helped by structural reforms and policy modifications.
Yen remains under pressure
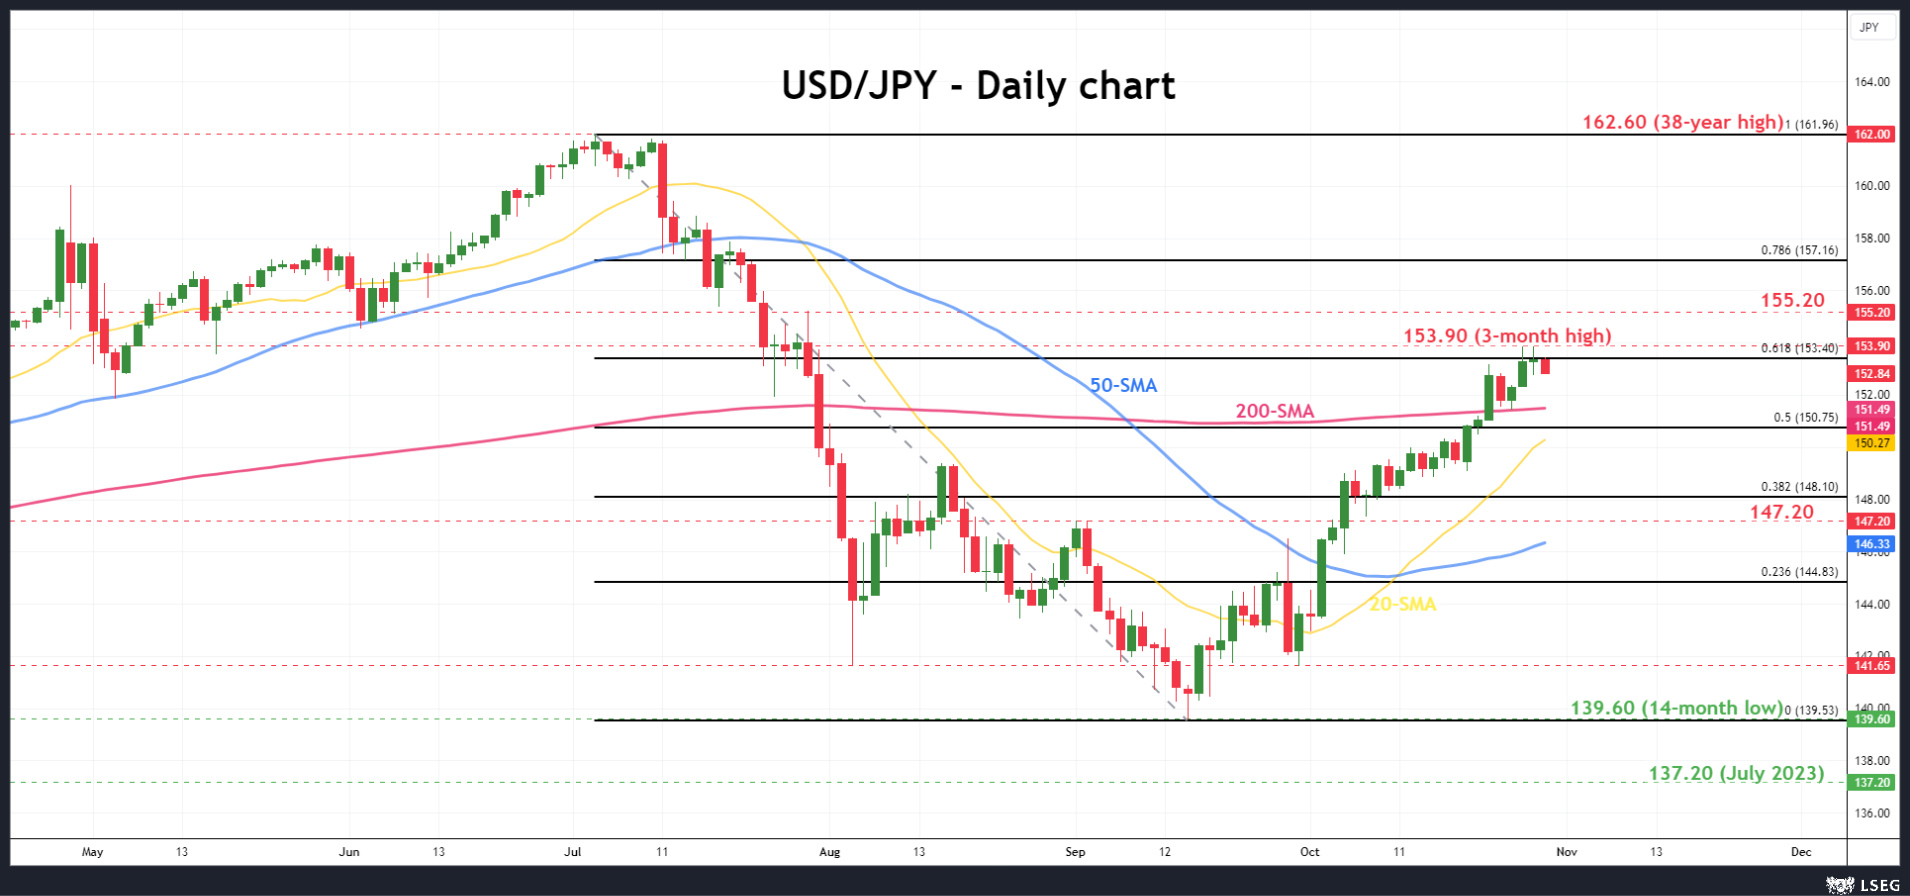
If the BoJ sustains its current interest rates, as anticipated, the yen may not experience substantial immediate fluctuations. Any indications of impending rate increases may bolster the yen as investors foresee enhanced profits on yen-denominated assets. The yen has lost more than 10% versus the dollar over the last one-and-a-half months.
The dollar/yen is holding slightly beneath the three-month high of 153.90 with strong resistance near the 61.8% Fibonacci retracement level of the down leg from 161.94 to 139.60 at 153.40. More gains could lead the market toward the 155.20 bar. Otherwise, a move south may drive the market toward the 200-day simple moving average (SMA) at 151.50.
Since there are no signs of raising interest rates any time soon, the yen will likely keep falling against the dollar. However, if the yen's value continues to decline, officials are likely to hike interest rates sooner rather than later.
USDCAD Rallies Near 22-Month Peak
- USDCAD in massive bullish run this month
- MACD and RSI hold in overbought areas
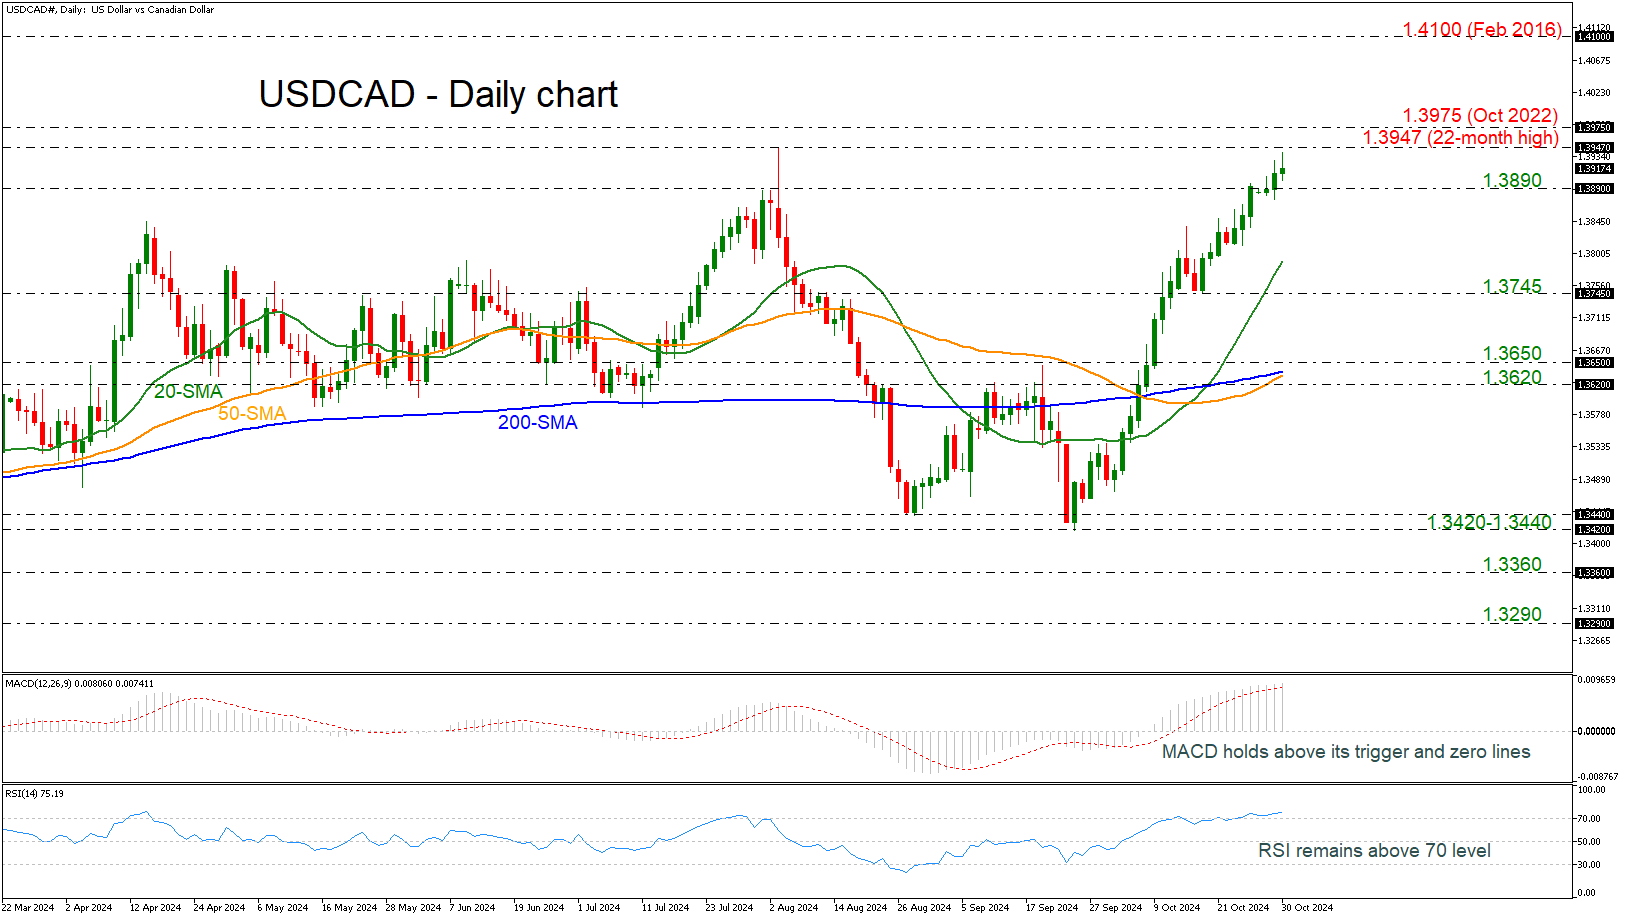
USDCAD added more than 3% so far this month, posting an incredible bullish rally with no notable bearish waves. The price is currently approaching the previous 22-month high of 1.3947 with the next resistance taking place at 1.3975, achieved in October 2022. Steeper bullish run could take the market until the 1.4100 psychological level, registered in February 2016. But traders need to be cautious at the 1.4000 handle first.
On the other hand, a bearish retracement beneath the 1.3890 support could send traders towards the 20-day simple moving average (SMA) at 1.3790 ahead of the 1.3745 bar. More important levels are coming within the area of 1.3620-1.3650, which encapsulates the 50- and 200-day SMAs.
From a technical perspective, the MACD oscillator is holding above its trigger and zero lines but looks to be losing some steam. The RSI indicator is still ticking higher in the overbought territory.
To conclude, USDCAD is gaining significant ground, erasing the downward wave from 1.3947 to 1.3440. A move beyond 1.3975 could endorse the bullish scenario in the broader outlook.
U.S. economic growth remains healthy on the eve of the election
The U.S. economy expanded by 2.8% quarter-on-quarter (q/q, annualized) in the third quarter, a touch lower than the consensus forecast of 3.0%.
Consumer spending accelerated at its fastest pace since the first quarter of 2023, rising 3.7% q/q. The gain was driven by a sharp rise in goods spending (+6.0% q/q), while spending on services grew by 2.6%.
Business investment rose 3.3% q/q, thanks to another strong quarterly gain in equipment spending (+11.1% q/q). Meanwhile, spending on structures fell by 4.0% q/q, while investment in intellectual property products was relatively flat – up just 0.7% q/q – for the second quarter in a row.
Residential investment (-5.1% q/q) remained a drag on Q3 growth, as both home sales and homebuilding came under further pressure alongside still elevated interest rates.
Government spending rose 5.0% q/q – its strongest quarterly gain in a year – largely stemming from an outsized gain in federal defense outlays (+14.9% q/q). State & local government spending (+2.3% q/q) was also higher last quarter.
On international trade, both imports (+11.2% q/q) and exports (+8.9% q/q) notched sizeable gains, but a larger increase in the former resulted in net trade subtracting 0.6 pp from GDP. Inventory investment (-0.2 pp) was also a small net drag on growth last quarter.
Final domestic demand was up a healthy 3.5% q/q, an acceleration from Q2's gain 2.8% q/q.
Core PCE inflation – the Fed's preferred inflation gauge – slowed to 2.2% q/q (annualized), a notable deceleration from Q2's 2.8%.
Key Implications
Another solid quarter for the U.S. economy, with underlying domestic demand pushing well above 3% and accounting for all of last quarter's growth. Beyond the housing market, there are very few signs that elevated interest rates are exerting any meaningful drag on domestic activity.
That said, economic growth is likely to round out the year on a softer note, as a further cooling in the labor market leads to some moderation in consumer spending. Equipment investment also looks poised for some giveback after two consecutive quarters of very healthy gains, while Q3's gain in federal defense spending is unlikely to repeated in Q4. We also can't forget that fourth quarter growth is likely to see some distortions stemming from hurricane's Helene and Milton, which have likely displaced some near-term activity across parts of the Southeast. However, history shows that the clean-up and rebuilding efforts that occur following a natural disaster tend to more than offset any lost output.
Bigger picture, the U.S. economy still looks poised to achieve a soft landing. Economic growth is expected to steady closer to 2% in 2025, while inflation is quickly closing in on the Fed's 2% target. This should allow the FOMC to continue gradually reducing its policy rate over the next year, and potentially have it return to closer to its long-run neutral rate of 3% by Q4-2025.
USD/JPY Mid-Day Outlook
Daily Pivots: (S1) 152.80; (P) 153.33; (R1) 153.92; More...
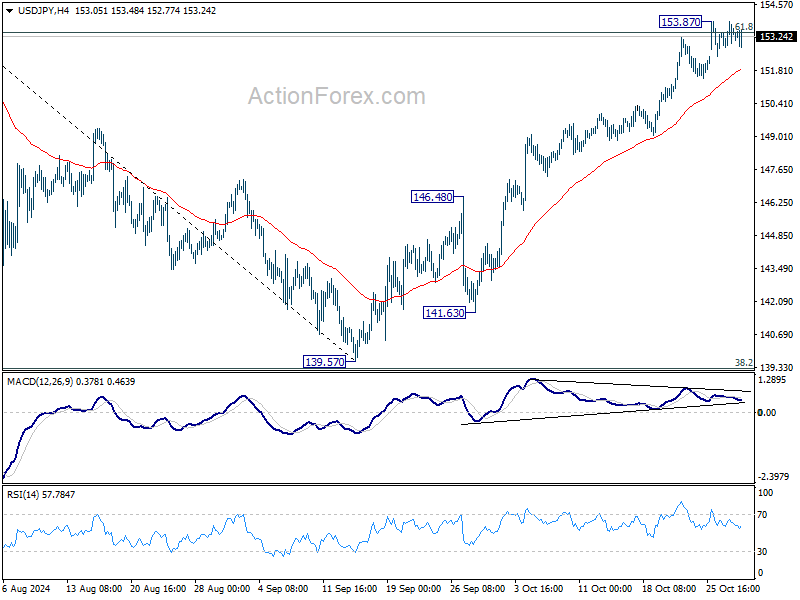
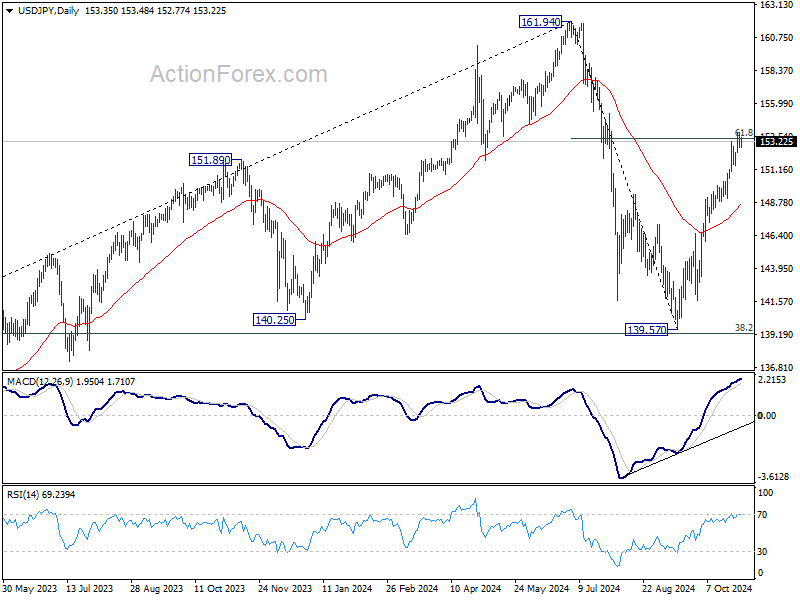
Intraday bias in USD/JPY is turned neutral first as consolidation from 153.87 is extending. Further rally is expected as long as 55 D EMA (now at 148.69) holds. Sustained trading above 61.8% retracement of 161.94 to 139.57 at 153.39 will pave the way to retest 161.94 high.
In the bigger picture, price actions from 161.94 are seen as a corrective pattern to rise from 102.58 (2021 low). The range of medium term consolidation should be set between 38.2% retracement of 102.58 to 161.94 at 139.26 and 161.94. Nevertheless, sustained break of 139.26 would open up deeper medium term decline to 61.8% retracement at 125.25.
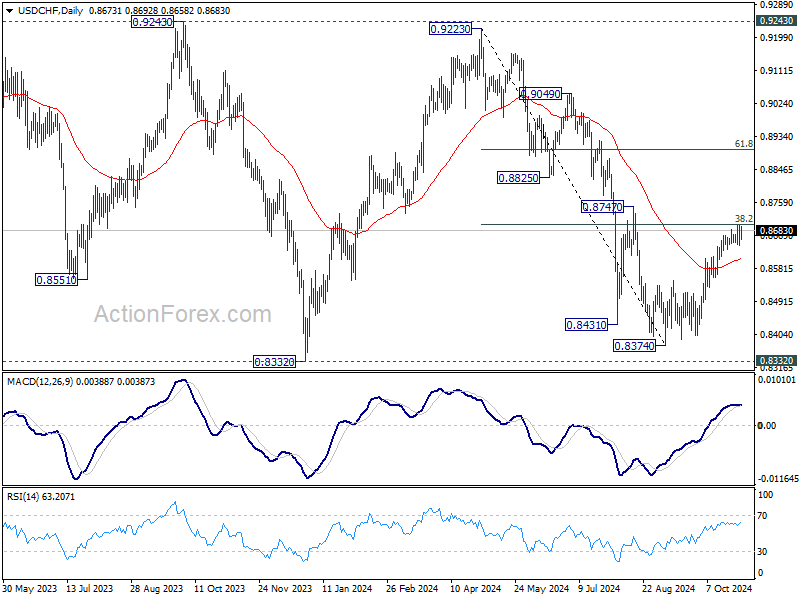
USD/CHF Mid-Day Outlook
Daily Pivots: (S1) 0.8646; (P) 0.8672; (R1) 0.8700; More…
Outlook in USD/CHF remains unchanged and intraday bias stays neutral for consolidation below 0.8699 temporary top. Further rally remains in favor as long as 55 D EMA (now at 0.8608) holds. On the upside, decisive break of 38.2% retracement of 0.9223 to 0.8374 at 0.8698 will argue that fall from 0.9223 has completed after defending 0.8332 low. Further rally should then be seen to 61.8% retracement at 0.8899 next.
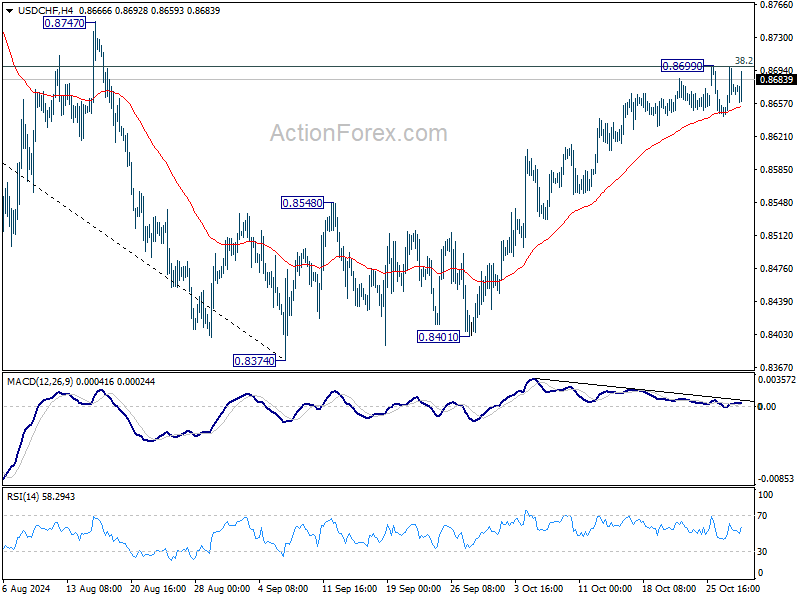
In the bigger picture, price actions from 0.8332 (2023 low) are currently seen as a medium term corrective pattern, with fall from 0.9223 as the second leg. Strong support could be seen from 0.8332 to bring rebound. Yet, overall outlook will continue to stay bearish as long as 0.9243 resistance holds. Firm break of 0.8332, however, will resume larger down trend from 1.0146 (2022 high).