Sample Category Title
Dollar Cools as Yields Stabilize, Gold Rally Loses Momentum
Dollar has started to ease after a strong rally this week, alongside US Treasury yields. While the greenback is consolidating gains against European majors and Yen, there’s little indication of a substantial pullback for now. Against commodity currencies, Dollar still holds potential for additional gains. Still, traders may avoid large moves ahead of the weekly close, aiming to lock in recent gains.
For the week so far, Dollar is maintaining its lead as the strongest currency, trailed by Swiss Franc and Canadian Dollar. Meanwhile, Yen remains under pressure, particularly with no strong signs of a bounce back before Japan’s snap elections on Sunday. New Zealand and Australian Dollars have also struggled amid weaker risk sentiment, and both may face further downside. Euro and Pound maintain middle-ground performance.
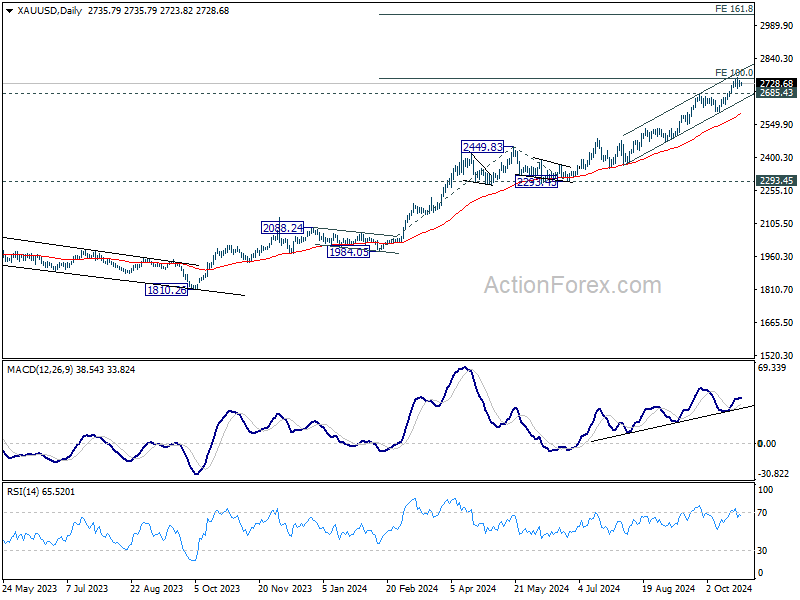
Technically, Gold's up trend stalled after hitting 100% projection of 1984.05 to 2449.83 from 2293.45 at 2759.23. Break of 2685.43 resistance turned support will confirm short term topping, and bring pullback towards 55 D EMA (now at 2596.31). Nevertheless, sustained break of 2759.23 will pave the way to 161.8% projection at 3047.82.
In Asia, at the time of writing, Nikkei is down -0.95%. Hong Kong HSI is up 1.10%. China Shanghai SSE is up 0.75%. Singapore Strait Times is down -0.60%. Japan 10-year JGB yield is down -0.0065 at 0.951. Overnight, DOW fell -0.33%. S&P 500 rose 0.21%. NASDAQ rose 0.76%. 10-year yield fell -0.0420 to 4.200.
BoJ's Ueda signals no immediate rate hike
BoJ Governor Kazuo Ueda indicated that the central bank is not in a hurry to adjust its monetary policy, stating after the G20 meeting in Washington, "I believe we have enough time" to make a decision. This suggests that BoJ will refrain from hiking interest rates in its upcoming meeting next week.
Ueda emphasized the importance of considering the broader economic context, including the effects of the weak Yen and uncertainties surrounding the US economy, which may be influenced by the upcoming US presidential election.
During the same press conference, Japan's Finance Minister Katsunobu Kato reiterated concerns over Yen's high volatility. He highlighted the need for close attention to fluctuations in the foreign exchange market.
Tokyo CPI core dips to 1.8% in Oct on lower energy prices
Japan's Tokyo CPI core (excluding food) dropped from 2.0% yoy to 1.8% yoy in October, slightly above market expectations of 1.7%. This marks the first time in five months that inflation has dipped below BoJ's 2% target. Headline CPI also slowed from 2.1% yoy to 1.8% yoy.
The deceleration was largely driven by a slowdown in energy prices, with government subsidies for energy costs contributing to a 0.51 percentage point reduction in the overall index.
Despite this, underlying inflationary momentum ticked up, as core-core CPI (excluding food and energy) rose from 1.6% yoy to 1.8% yoy. Services prices also saw an uptick, increasing by 0.8% yoy compared to 0.6% yoy in the prior month.
Looking ahead
German Ifo business climate is the main feature in European session, while Eurozone will release M3 money supply. Later in the day, Canada will publish retail sales and new housing price index. US will release durable goods orders.
AUD/USD Daily Report
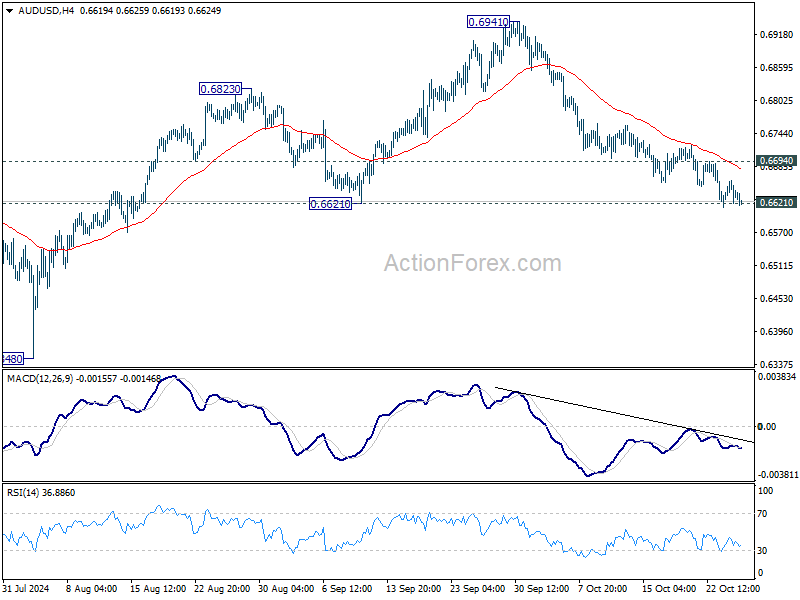
Daily Pivots: (S1) 0.6620; (P) 0.6641; (R1) 0.6660; More...
Intraday bias in AUD/USD remains on the downside for the moment. Firm break of 0.6621 support should confirm near term bearish reversal after topping at 0.6941. Deeper decline should then be seen to 0.6348 support next. On the upside, above 0.6694 minor resistance will turn intraday bias neutral first.
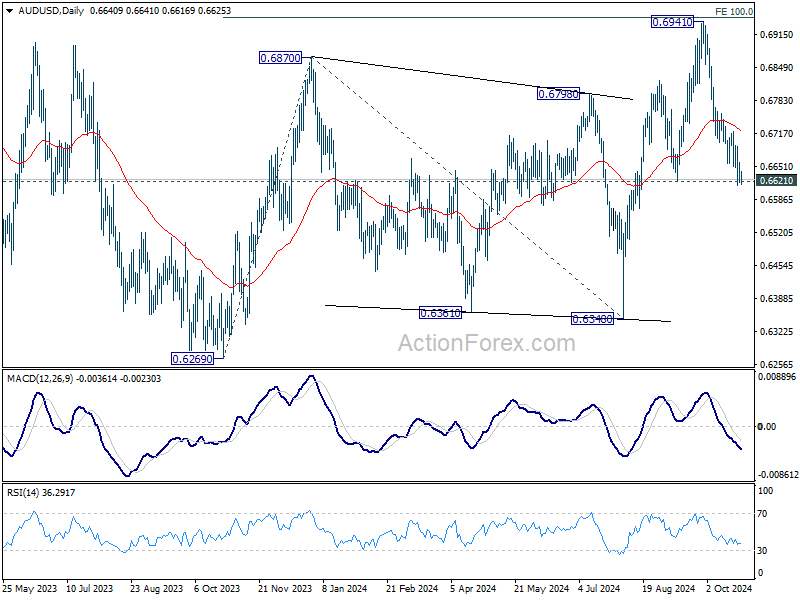
In the bigger picture, overall, price actions from 0.6169 (2022 low) are seen as a medium term corrective pattern, with rise from 0.6269 as the third leg. Firm break of 100% projection of 0.6269 to 0.6870 from 0.6340 at 0.6941 will target 138.2% projection at 0.7179. However, sustained break of 0.6621 support will argue that rise from 0.6269 has completed and bring deeper fall back to 0.6269/6348 support zone.
Cliff Notes: Calm Before the Storm
Key insights from the week that was.
In the absence of any major data or events in Australia this week, markets continued to ponder the likely timing and shape of the RBA’s easing cycle, eventually pricing in only about two and a half 25bp interest rate cuts by the end of 2025. These developments mirrored the modest changes in global sentiment, but the centre of the debate being on the question of ‘when’ locally versus ‘how fast’ and ‘how much’ interest rates are going to go down globally is a clear point of distinction.
Next week’s Q3 CPI update will prove critical in calibrating local market expectations. Our preview delves into the detail behind our expectations and forecasts for the forthcoming update. In summary, the full roll-out of cost-of-living rebates across the states are set to drive headline inflation back into the target band in Q3 – we forecast 2.9%yr. The RBA will instead be more focused on trimmed mean inflation, to the extent that it will provide a clearer gauge of the true underlying momentum of inflation. We anticipate a constructive development on this front too, with trimmed mean inflation forecast to ease from 3.9%yr in June to 3.5%yr in September.
Should the headline results and general composition from the data print broadly as we expect, we view the inflation dynamics as being most consistent with a February start to the rate cutting cycle. At a pace of 25bps per quarter, we anticipate the cash rate to reach a terminal rate of 3.35% by the end of next year. This end-point is predicated on our view that the global structure of interest rates will be higher than it was pre-pandemic. In this week’s essay, Chief Economist Luci Ellis discusses why reversion to pre-pandemic ‘norms’ might not necessarily be an appropriate baseline.
Late last week, China’s Q3 GDP data came in weak at 4.6%yr, well below the official government’s target. Monthly data for September showed some signs of activity picking up. Industrial production rose 5.4%yr supported by strong growth in chips and EV production. News on consumer spending was also positive, as retail sales accelerated to 3.2%yr, the highest since May, with the government subsidies for consumer goods providing a boost. Meanwhile, property investment and sales continue to decline in the double digits. Looking ahead, the Q4 data will be closely watched for impacts of the stimulus measures announced since late September, with a lift expected to provide the support needed for the economy to reach target growth.
In advanced economies, politics dominated the news flow. Opinion polls in the US suggested that Donald Trump was gaining momentum, with financial markets pricing USD and government bond yields higher. Political uncertainty also increased in Japan, as polls show that the ruling coalition led by the new Prime Minister Ishiba might struggle to secure a majority. This will be a huge departure from the norm as the Liberal Democratic Party has been in power most years since 1955, mostly recently having lost power in 2009. And in the UK, the focus remained on next week’s Budget announcement by the new Labour government, with news reports highlighting the significant challenges for public finances ahead.
Against that backdrop, the global PMIs for October showed that growth momentum in most major economies weakened at the start of Q4. In the euro area, the composite index remained in contractionary territory for a second month, and was down by 0.6pts from the Q3 average. The composite PMI in the UK fell to 51.7, the lowest level for nearly a year, and was consistent with quarterly UK GDP growth of only 0.1%qtr, which represents a sharp slowdown from the first half of this year. Meanwhile, the US PMIs stood out, implying firmer and more stable growth momentum despite the uncertainty ahead of the election. Indeed, the US composite PMI came in at 54.3, slightly higher compared to September levels, and unchanged from the Q3 average. But the FOMC’s Beige Book was more sanguine suggesting that the US economic activity was little changed from its July update. Negative impact from hurricanes to agriculture, tourism and the general business activity in the Southeast was noted, but employment was assessed to have increased slightly. Wage growth was described as modest, and most districts saw slight increases in selling prices.
South of the border, the Bank of Canada accelerated the pace of easing and lowered the target for the overnight rate by 50bp to 3.75%. In its communications, it highlighted that inflation returned to the 2% target falling significantly in the last few months, but lower interest rates are needed to maintain it at that level, in particular given concerns about the weakness in the underlying growth momentum.
USD/JPY Holds Strong on Dips: Will More Gains Follow?
Key Highlights
- USD/JPY extended gains above the 152.50 resistance zone.
- It broke a key rising channel with resistance at 151.20 on the 4-hour chart.
- Gold prices started a short-term downside correction after hitting a new all-time high at $2,758.
- EUR/USD and GBP/USD could attempt a recovery wave.
USD/JPY Technical Analysis
The US Dollar remained in a bullish zone above 148.00 against the Japanese Yen. USD/JPY cleared the 150.00 resistance to move into a positive zone.
Looking at the 4-hour chart, the pair settled above the 150.50 level, the 100 simple moving average (red, 4-hour), and the 200 simple moving average (green, 4-hour). The pair broke a key rising channel with resistance at 151.20.
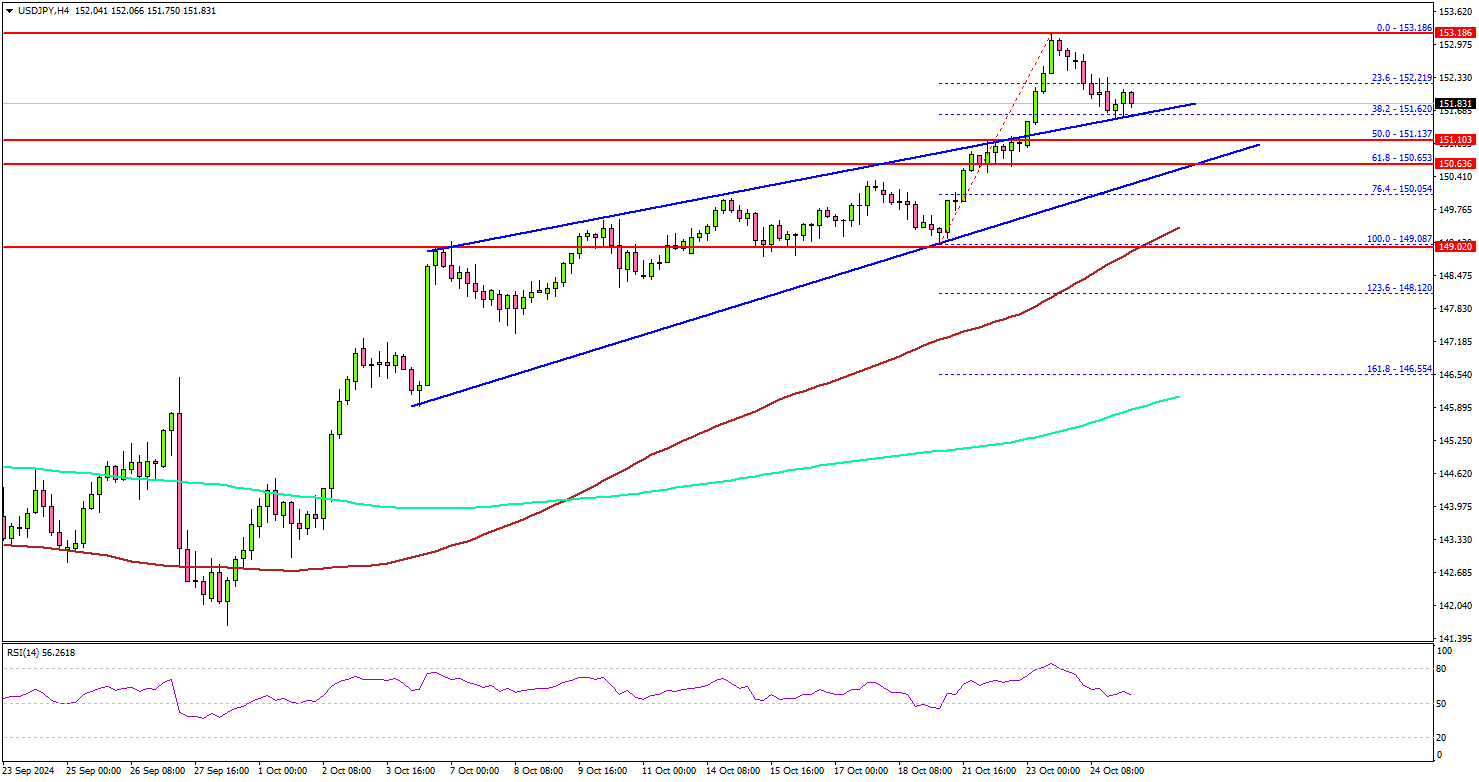
Finally, it surpassed the 153.00 level. A high was formed at 153.18 before there was a pullback. On the downside, immediate support sits near the 151.50 level.
The next key support sits near the 150.50 level. Any more losses could send the pair toward the 150.00 level. The main support sits near the 100 simple moving average (red, 4-hour) at 149.10.
On the upside, the pair could face resistance near the 152.80 level. The first key resistance is near the 153.20 level. A close above the 153.20 level could set the tone for another increase. The next major resistance could be 153.50, above which the price could accelerate higher toward the 155.00 level.
Looking at EUR/USD, the pair declined toward the 1.0765 zone and might attempt a recovery wave in the near term.
Upcoming Economic Events:
- US Durable Goods Orders for Sep 2024 – Forecast -0.9% versus 0% previous.
- Michigan Consumer Sentiment Index for Oct 2024 (Prelim) – Forecast 69.0, versus 68.9 previous.
Tokyo CPI core dips to 1.8% in Oct on lower energy prices
Japan's Tokyo CPI core (excluding food) dropped from 2.0% yoy to 1.8% yoy in October, slightly above market expectations of 1.7%. This marks the first time in five months that inflation has dipped below BoJ's 2% target. Headline CPI also slowed from 2.1% yoy to 1.8% yoy.
The deceleration was largely driven by a slowdown in energy prices, with government subsidies for energy costs contributing to a 0.51 percentage point reduction in the overall index.
Despite this, underlying inflationary momentum ticked up, as core-core CPI (excluding food and energy) rose from 1.6% yoy to 1.8% yoy. Services prices also saw an uptick, increasing by 0.8% yoy compared to 0.6% yoy in the prior month.
BoJ’s Ueda signals no immediate rate hike
BoJ Governor Kazuo Ueda indicated that the central bank is not in a hurry to adjust its monetary policy, stating after the G20 meeting in Washington, "I believe we have enough time" to make a decision. This suggests that BoJ will refrain from hiking interest rates in its upcoming meeting next week.
Ueda emphasized the importance of considering the broader economic context, including the effects of the weak Yen and uncertainties surrounding the US economy, which may be influenced by the upcoming US presidential election.
During the same press conference, Japan's Finance Minister Katsunobu Kato reiterated concerns over Yen's high volatility. He highlighted the need for close attention to fluctuations in the foreign exchange market.
What’s Normal, Anyway?
From debt ratios to interest rates to unemployment, simple averages of the past are often not a good guide to where things are headed.
One of the frustrations of the post-GFC period was the way some people (and international agencies) assumed that historical averages of key ratios like housing prices or debt to income defined ‘normal’. If one of these macro ratios was well away from that historical average, it was an ‘imbalance’ that needed to be corrected, it was claimed.
The problem with this idea is that often the metric in question does not have a ‘right’ level that prevails through time. In the case of the economy-wide ratio of household debt to income, the sustainable ratio is higher in recent decades than it was back in the 1970s and 1980s. If inflation – and so nominal interest rates – falls permanently, the sustainable debt-to-income ratio rises, because households can service a larger loan with the same repayment. Financial deregulation also removed other artificial constraints on borrowing that prevailed back then.
This point has been well understood for more than 20 years, having been written about by various RBA staff members (including me) all those years ago. Yet still one hears concerned comments that once upon a time you could only borrow four times income, and now you can borrow a much higher multiple. And it’s true, because once upon a time inflation averaged 6–8% and mortgage rates were double-digit, but not anymore.
The misunderstanding was even more frustrating because, often, the historical averages used were based on data sets that went back to 1980. Since Australia was later to join the low-inflation club than many of its peers, more of the period since 1980 was in that high-inflation-low-debt era. That drags the historical average lower, making the recent data look higher in comparison than for other countries that already had inflation down by the early 1980s. That Australia looks ‘worse’ on these metrics is mainly a statistical artefact.
There is a broader point here: historical averages do not always represent centres of gravity to which the world must somehow return. Many of the metrics in question are emergent properties of the economic system and not bound to return to a particular number. We have made this point before, regarding the structure of interest rates globally and the sustainable level of the unemployment rate.
Part of the issue is that even if people behave similarly to the past, the macro-level averages and ratios that come out of that behaviour might not be the same as in the past. The composition of the population might have changed, or some other factor that changes the macro-level outcome. Certainly, the age structure of the population has changed. Population growth rates also do not stand still; in Australia, population growth has been noticeably faster post-GFC than pre-GFC. This has implications not only for labour market variables, but also things like the required rate of home-building each year.
Things aren’t the same after a shock
The question of where ‘normal’ is becomes especially salient when you are coming out of a large shock like a pandemic. It is tempting to look at the pre-pandemic period as the benchmark for where things are likely to return, but this is probably a mistake.
The reality is that the pre-pandemic period wasn’t ‘normal’ either. There was considerable labour market slack in Australia at the time. Wages growth consistently undershot RBA and other forecasts. Inflation lagged below target despite what appeared to be very expansionary monetary policy.
There was something going on beyond the national level, too. Many peer economies were finding that unemployment rates could decline to levels not seen in decades without wages growth or inflation picking up materially. Global rates and risk spreads were also far from normal, compressed to extreme levels. If someone had told me at the beginning of my career that large parts of the European corporate bond universe would have negative nominal yields for a sustained period, I would never have believed them.
Another decidedly non-normal feature of the period between the GFC and the pandemic was that business investment in many advanced economies (including Australia) lagged historical averages. So did trend productivity growth. These trends were probably related, with some researchers hypothesising that this was a consequence of the financial crisis, and the associated weak demand and debt overhangs.
The upshot is that the global economy had probably barely completed the adjustment to the previous big shock, the GFC, before being hit by the next one, the pandemic.
Make the trend your friend
How can you forecast, or even interpret current events, when the ground is shifting in this way?
One approach is to focus on the underlying behaviour at a more micro level and let the implications for macro variables flow from that. For example, forecasts of consumption are typically based on past experience of people’s spending responses to additional income. This approach won’t always predict actual outcomes: as Westpac Economics colleague, Economist Jameson Coombes reported yesterday, the recent data from the Westpac–DataX Consumer Panel is pointing to a smaller spending response to the Stage 3 tax cuts than the historically typical response. But it is better than playing chartist with macroeconomic ratios by assuming that consumption reverts to a ‘normal’ share of income.
It is also useful to factor in any longer-term trends that are in evidence. The trends in the labour market are a case in point. In addition to the stronger average population growth, the participation rate has been trending up for decades and this shows no signs of ending.
If population growth is stronger than it used to be in decades past, then employment growth needs to be higher to keep pace, too. And if the participation rate is trending up, employment growth needs to outpace working-age population growth to avoid rising unemployment. Some observers have interpreted recent rapid growth in employment as a sign that the labour market is still strong. But it could equally be viewed as being insufficient to keep pace with the even faster growth in labour supply.
It all depends on what your view of normal is.
Navigating the Next Chapter: US Stock Market Outlook Amidst Economic Indicators and Global Risks
The US stock markets have steadily climbed since the 2008 financial crisis, achieving a remarkable 740% growth between 2009 and 2024. This upward trajectory, while occasionally disrupted by events like COVID-19 and the Ukraine War, has consistently rebounded, defying recession predictions and showcasing market resilience. The S&P 500’s performance since 2008 is illustrated in the chart below, highlighting some of key events that potentially impacted the market. Despite these events, the upward trend has persisted through various political administrations, fiscal policies, and fluctuating interest rates.
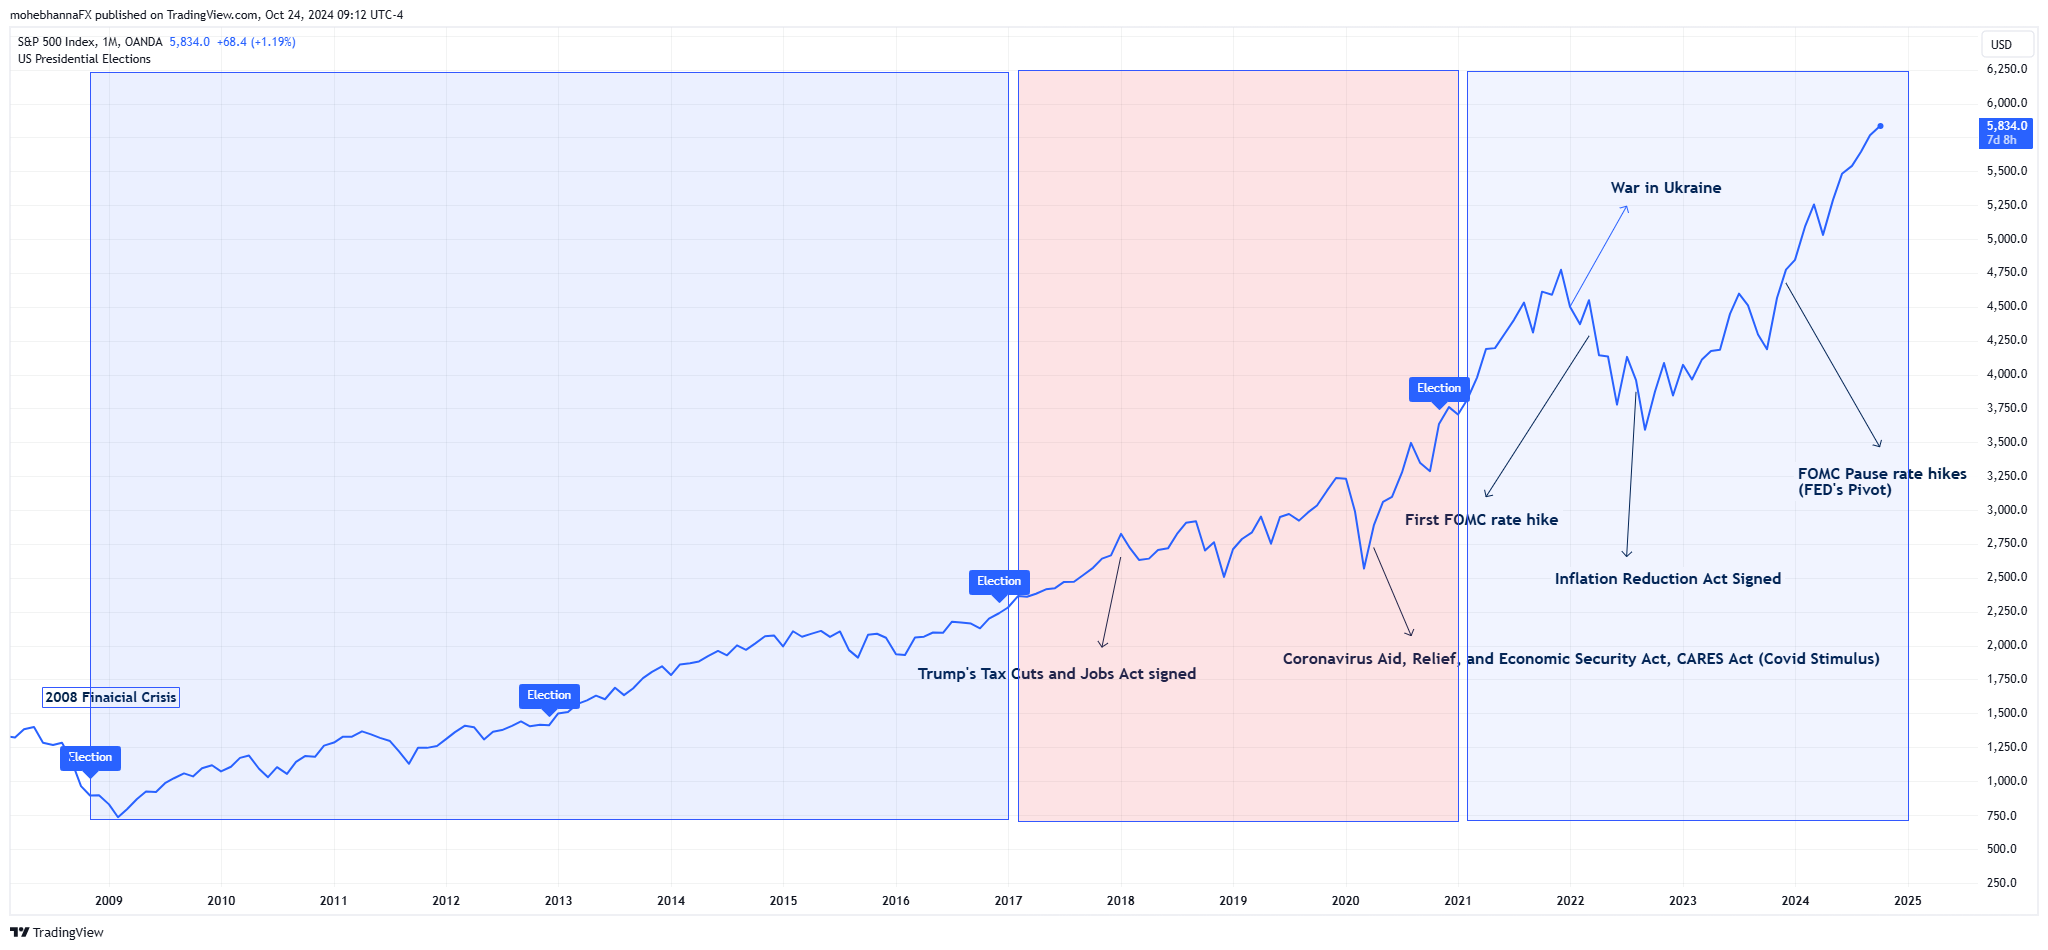
Source: Tradingview.com
The Equity markets in general are driven by multiple different factors, some of the main drivers are a sector’s performance, company’s earnings, potential future growth, how much investors value a stock and are willing to pay for it. However, businesses need a friendly economic environment to thrive, and the overall health of the US economy can have a major impact on businesses which is then reflected onto the stock market indices such as the S&P 500.
What are some of the key economic indicators to gauge the health of the US economy?
By monitoring these indicators, market participants can gain a better understanding of the economy’s current state and potential future direction, which helps them make informed investment decisions.
Inflation
Inflation is the general increase in the prices of goods and services over a period of time, higher inflation reduces the spending power of a currency over the long term and can significantly impact economic growth.
- Firstly, when inflation is high, businesses often face higher interest rates on loans. This is because lenders typically adjust interest rates to reflect the increasing cost of living. Higher interest rates make it more expensive for businesses to borrow money, which can limit their ability to invest in new projects, expand operations, or hire more employees. As a result, businesses may experience slower growth or even be forced to scale back their operations.
- Secondly, inflation also affects consumer spending. When prices rise, consumers may have less disposable income as a larger portion of their budget goes toward essential expenses such as housing, food, and transportation. This can lead to consumers becoming more selective with their spending, opting for cheaper alternatives or postponing non-essential purchases. As a result, businesses that rely on consumer spending may experience a decline in sales and revenue, further impacting overall economic growth.
- Additionally, inflation can disrupt long-term planning and investment decisions, as businesses and individuals become more uncertain about the future value of money. This uncertainty can lead to a reluctance to commit to major projects or investments, further slowing down economic growth.
- Therefore, policymakers and central banks often prioritize controlling inflation to maintain stable economic conditions and foster sustainable growth. Measures such as raising interest rates, adjusting monetary policies, and implementing targeted interventions may be employed to curb inflation and mitigate its negative effects on businesses and consumer spending.
In the US, the Federal Reserve’s inflation target rate is 2%, this percentage can stimulate spending which keeps the economy growing. However, if inflation is higher than wage growth, it can be a sign of a struggling economy.
The US Consumer Price Index is an economic indicator that measures inflation in the US, it measures the average change over time in the prices paid by urban consumers for a market basket of consumer goods and services. The indicator comes in different forms, the Core CPI provides data that excludes volatile components like energy and food products. Other inflation indicators are also watched closely by traders such as Core Personal Consumption Expenditure (Core PCE) , the FED’s preferred inflation gauge.
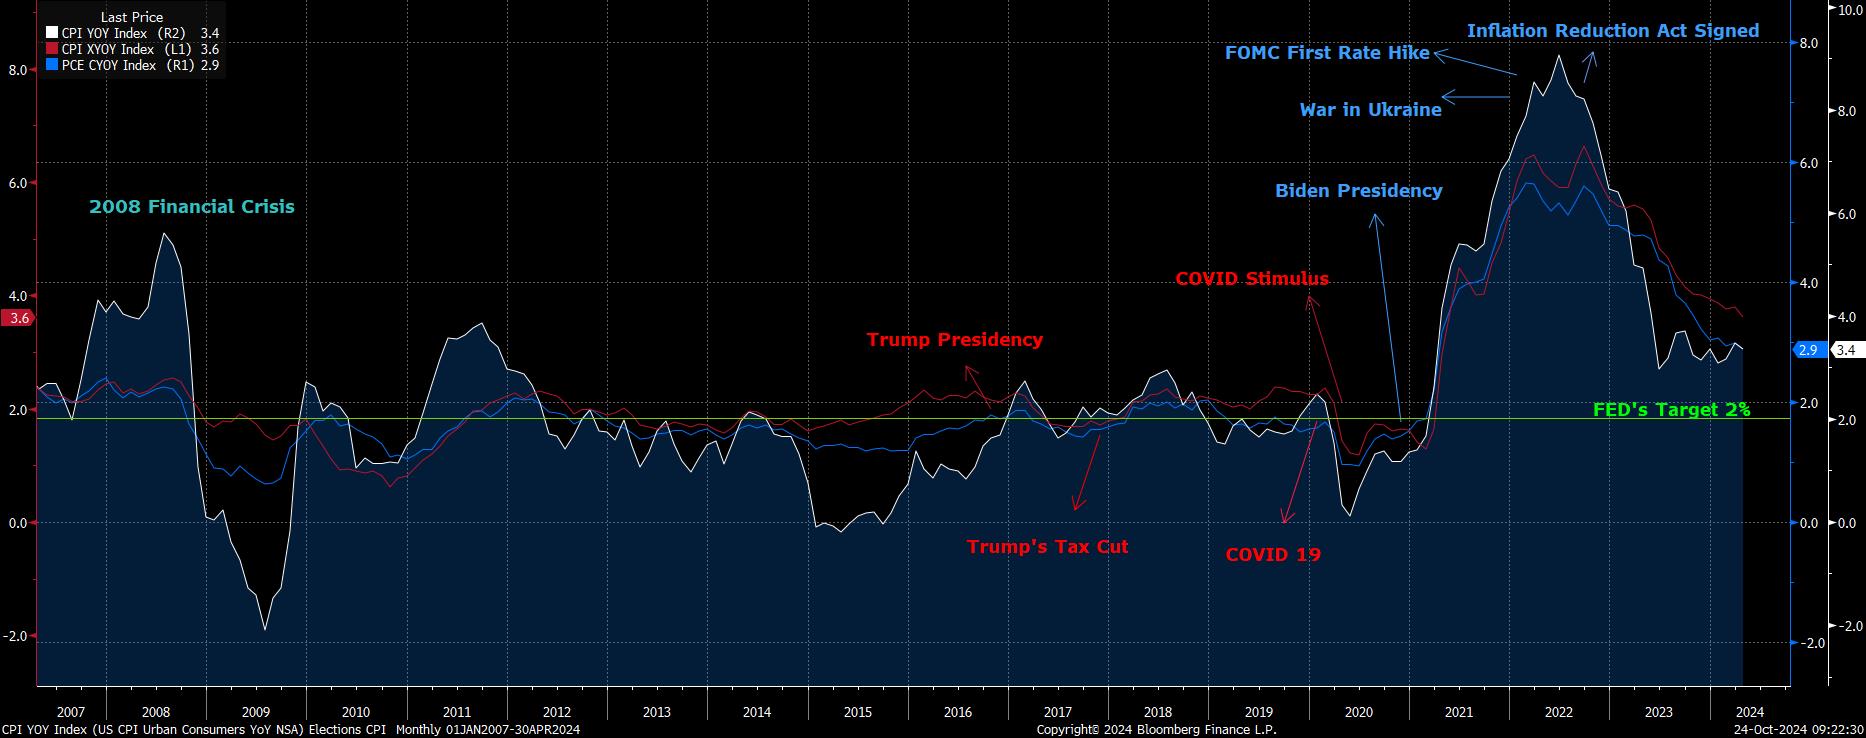
Source: Bloomberg Terminal
As indicated on the above chart, the US CPI has been fluctuating around the 2% level from 2008 till early 2021, in some cases, it was as low as -2.0% and as high as 5.0%, mostly affected by the impact of the 2008 financial crisis as well as the sharp swings in energy prices, however, the Core CPI and Core PCE remained stable around the 2.0% level for the same period.
Following the COVID19 Pandemic, global inflation rose significantly, CPI reached 9.1%, Core CPI 6.6% and Core PCE 5.6%. In March of 2022, the Federal Reserve raised interest rates for the first time since 2018 and continued its interest rate hike path up to 5.25% – 5.5% range. The US CPI is currently at 3.4%, Core CPI at 2.9% and Core PCE at 2.6%
As inflation began and continued to decline over the past 2 years. The FED pivoted in December of 2023, stopped raising rates and kept the markets on hold anticipating the FED’s first rate cut which took place on September 18th, 2024 when the FED cut interest rates by 50 basis points, setting the current FED Funds Rate at the range of 4.75% – 5.0%.
According to Bloomberg’s Analysts surveys, economists see US Inflation reaching the Federal Reserve’s target early next year, the surveys show that the PCE gauge averaging 2.1% in early 2025.
Job Market Data
Job market data includes employment figures and unemployment rates, which indicate the strength of the labor market and the overall economic health. Traders in general pay attention to Non-Farm Payrolls and Unemployment Rate.
The Non-Farm Payrolls (NFP) is a key economic indicator that measures the number of jobs added or lost in the US economy, excluding the farming sector. Following the spikes in job numbers caused by COVID19, the Non-Farm payroll figures continued to beat expectations over the past few years, reflecting the strength of the US economy as more jobs were added. However, the number of added jobs has recently stabilized, sending warnings of a potential slow down.
The Unemployment Rate currently hovers around 4.1%, its latest reading for September 2024. Over the past few years, and as the world was getting out of COVID restrictions, the unemployment rate in the USA declined to some of its historic lowest levels reaching 3.4%, reflecting the strength of the US economy and supporting a slower FED in its rate cut path.
FOMC – Monetary Policy and Interest Rates
The Federal Reserve’s interest rate policy affects the US economy by influencing borrowing costs, spending, and investment. Lower interest rates encourage borrowing and spending, stimulating economic growth. Conversely, higher interest rates can slow the economy by making borrowing more expensive. The Federal Reserve uses its interest rate policy to manage inflation and promote economic stability.
The FED, same as other global central banks, have said multiple times that any interest rate decisions will be data dependent, and that the FED continues to monitor the markets closely, aiming to keep inflation under control within a sustained economic growth environment.
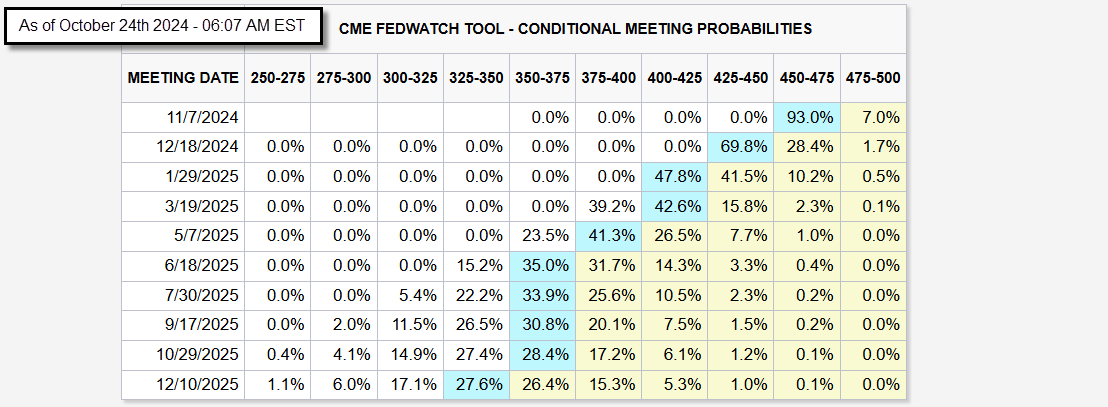
Source: CME Group
The next upcoming FED meetings for 2024 and early 2025 are scheduled for November 7th, 2024, December 18th, 2024 and January 29th, 2024. According to the most recent review of the CME FedWatch tool, market participants still anticipate an average of three x 25 basis point interest rate cuts between November 7th, 2024, and January 29th, 2025, however, at lesser percentages than seen in prior weeks. For the November 7th, 2024, meeting, the percentage of participants expecting a 25-basis point rate cut stands at 93.0%, while those expecting rates to remain on hold stands at 7.0%. As for the December 18th, 2024, Fed’s meeting, the percentage of a further 25-basis points rate cut currently stands at 69.8%.
What are the potential risks facing the US stock market in the current market environment?
Some examples of the potential risks may include but are not limited to:
- Interest Rate Uncertainty: The market is divided on future Fed rate cuts, causing uncertainty and potential volatility.
- Economic Data Sensitivity: Upcoming data releases could cause market reactions if they deviate from expectations.
- Political Pressure: The US elections risk, and the fact that some politicians were calling for more aggressive rate cuts, which could influence the market sentiment around the FED decisions.
- Global Factors: The potential impact of global events on the US stock market.
Remember, these are just some potential challenges. The market is constantly influenced by a wide range of other major factors such as companies earnings, growth as well as many other factors.
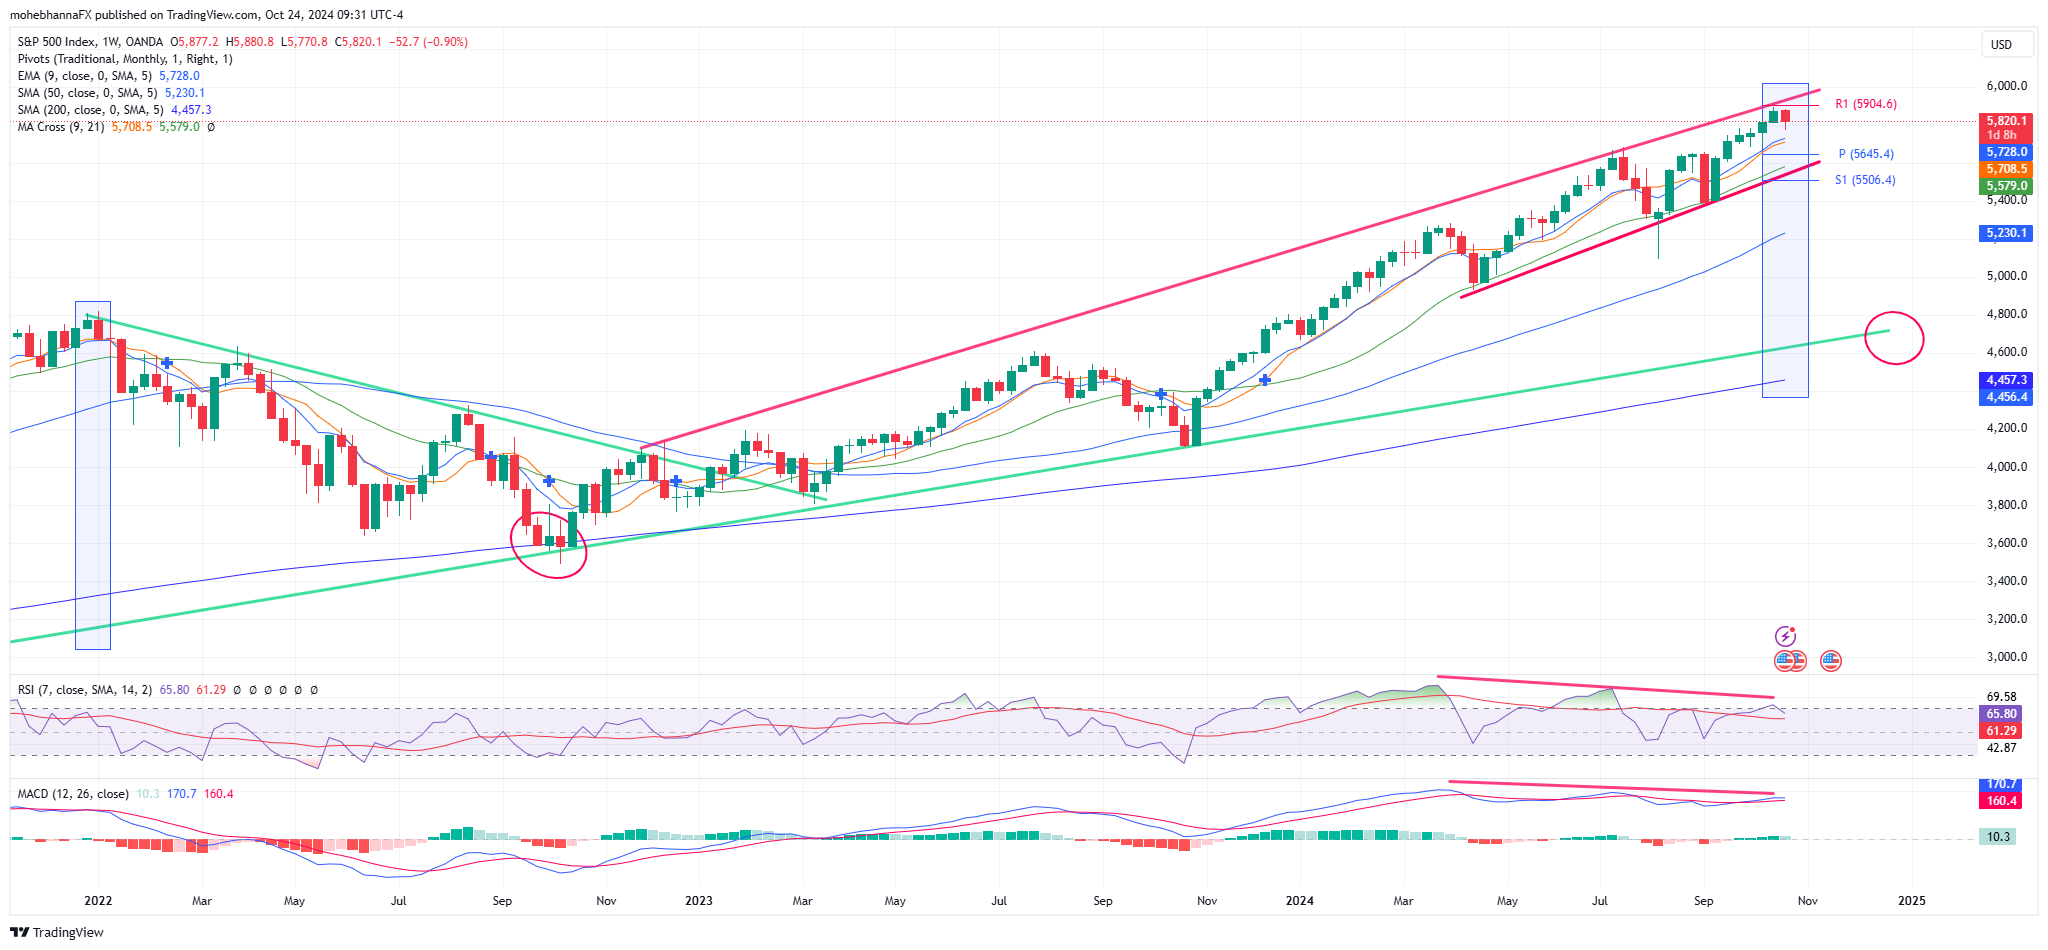
Technical Analysis SPX500 Weekly Chart
Source: Tradingview.com
- As previously mentioned, the S&P 500 Index has been in an uptrend since the markets got out of the financial crisis in 2008, the long term uptrend faced multiple hiccups along the way, however, the index was able to resume its uptrend reaching historic highs.
- The MACD indicator reflects that the price action deviation from its moving averages has remained near its widest points for an extended period, and currently has a negative divergence to price action for the later part of the uptrend, suggesting weakness in the ongoing trend, marked by the red lines. The MACD line remains above the signal line, however, it is yet to break below it.
- Price action is currently finding resistance along its Monthly R1 standard calculation of 5904, a weekly close price near the 5780 area, will complete a bearish engulfing candle on the weekly timeframe.
- A confluence of support lies below the price, represented by the EMA9 and the SMA9 intersecting with the monthly pivot point 5645.4, a second confluence of support lies below, represented by the SMA21, the redline lower channel border and the monthly S1 standard calculation of 5506.4.
Market Sentiment – COT
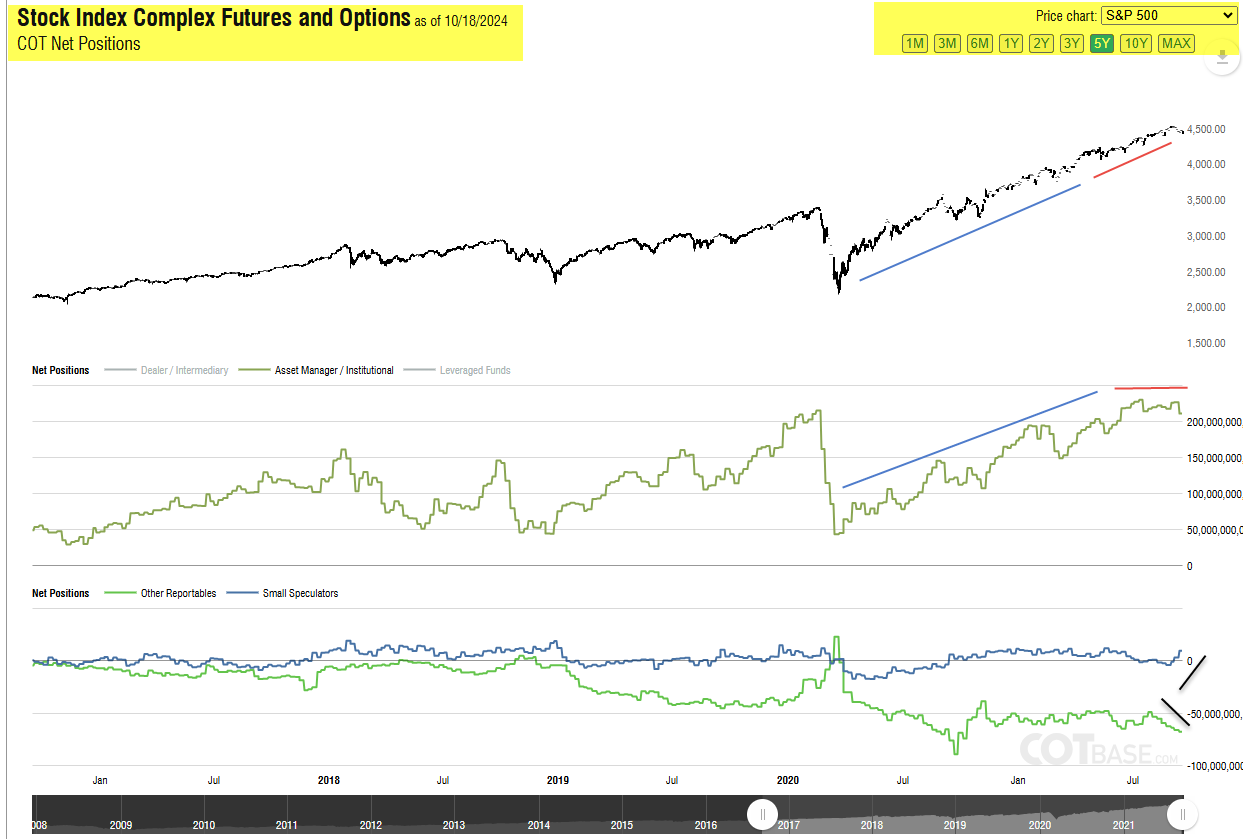
Source: cotbase.com
The COT report for the week ending on Friday, October 18th, 2024 (Includes data up to the end of day Tuesday, October 15th, 2024) reflects the following:
- Asset Manager/Institutional position levels have been in line with price action since early 2020 (Blue lines). However, as the long position level historic extremes were reached, a negative divergence can be seen between price action and Asset Manager/Institutional positions. Price action is making higher highs, while Asset Manager/Institutional’ long positions are making lower highs (Red lines), suggesting a potential change in sentiment.
- The latest COT report also reflects a discrepancy, the positions data reflects that Other Reportables are moving towards sell while the Small Speculators category are moving towards long.
In conclusion, the US stock market’s future trajectory is contingent upon a multitude of factors, including economic indicators, Federal Reserve policy, and global events. While the market has demonstrated resilience in the face of past challenges, investors must remain vigilant and adaptable in this evolving landscape. By carefully considering economic data, technical analysis, and market sentiment, investors can position themselves to navigate the next chapter of the US stock market with greater confidence.
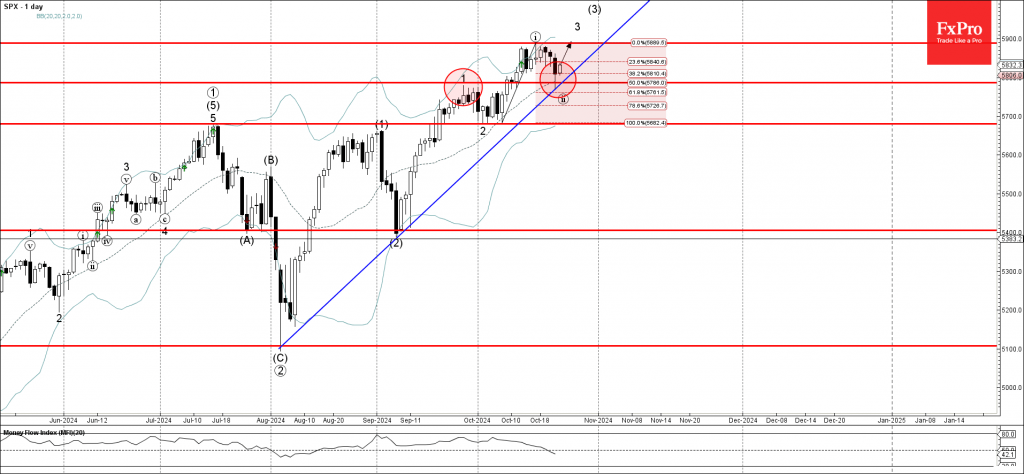
S&P 500 index Wave Analysis
- S&P 500 index reversed from support zone
- Likely to rise to resistance level 5900.00
S&P 500 index recently reversed up from the support zone located between the key support level 5785.00 (former top of wave 1 from September), 20-day moving average and the 50% Fibonacci correction of the upward impulse from the start of October.
The upward reversal from this support zone is likely to form the daily Japanese candlesticks reversal pattern Morning Star Doji.
Given the clear daily uptrend, S&P 500 index can be expected to rise toward the next resistance level 5900.00 (which reversed the index earlier this month).
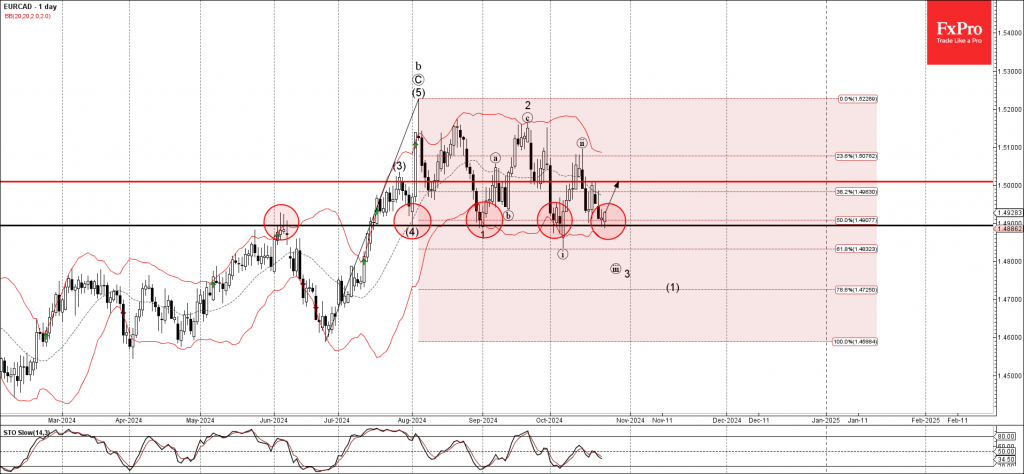
EURCAD Wave Analysis
- EURCAD reversed from support zone
- Likely to rise to resistance level 1,5000
EURCAD currency pair recently reversed up from the support zone located between the key support level 1.4900 (former resistance from June), lower daily Bollinger Band and the 50% Fibonacci correction of the upward impulse from June.
The upward reversal from this support zone is likely to form the daily Japanese candlesticks reversal pattern Morning Star Doji.
Given the strength of the aforementioned support zone, EURCAD currency pair can be expected to rise toward the next resistance level 1,5000 (which reversed the price in the middle of this month).