Sample Category Title
Tokyo Core CPI Complicates BoJ’s Rate Plans
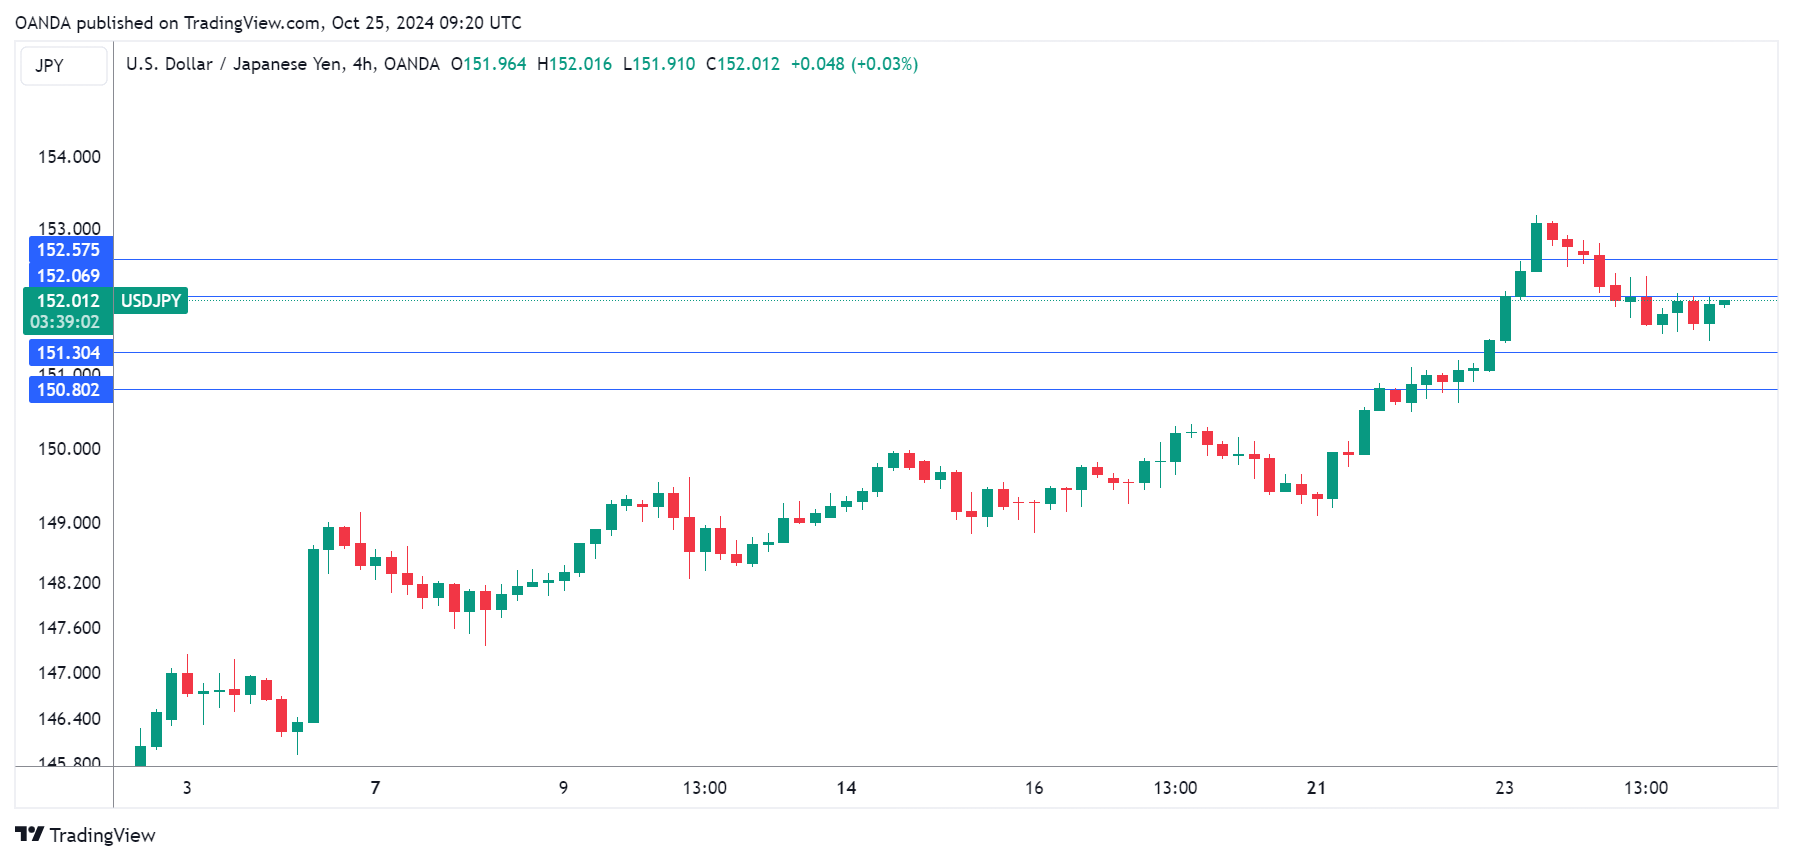
The Japanese yen is showing limited movement on Friday. In the European session, USD/JPY is trading at 151.94, up 0.09%.
Tokyo Core CPI falls below BoJ’s target
Tokyo Core CPI, a leading indicator of inflation trends in Japan, fell to 1.8% y/y in October, down from 2% in September and just above the market estimate of 1.7%. This marked a second straight deceleration and was the lowest level since April. A key service inflation indicator also slowed in October, dropping from 2.7% to 2.6%, a four-month low.
The decline in inflation is a disappointment for the Bank of Japan, which wants to see inflation remain sustainable around its 2% target before its raises interest rates on the path towards normalization. The BoJ meets next week and is expected to maintain rates. The central bank will release growth and inflation forecasts which could provide insights into future monetary policy. The cautious BoJ is unlikely to raise rates until early next unless inflation reverses its current downtrend and pushes higher.
The US wraps up the week with core durable goods orders and UoM consumer sentiment. The manufacturing sector has contracted for four straight months and core durable goods orders are expected to fall 1% in September, after no change in August. The UoM consumer sentiment index is expected to fall to 68.9 in October, compared to 70.1 a month earlier. Consumers are unhappy about high inflation and there is uncertainty over the US election, with an extremely tight race between Donald Trump and Kamala Harris.
USD/JPY Technical
- USD/JPY is testing resistance at 1.5207. The next resistance line is 152.58
- 151.30 and 150.79 are providing support
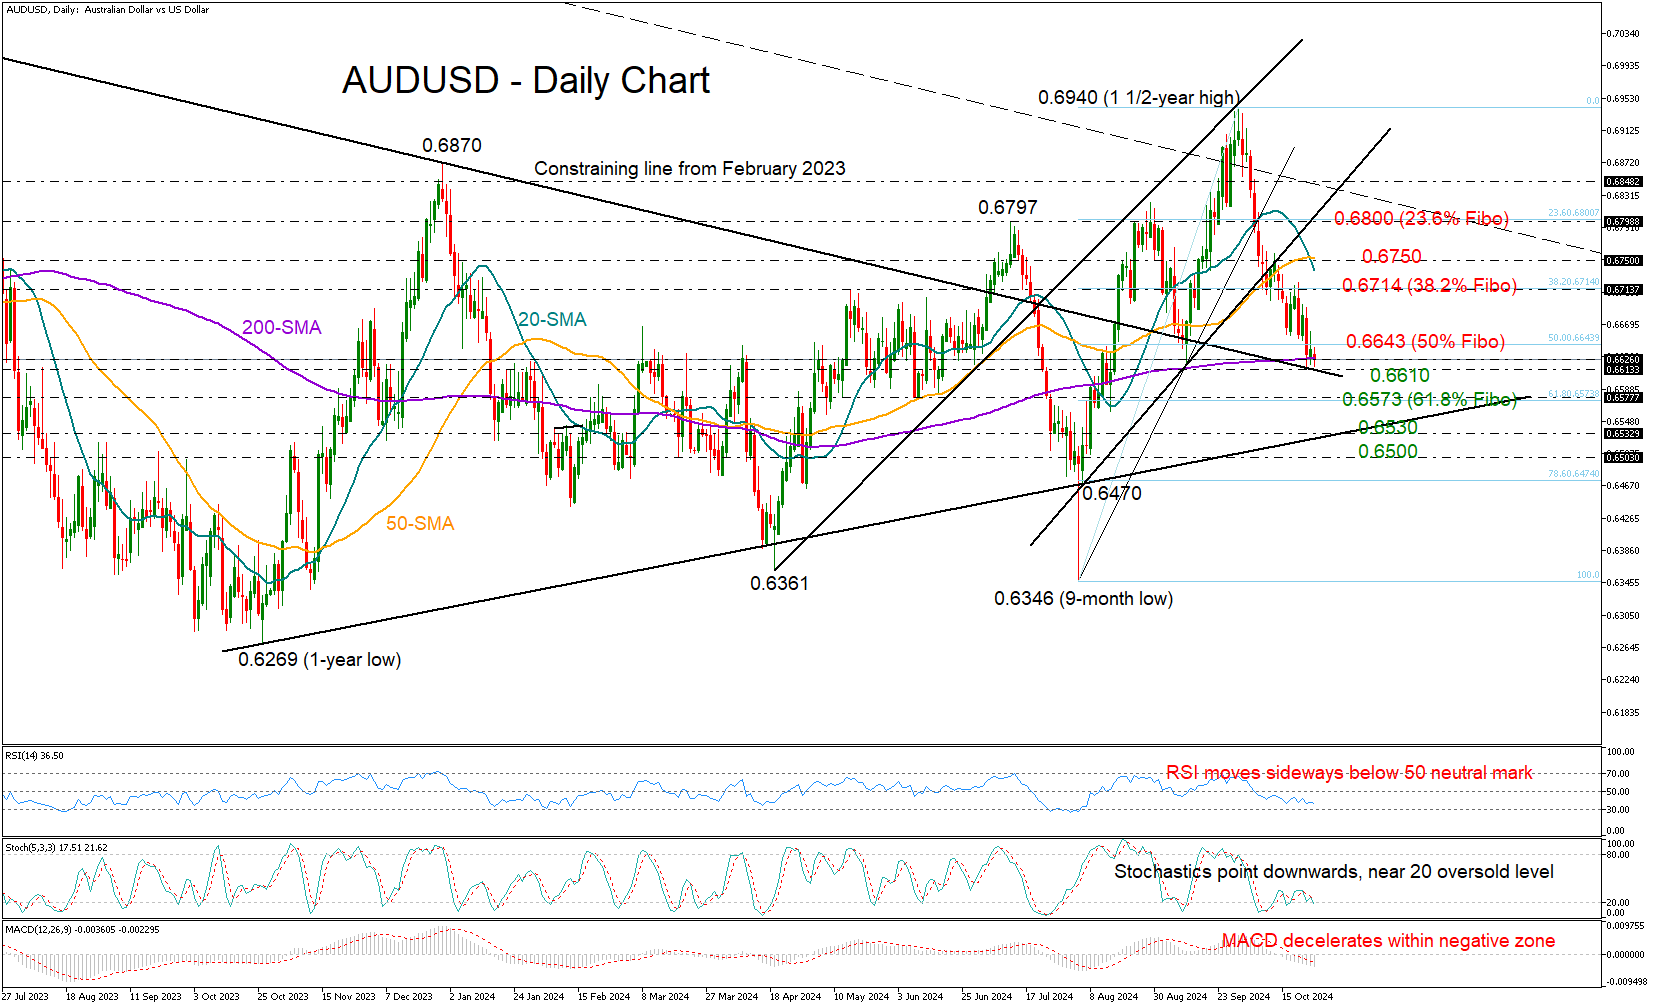
AUDUSD: Will September’s Bullish Vibes Return?
- AUDUSD tests support area near 200-day SMA
- Short-term bias remains on the negative side
AUDUSD has been on a downward slide again, marking its fourth consecutive week in the red. It recently dipped to a two-month low of 0.6612 but held above the 200-day simple moving average (SMA) and the constraining falling line from February 2023, which increases speculation as to whether the sell-off is finally hitting a bottom.
Remember back in September when those support lines gave the price a nice boost? Well, as long as they stay in play there is hope for a bullish reversal. However, the mood is still a bit cautious, with the RSI and the MACD reflecting persistent selling appetite. If the price dips below 0.6610, support could come from the 61.8% Fibonacci retracement level around 0.6573. If that doesn’t hold, the pair could next head for the ascending trendline at 0.6530, and if that breaks as well, watch out for the protective zone between 0.6470 and 0.6500.
On the brighter side, if AUDUSD can bounce back above the 50% Fibonacci level at 0.6643, it could see some momentum building up to the 38.2% Fibonacci level at 0.6714. And if it climbs above the 0.6750 resistance, where the 50-day SMA hangs out, that could really get things moving towards the 23.6% Fibonacci level at 0.6800.
In summary, while AUDUSD has not overcome downside risks, a recovery attempt could be possible as the pair is currently testing a familiar pivot area.
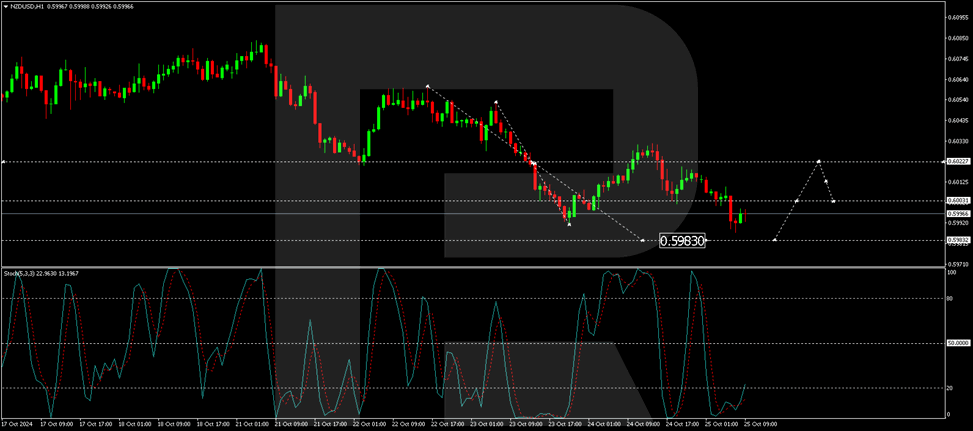
NZD/USD Hits Four-Week Low Amid US Dollar Strength
The NZD/USD pair dropped to 0.5988 this Friday, marking a potential close lower for the fourth consecutive week. The strength of the US dollar continues to dominate the currency pair, fuelled by expectations of a moderate interest rate cut by the Federal Reserve and persistent demand for the USD amid geopolitical tensions in the Middle East and the lead-up to the US presidential election.
Reserve Bank of New Zealand Governor Adrian Orr recently reaffirmed the central bank’s capability to maintain low and stable inflation, noting that the bank is vigilant and ready to act should market conditions necessitate intervention. These comments have solidified market expectations of a potential RBNZ rate cut in November, with a 50-basis-point reduction widely anticipated. Some speculate that a more aggressive cut of 75 basis points could be on the table if conditions worsen.
Recent data indicating a drop in consumer confidence in New Zealand after three months of gains has added to the bearish sentiment surrounding the NZD.
NZD/USD technical analysis
The NZD/USD pair is extending its downward trajectory towards 0.5983. Following the achievement of this level, a corrective move towards 0.6182 could be in the offing, with an intermediate target at 0.6119. This potential rebound is supported by the MACD indicator, whose signal line remains below zero but is trending upwards, suggesting a possible easing of downward pressure.
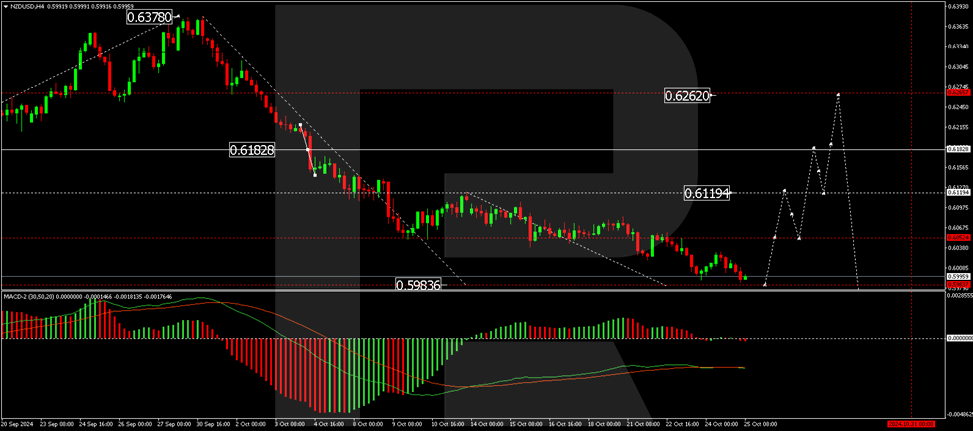
On the hourly chart, NZD/USD has established a consolidation pattern around the 0.6000 level and has since dipped to a local low of 0.5987. A brief recovery to 0.6000 may occur as a test from below before another possible descent to 0.5983. Should this level be reached, it would likely mark the exhaustion of the current downward wave. The Stochastic oscillator reinforces this outlook, with its signal line positioned below 20 but curving upwards, indicating the potential for a short-term upward correction.
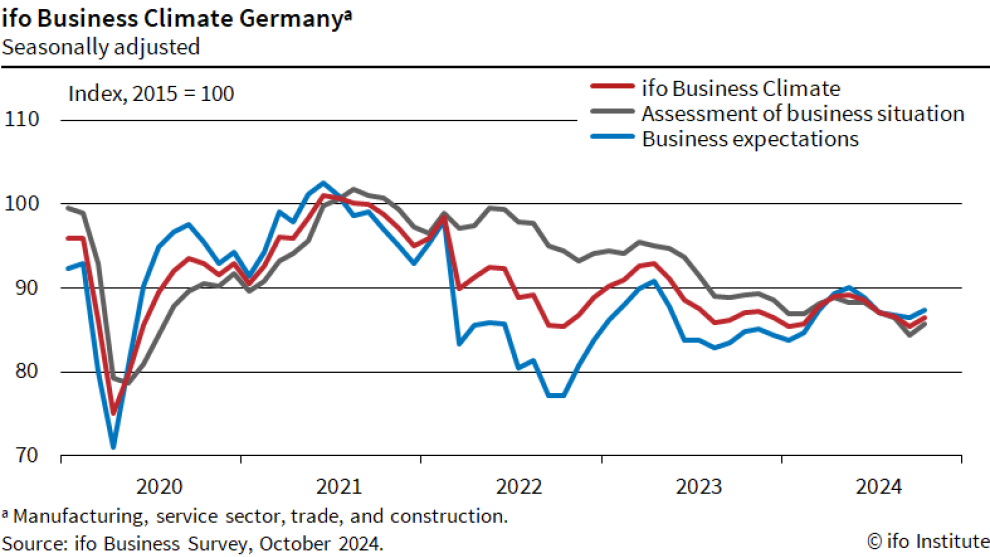
German Ifo rises to 86.5, stops declining for the time being
Germany's Ifo Business Climate index improved in October, rising from 85.4 to 86.5 and exceeding expectations of 85.4. Current Assessment index also showed an uptick from 84.4 to 85.7, surpassing the forecasted 84.1, while Expectations index rose from 86.4 to 87.3, above the anticipated 86.6.
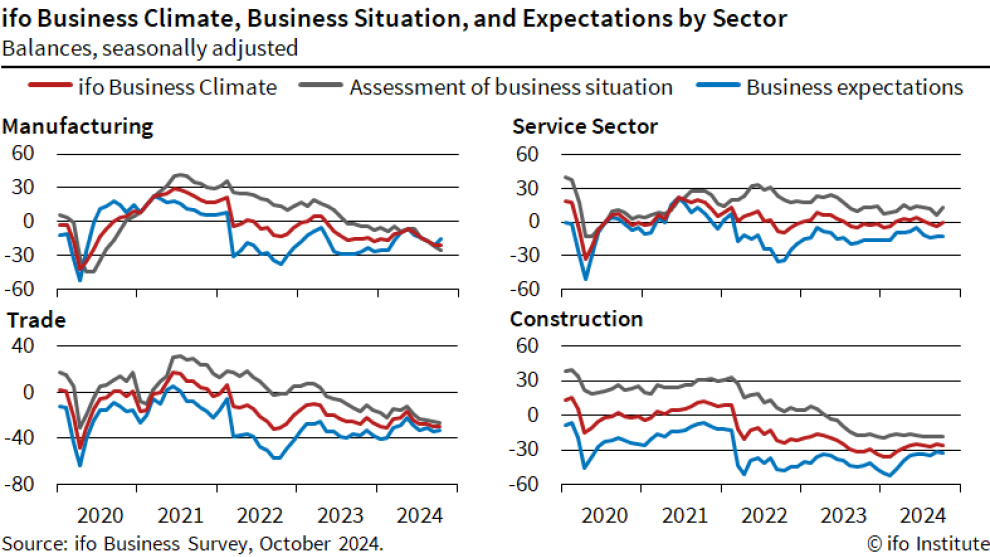
Sectoral data further underscores this cautious optimism, with manufacturing inching up from -21.4 to -20.6, services edging into positive territory from -3.5 to 0.1, and trade posting an improvement from -29.8 to -29.3. Construction sector, however, slipped from -25.3 to -25.7.
This data signals a stabilization in Germany's economic outlook, with Ifo commenting, "The German economy stopped the decline for the time being."
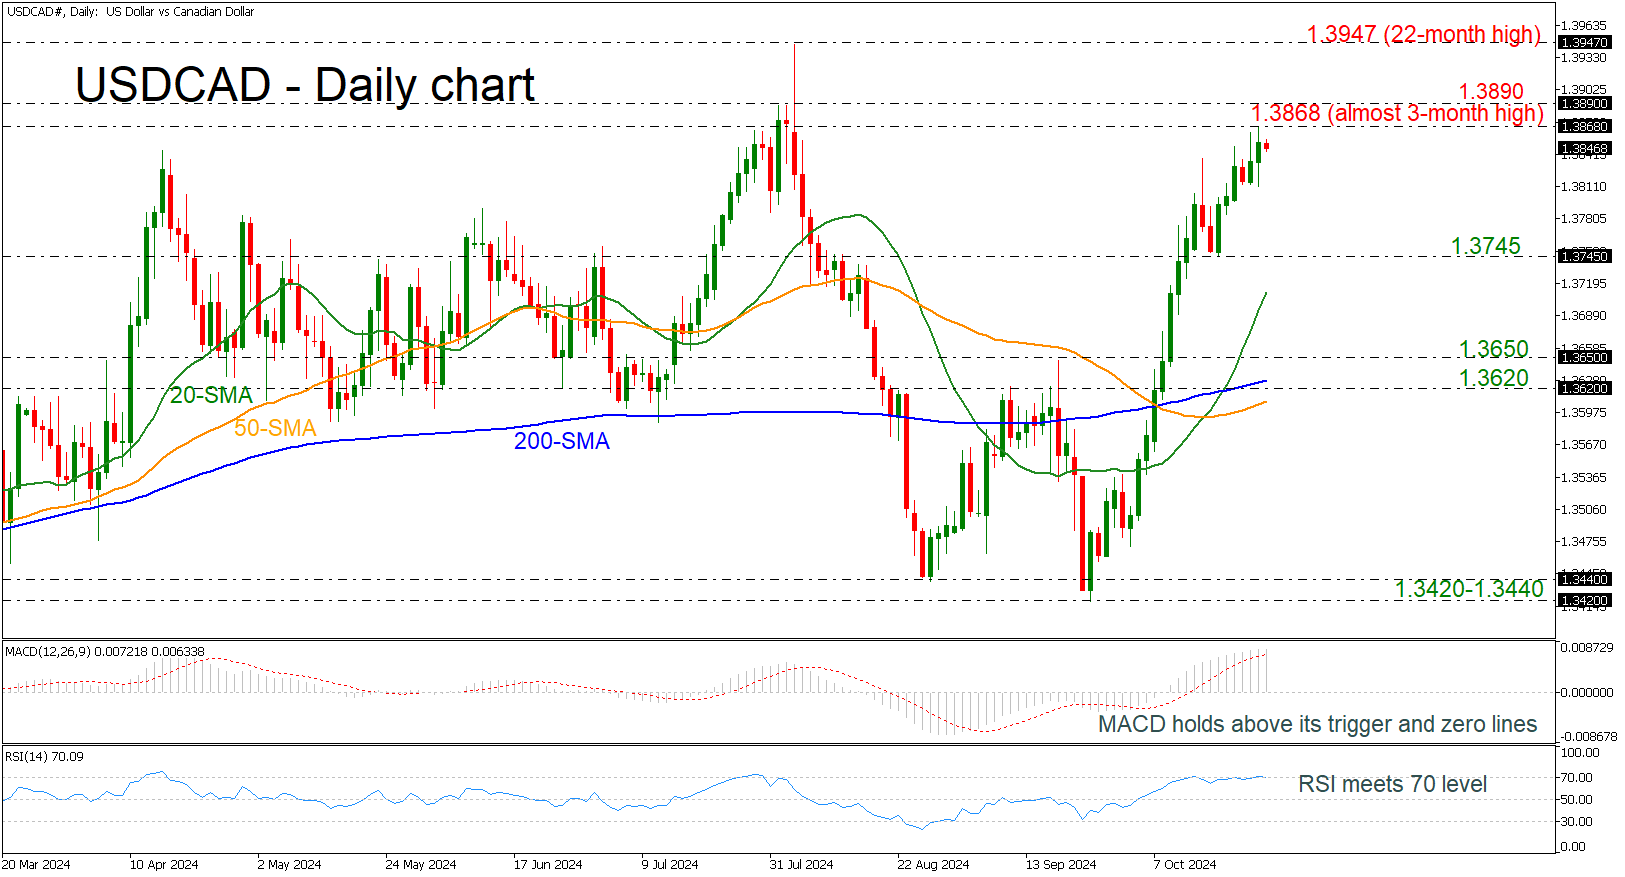
USDCAD Still Near the Almost 3-Month High
- USDCAD adds 3.4% from 1.3420
- Remains well above the SMAs
- MACD and RSI indicate overbought levels
USDCAD has been creating a notable bullish rally since the bounce off the 1.3420 support level, taking the price to an almost three-month high of 1.3868. The pair added 3.4% on this rally, trying to switch the medium-term outlook to positive.
Technically, the RSI is moving horizontally near the 70 level, while the MACD oscillator is losing some momentum above its trigger and zero lines. Both suggest that the market is overstretched, and a potential bearish correction may be on the cards.
Steeper upside movements may drive the market until the 1.3890 barrier ahead of the 22-month peak of 1.3947.
On the other hand, a downside retracement could first find support at the 1.3475 level before testing the 20-day simple moving average (SMA) at 1.3710. Even lower, the inside swing high of 1.3650, taken from the peak on September 19, may pause the bearish move.
All in all, USDCAD is experiencing aggressive buying interest, and only a dive beneath the 200-day SMA, which lies near the 1.3620 bar, may change the bias to neutral.
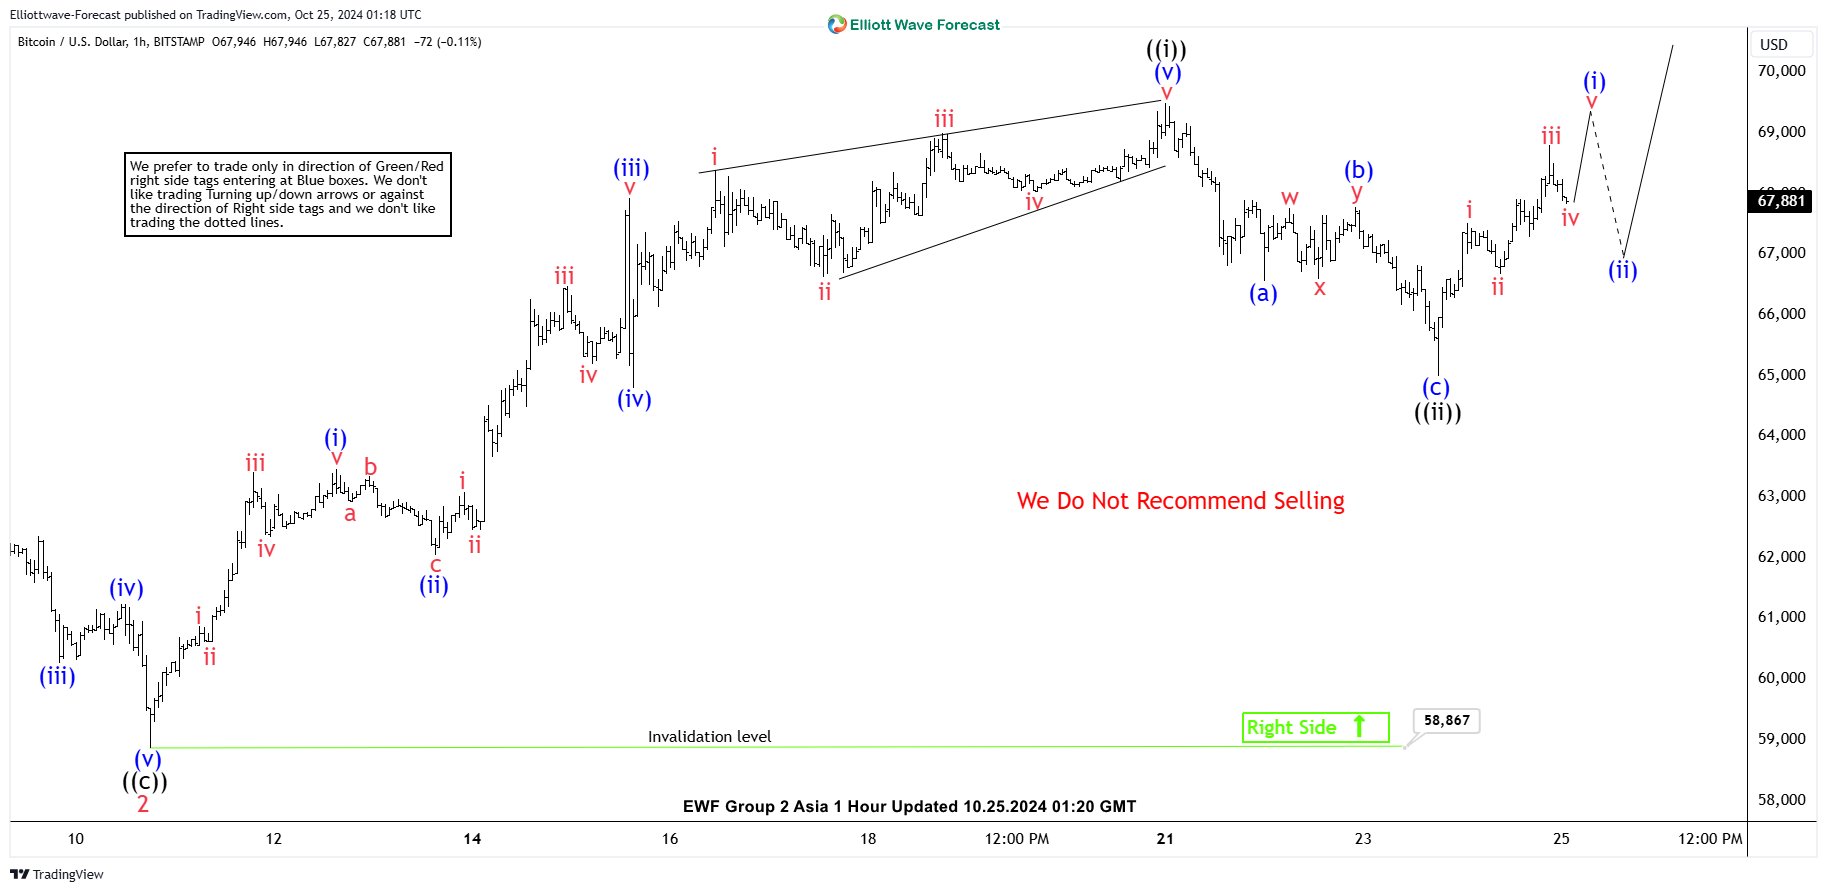
Elliott Wave View: 5 Swing Sequence in Bitcoin (BTCUSD) Favors Higher
Short Term Elliott Wave View in Bitcoin (BTCUSD) suggests that rally from 8.5.2024 low is in 5 swing. As 5 swing is a motive sequence, this favors further upside in Bitcoin. 1 hour chart below shows the decline to 58,867 ended wave 2. The crypto-currency has extended higher in wave 3 with internal subdivision as a 5 waves impulse Elliott Wave. Up from wave 2, wave (i) ended at 63,455 and pullback in wave (ii) ended at 62,039. The crypto-currency extended higher in wave (iii) towards 67,922 and pullback in wave (iv) ended at 64,802. Final leg wave (v) ended at 69,487 which completed wave ((i)) in higher degree.
Pullback in wave ((ii)) unfolded as a zigzag Elliott Wave structure. Down from wave ((i)), wave (a) ended at 66,559 and wave (b) rally ended at 67,784. Bitcoin then extended lower in wave (c) towards 65,000 which completed wave ((ii)) in higher degree. The crypto-currency has extended higher in wave ((iii)), but it still needs to break above wave ((i)) at 69,487 to rule out a double correction. Near term, as far as pivot at 58,867 low stays intact, expect dips to find support in 3, 7, or 11 swing for further upside.
Bitcoin (BTCUSD) 60 Minutes Elliott Wave Chart
BTCUSD Elliott Wave Video
https://www.youtube.com/watch?v=uM93OCW8PwI
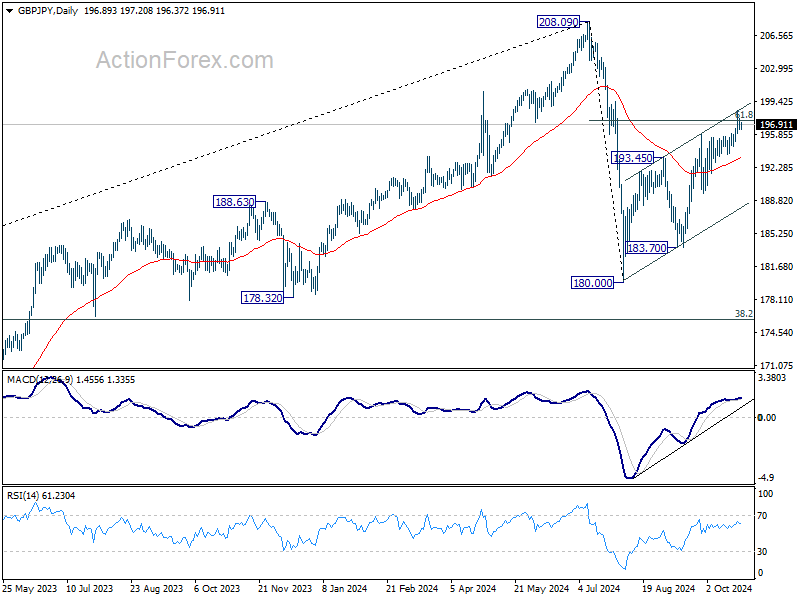
GBP/JPY Daily Outlook
Daily Pivots: (S1) 196.42; (P) 197.03; (R1) 197.63; More...
Intraday bias in GBP/JPY is turned neutral first with a temporary top formed at 198.41. Some consolidations would be seen first, but further rally is expected as long as 193.69 support holds. Break of 198.41 will resume the rally from 180.00 towards 208.09 high.
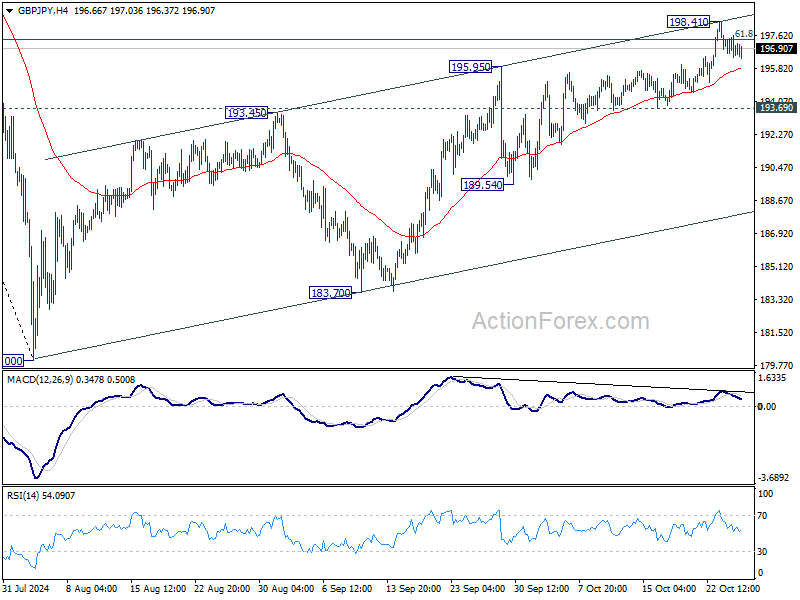
In the bigger picture, price actions from 208.09 are seen as a correction to whole rally from 123.94 (2020 low). The range of consolidation should be set between 38.2% retracement of 123.94 to 208.09 at 175.94 and 208.09. However, decisive break of 175.94 will argue that deeper correction is underway.
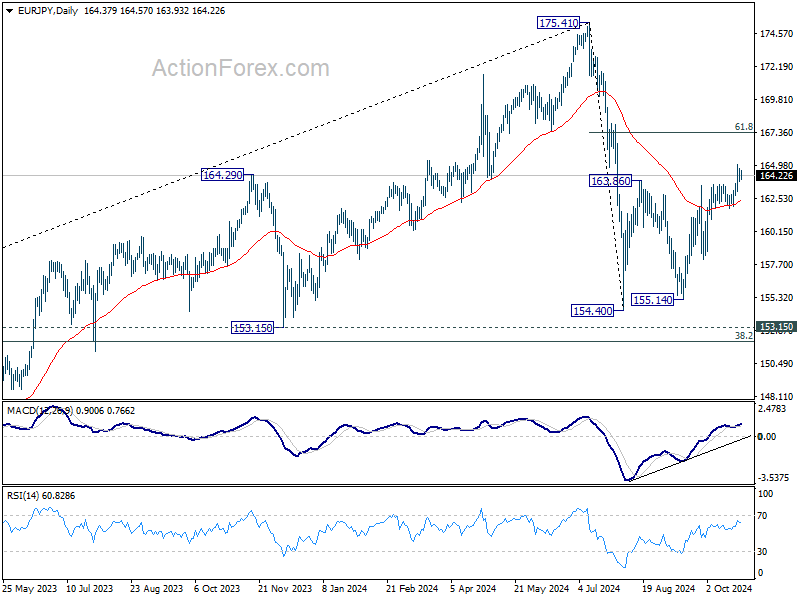
EUR/JPY Daily Outlook
Daily Pivots: (S1) 163.83; (P) 164.36; (R1) 164.92; More....
A temporary top is in place at 165.00 with current retreat and intraday bias in EUR/JPY is turned neutral first. Outlook will stay bullish as long as 161.83 support holds. Above 165.00 will resume the rise from 155.14 to 61.8% retracement of 175.41 to 154.40 at 167.38. Sustained break there will pave the way to retest 175.41 high.
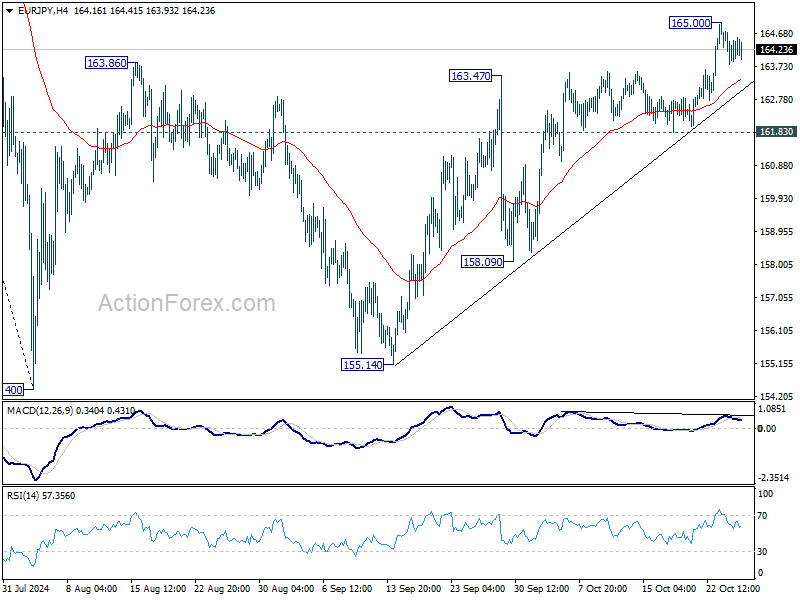
In the bigger picture, price actions from 175.41 are seen as correction to rally from 114.42 (2020 low). The range of consolidation should have been set between 38.2% retracement of 114.42 to 175.41 at 152.11 and 175.41 high. However, decisive break of 152.11 would argue that deeper correction is underway.
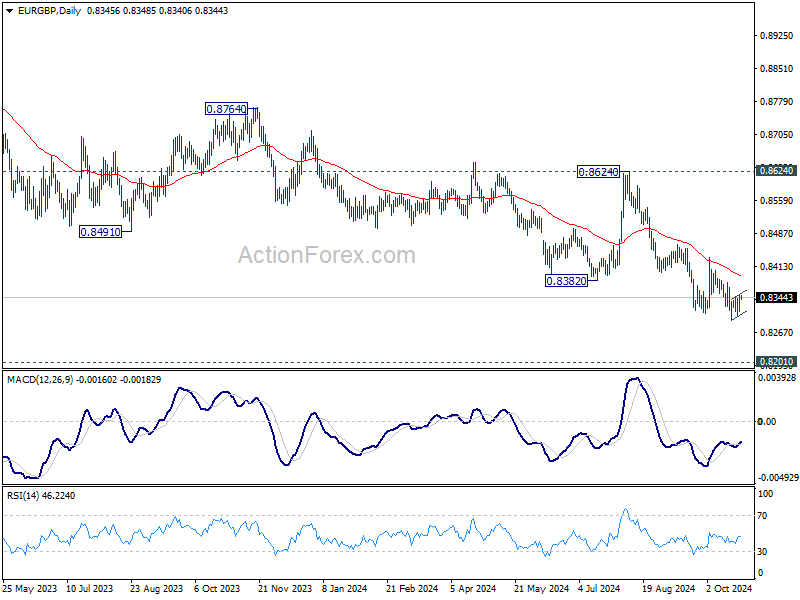
EUR/GBP Daily Outlook
Daily Pivots: (S1) 0.8322; (P) 0.8337; (R1) 0.8359; More...
Intraday bias in EUR/GBP remains neutral as consolidation from 0.8294 is extending. Stronger recovery cannot be ruled out, but outlook will stay bearish as long as 0.8433 resistance holds. On the downside, break of 0.8294 will resume larger down trend to 0.8201 key support next. Strong support could be seen from there to bring sustainable rebound.
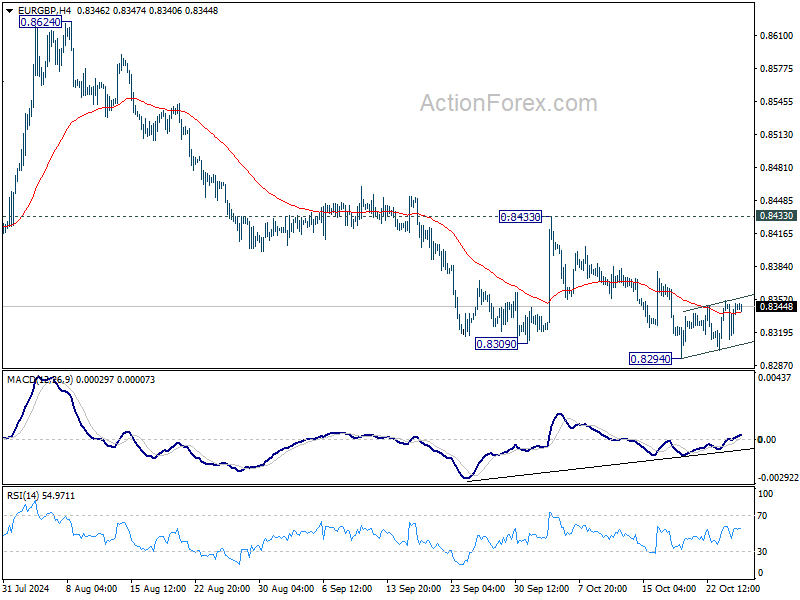
In the bigger picture, down trend from 0.9267 (2022 high) is in progress. Next target is 0.8201 (2022 low), but strong support should be seen there to bring rebound. However, outlook will remain bearish as long as 0.8624 resistance holds even in case of strong rebound. Decisive break of 0.8201 will indicate long term bearish reversal.
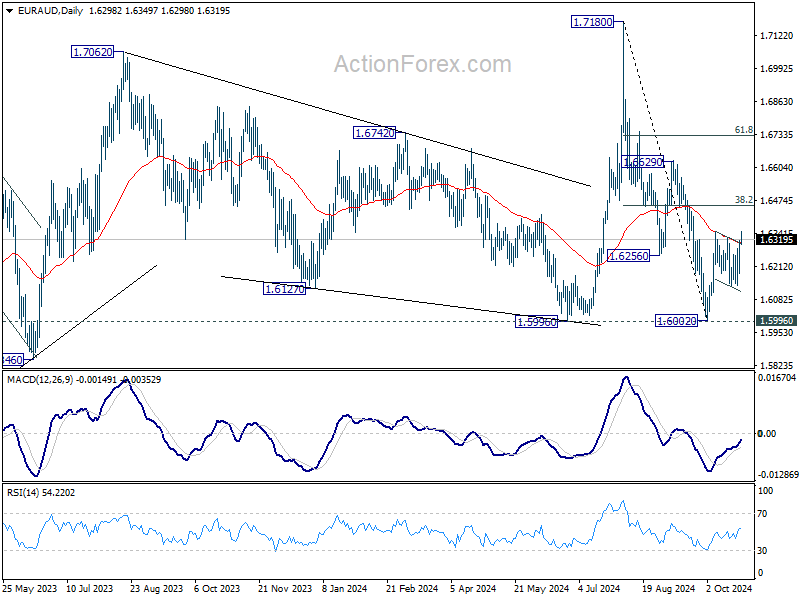
EUR/AUD Daily Outlook
Daily Pivots: (S1) 1.6223; (P) 1.6270; (R1) 1.6354; More...
Intraday bias in EUR/AUD stays on the upside for the moment. Break of 1.6351 will resume the rebound from 1.6002 to 38.2% of 1.7180 to 1.6002 at 1.6452. On the downside, though, below 1.6132 will bring retest of 1.6002 low instead.
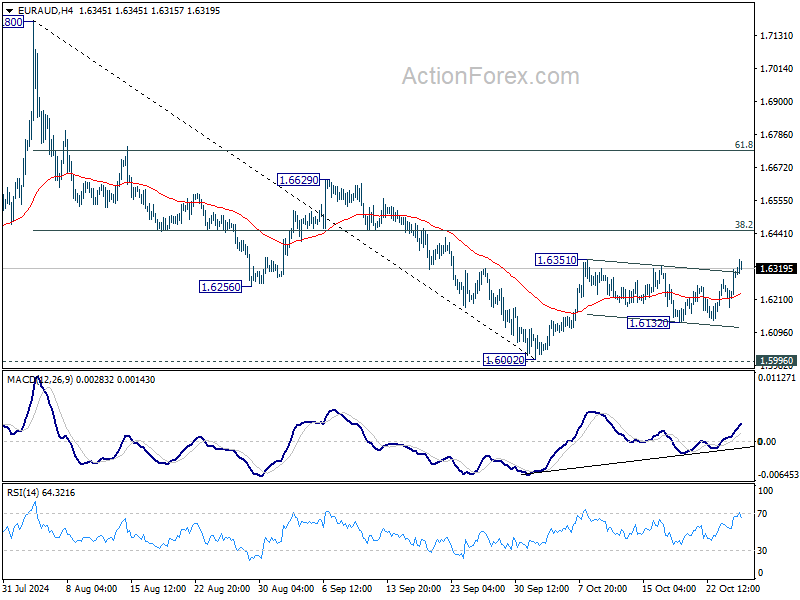
In the bigger picture, as long as 1.5996 cluster support holds (38.2% retracement of 1.4281 to 1.7062 (2023 high) at 1.6000), up trend from 1.4281 (2022 low) is still expected to resume at a later stage. However, decisive break of 1.5996 will argue that the medium term trend has reversed and turn outlook bearish.