Sample Category Title
USD/JPY Weekly Outlook
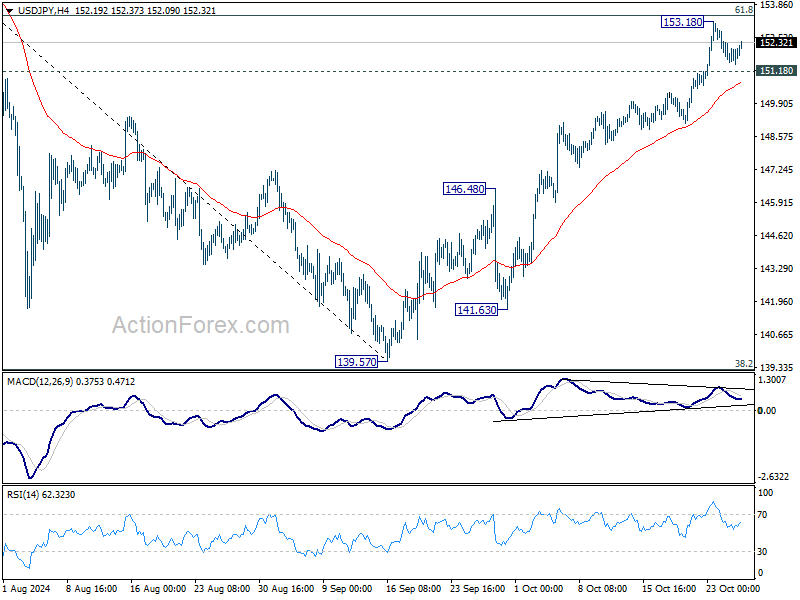
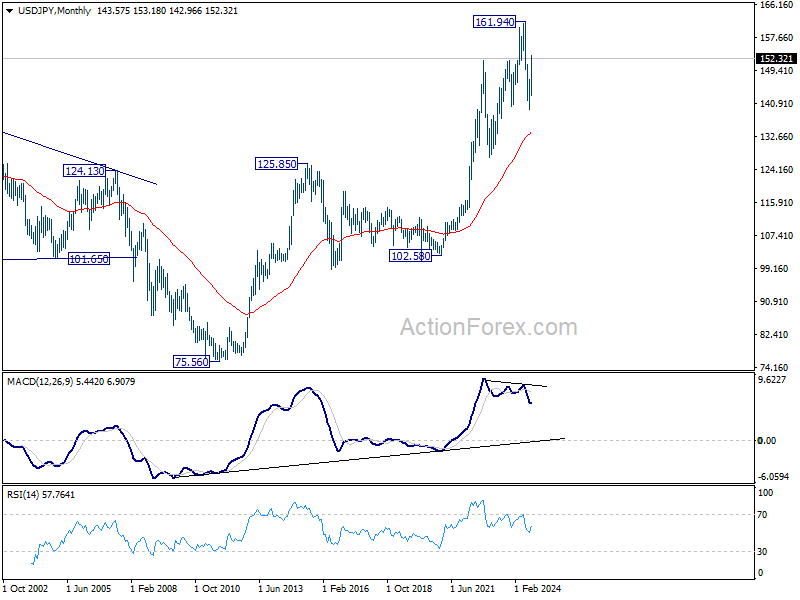
USD/JPY's rebound from 139.57 extended to as high as 153.18 last week but formed a temporary top there and retreat. Initial bias remains neutral this week for consolidations first. Further rally is in favor as long as 151.18 minor support holds. Sustained trading above 61.8% retracement of 161.94 to 139.57 at 153.39 will pave the way to retest 161.94 high. Nevertheless, considering bearish divergence condition in 4H MACD, break of 151.18 will indicate short term topping, and turn bias to the downside for 55 D EMA (now at 148.05).
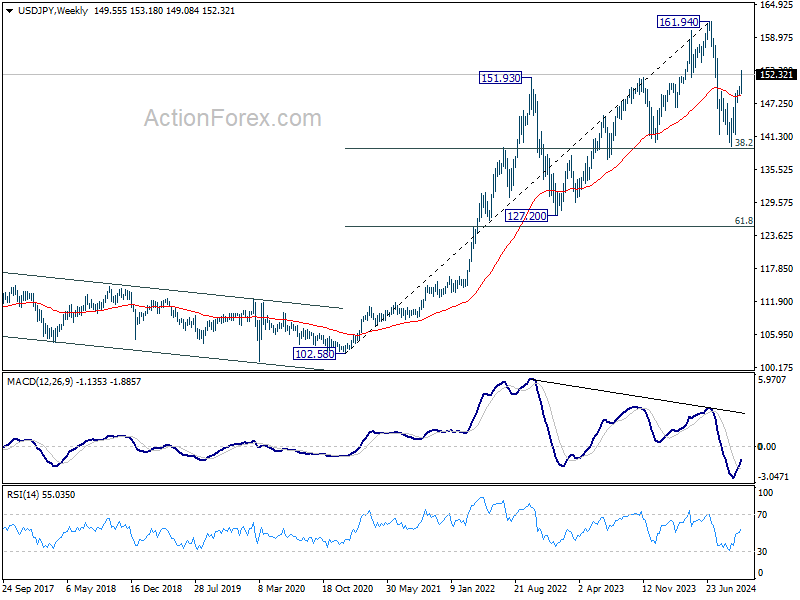
In the bigger picture, price actions from 161.94 are seen as a corrective pattern to rise from 102.58 (2021 low). The range of medium term consolidation should be set between 38.2% retracement of 102.58 to 161.94 at 139.26 and 161.94. Nevertheless, sustained break of 139.26 would open up deeper medium term decline to 61.8% retracement at 125.25.
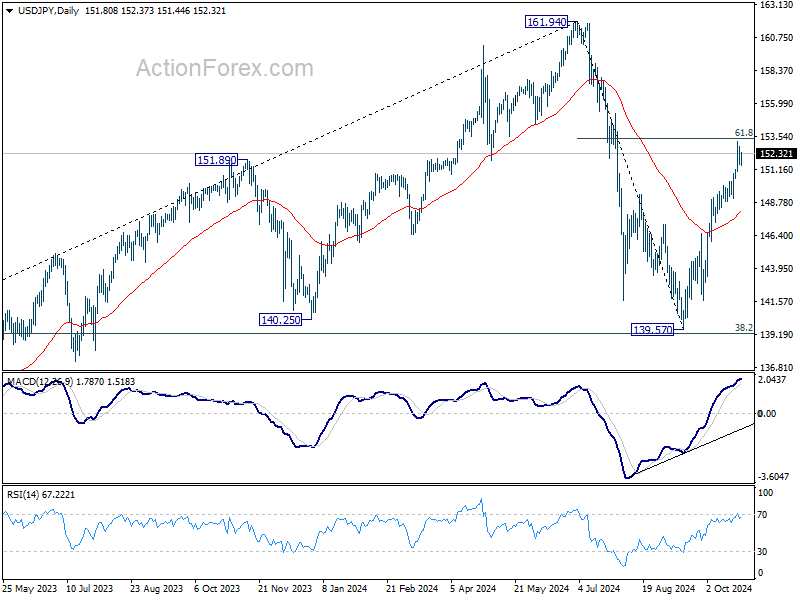
In the long term picture, it's still early to conclude that up trend from 75.56 (2011 low) has completed. However, a medium term corrective phase should have commenced, with risk of deep correction towards 55 M EMA (now at 133.87).
GBP/USD Weekly Outlook
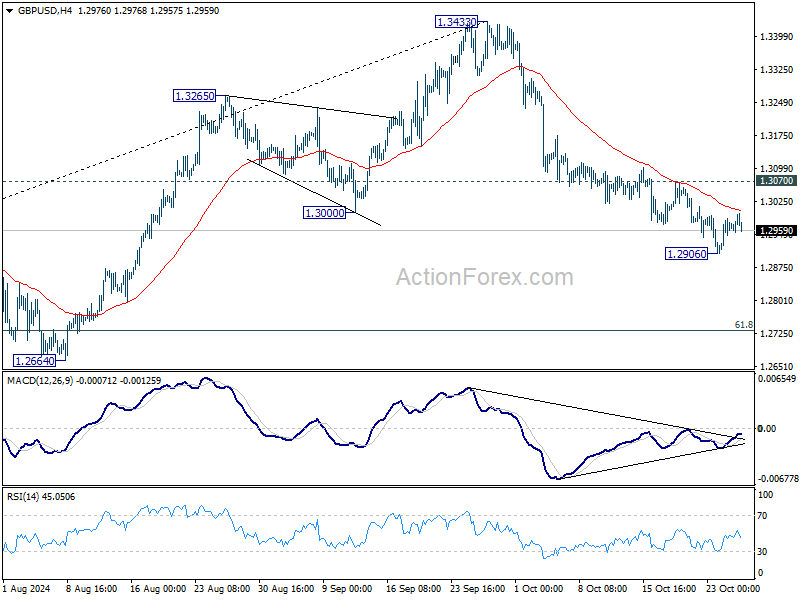
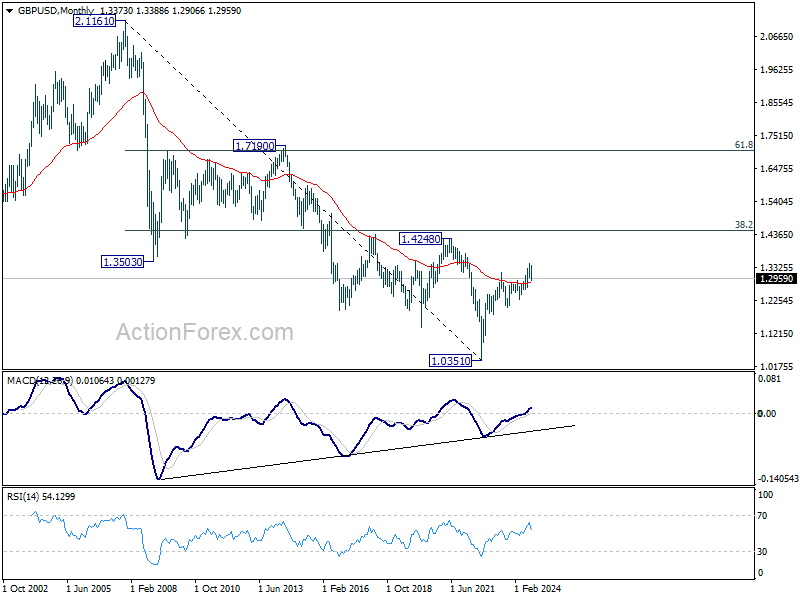
GBP/USD's fall from 1.3433 extended to as low as 1.2906 last week, but formed a temporary low there and recovered. Initial bias remains neutral this week for consolidations. Further decline is expected as long as 1.3070 minor resistance holds. Below 1.2906 will target 61.8% retracement of 1.2298 to 1.3433 at 1.2732. However, considering bearish divergence condition in 4H MACD, firm break 1.3070 resistance will indicate short term bottoming, and turn bias back to the upside for stronger rebound.
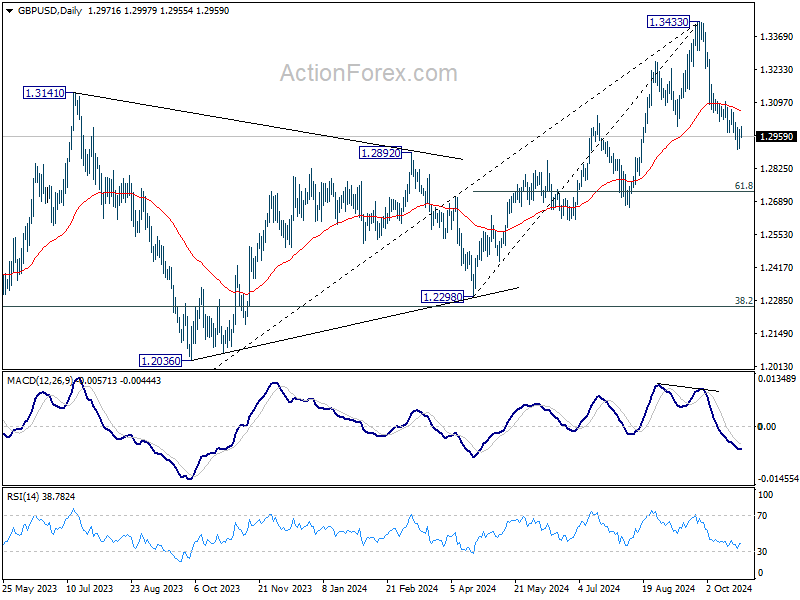
In the bigger picture, considering mildly bearish divergence condition in D MACD, a medium term top is likely in place at 1.3433 already. Price actions from there are seen as correction to whole up trend from 1.0351 (2022 low). Deeper decline would be seen to 38.2% retracement of 1.0351 to 1.3433 at 1.2256, which is close to 1.2298 structural support. Strong support should be seen there to bring rebound.
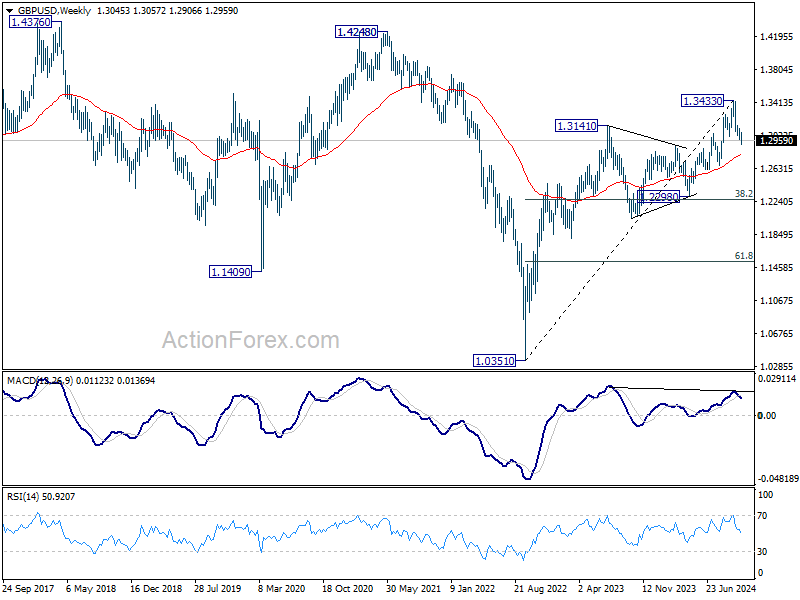
In the long term picture, as long as 1.2298 support holds, rise from 1.0351 long term bottom is expected to continue. The strong break of 55 M EMA (now at 1.2811) is a sign of bullish trend reversal. Yet, break of 1.4248 structural resistance is needed confirm. Otherwise, price actions from 1.0351 could just be part of a consolidation pattern.
USD/CHF Weekly Outlook
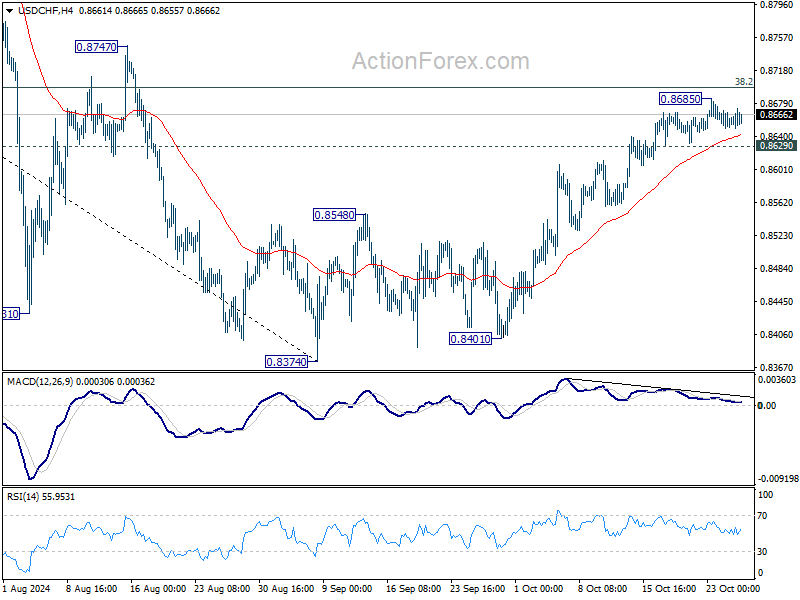
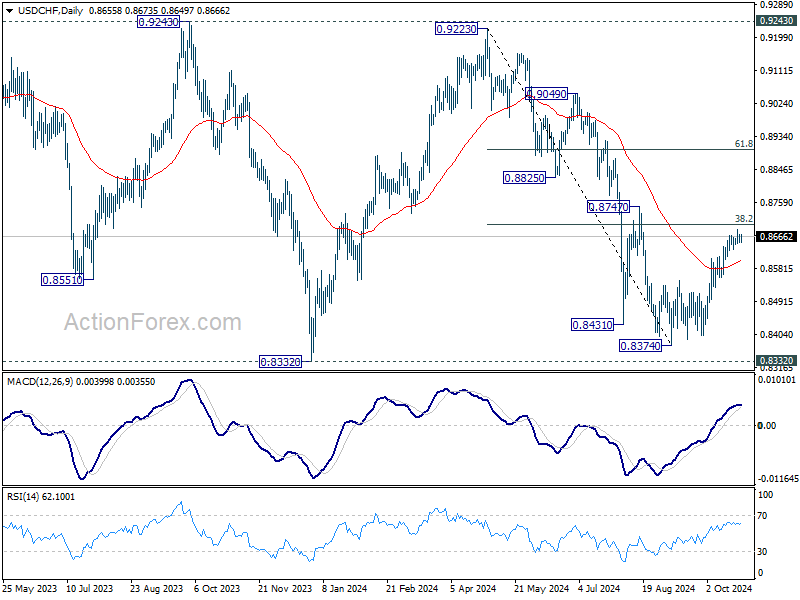
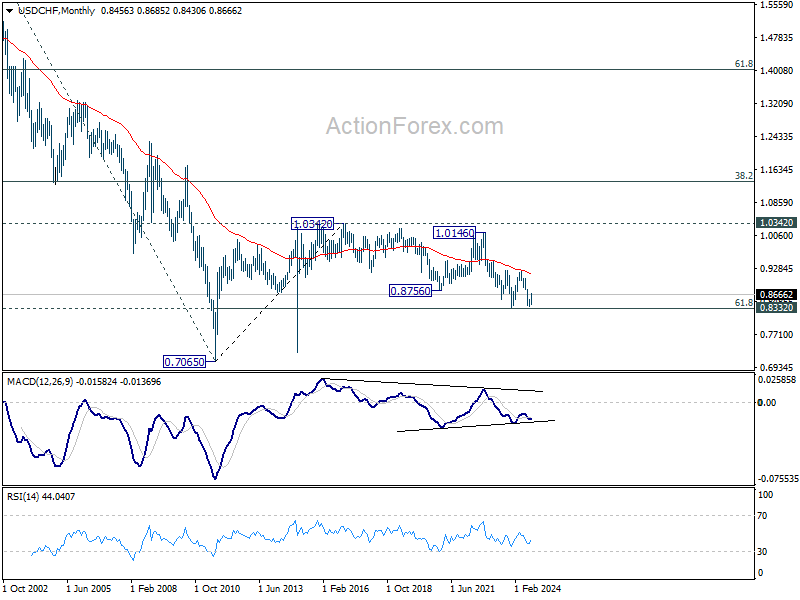
USD/CHF's rise from 0.8374 continued last week but formed a temporary top at 0.8685. Initial bias remains neutral this week first. Further rise is expected as long as 0.8629 minor support holds. Decisive break of 38.2% retracement of 0.9223 to 0.8374 at 0.8698 will argue that fall from 0.9223 has completed after defending 0.8332 low. Further rally should then be seen to 61.8% retracement at 0.8899 next. However, considering bearish divergence condition in 4H MACD, firm break of 0.8629 support will indicate short term topping, and turn bias back to the downside for 55 D EMA (now at 0.8601).
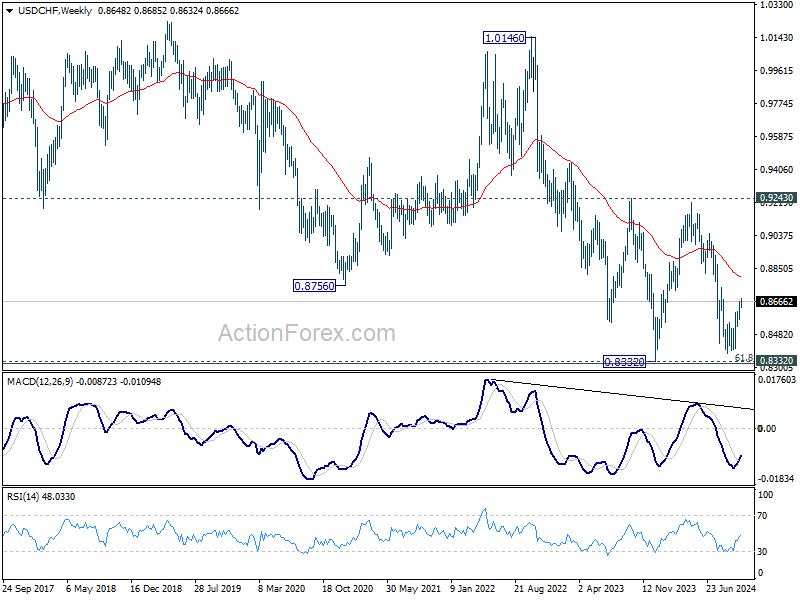
In the bigger picture, price actions from 0.8332 (2023 low) are currently seen as a medium term corrective pattern, with fall from 0.9223 as the second leg. Strong support could be seen from 0.8332 to bring rebound. Yet, overall outlook will continue to stay bearish as long as 0.9243 resistance holds. Firm break of 0.8332, however, will resume larger down trend from 1.0146 (2022 high).
In the long term picture, price action from 0.7065 (2011 low ) are seen as a corrective pattern to the multi-decade down trend from 1.8305 (2000 high). Fall from 1.0342 (2016 high) is seen as the second leg. Rejection by 55 M EMA suggest that this fall is in progress. Break of 61.8% retracement of 0.7065 to 1.0342 at 0.8317 will pave the way back to 0.7065.
AUD/USD Weekly Report
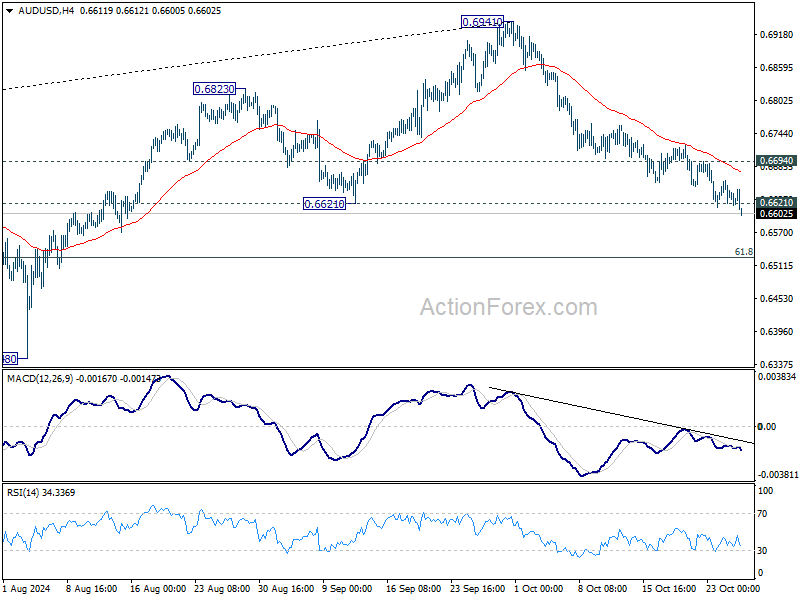
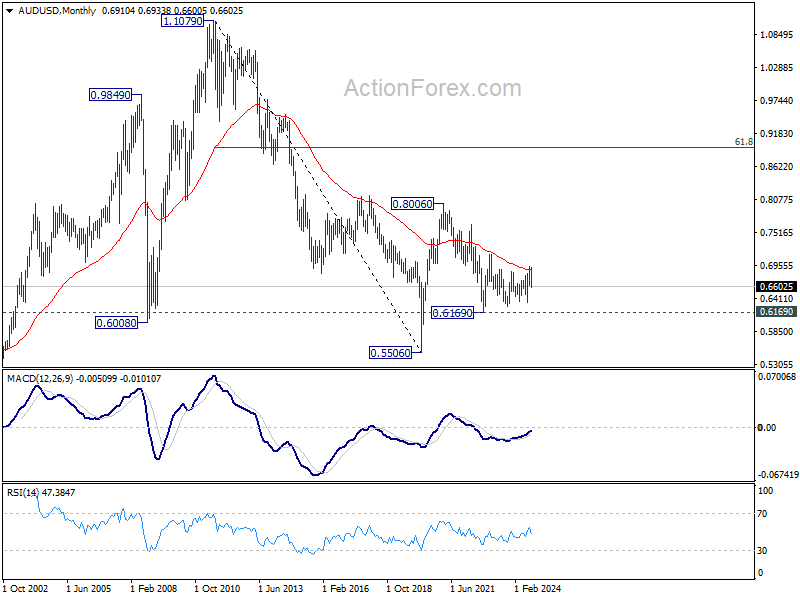
AUD/USD's fall from 0.6941 continued last week and the break of 0.6621 resistance suggest near term bearish reversal. Initial bias stays on the downside this week for 61.8% retracement of 0.6269 to 0.6941 at 0.6526 next. On the upside, above 0.6694 minor resistance will turn intraday bias neutral and bring consolidations first.
In the bigger picture, rise from 0.6269 (2023 low) should have completed with three waves up to 0.6941. Corrective pattern from 0.6169 (2022 low) is now extending with another falling leg. Deeper decline would be seen back to 0.6269 as sideway trading extends.
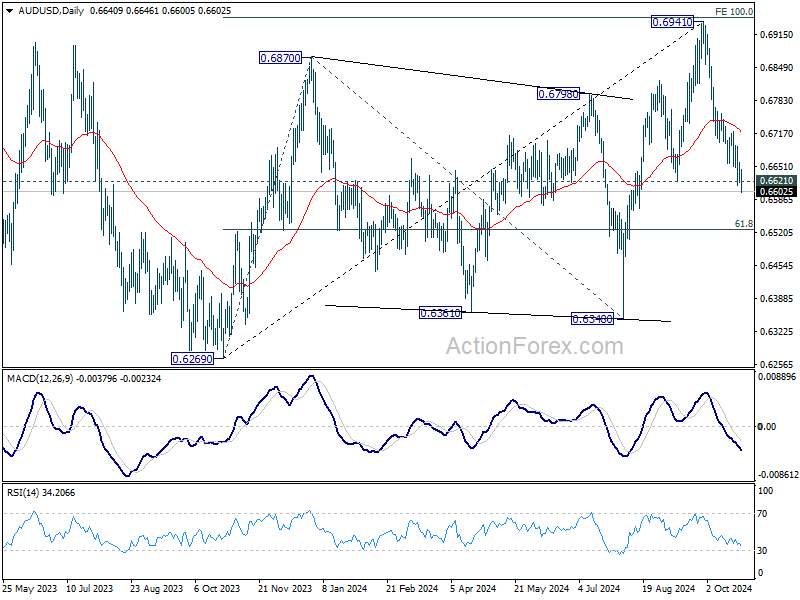
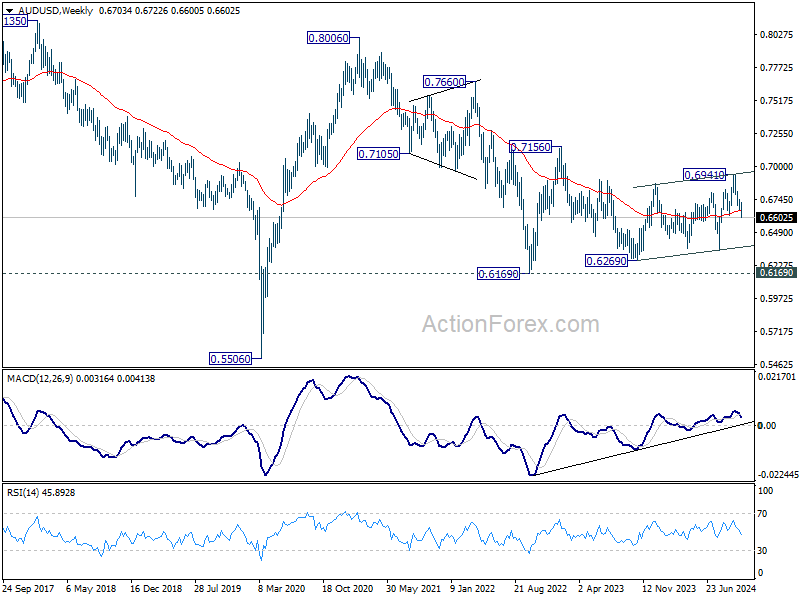
In the long term picture, the down trend from 1.1079 (2011 high) should have completed at 0.5506 (2020 low) already. It's unsure yet whether price actions from 0.5506 are developing into a corrective pattern, or trend reversal. But in either case, fall from 0.8006 is seen as the second leg of the pattern. Firm of 0.7156 resistance will argue that the third leg has already started towards 0.8006.
USD/CAD Weekly Outlook
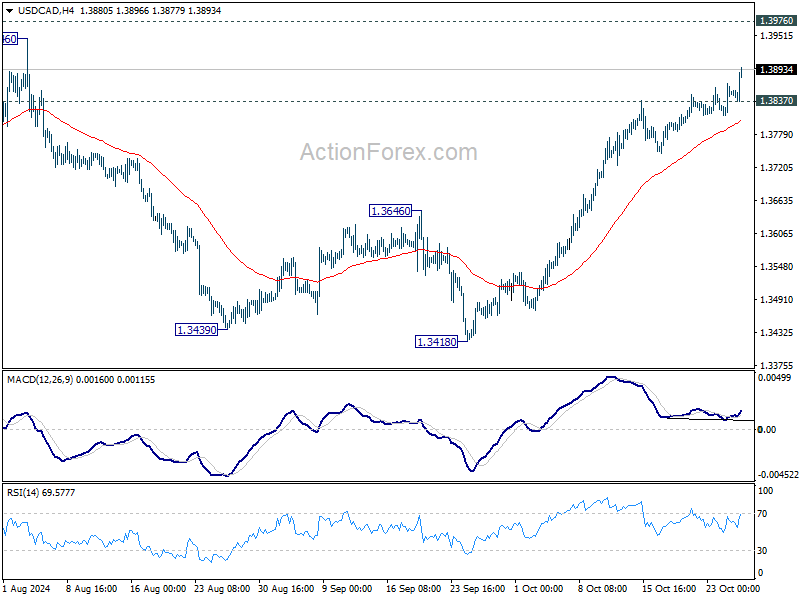
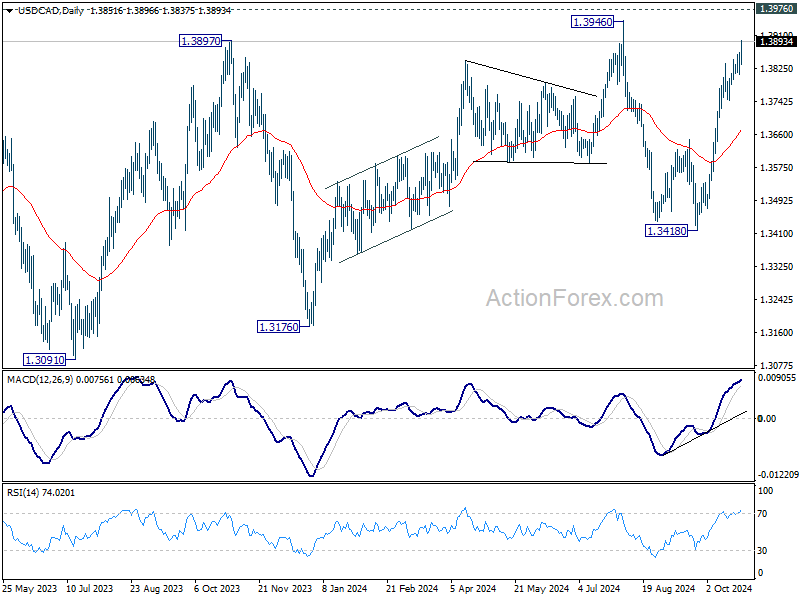
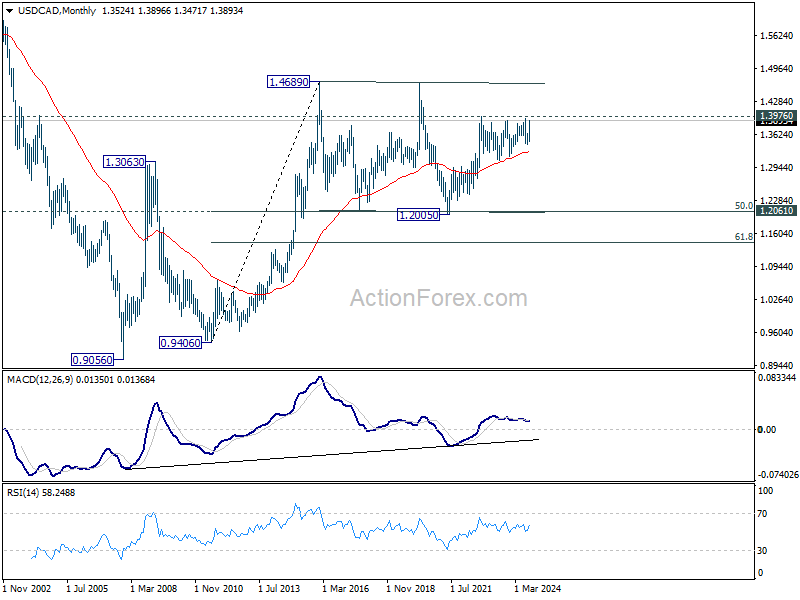
USD/CAD's rally from 1.3418 continued last week and there is no clear sign of topping yet. Initial bias stays on the upside this week for 1.3946/76 resistance zone. On the downside, below 1.3837 minor support will turn intraday bias and bring consolidations first.
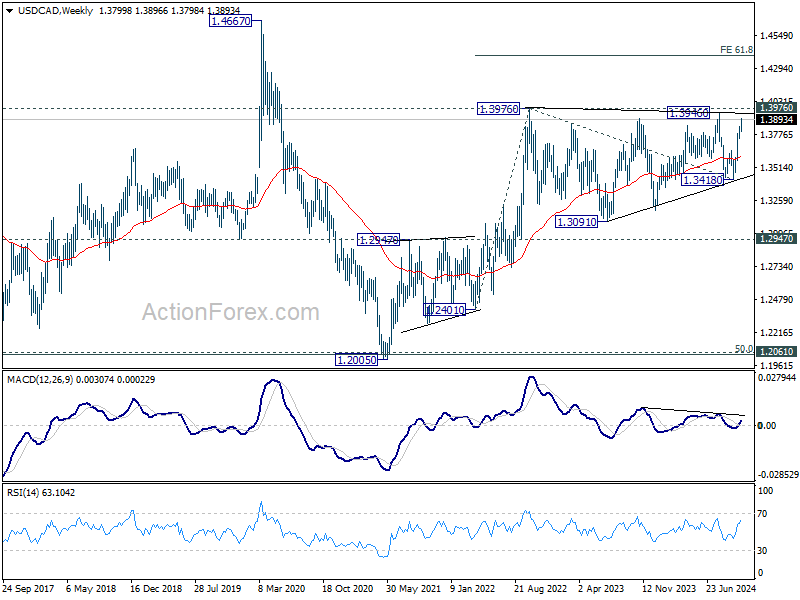
In the bigger picture, sideway consolidation pattern from 1.3976 (2022 high) might still extend further. While another decline cannot be ruled out, strong support should emerge above 1.2947 resistance turned support to bring rebound. Rise from 1.2005 (2021 low) is still in favor to resume at a later stage. Decisive break of 1.3976 will target 61.8% projection of 1.2401 to 1.3976 from 1.3418 at 1.4391.
In the longer term picture, price actions from 1.4689 (2016 high) are seen as a consolidation pattern, which might have completed at 1.2005. That is, up trend from 0.9506 (2007 low) is expected to resume at a later stage. This will remain the favored case as long as 1.2947 resistance turned support holds.
GBP/JPY Weekly Outlook
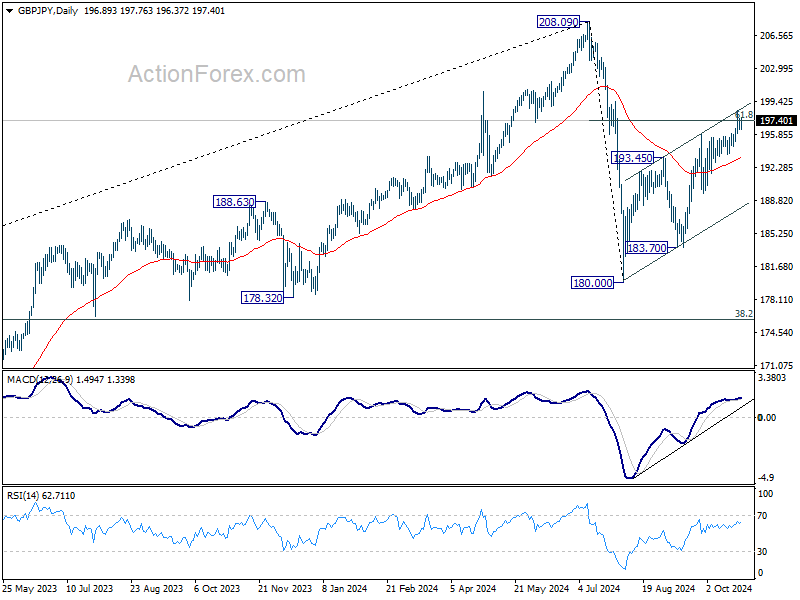
GBP/JPY's rise from 180.00 resumed last week but formed a temporary top at 198.41. Initial bias remains neutral this week for consolidations first. Further rally is expected as long as 193.69 support holds. On the upside, sustained trading above 61.8% retracement of 208.09 to 180.00 at 197.35 will target 208.09 high next.

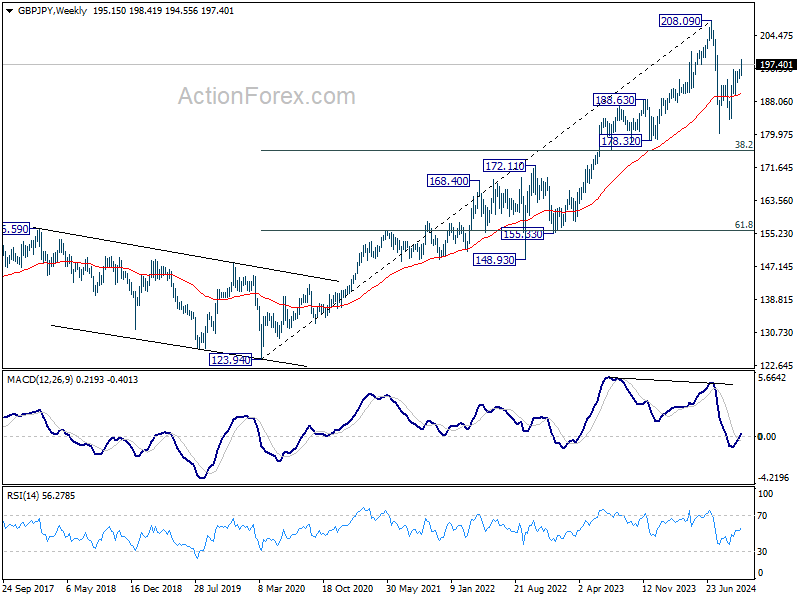
In the bigger picture, price actions from 208.09 are seen as a correction to whole rally from 123.94 (2020 low). The range of consolidation should be set between 38.2% retracement of 123.94 to 208.09 at 175.94 and 208.09. However, decisive break of 175.94 will argue that deeper correction is underway.
In the longer term picture, considering bearish divergence condition in W MACD, 208.09 is at least a medium term top. It's still early to conclude that the up trend from 122.75 (2016 low) has completed. But it's at least in a medium term corrective phase, with risk of correction to 55 M EMA (now at 171.17).

EUR/JPY Weekly Outlook
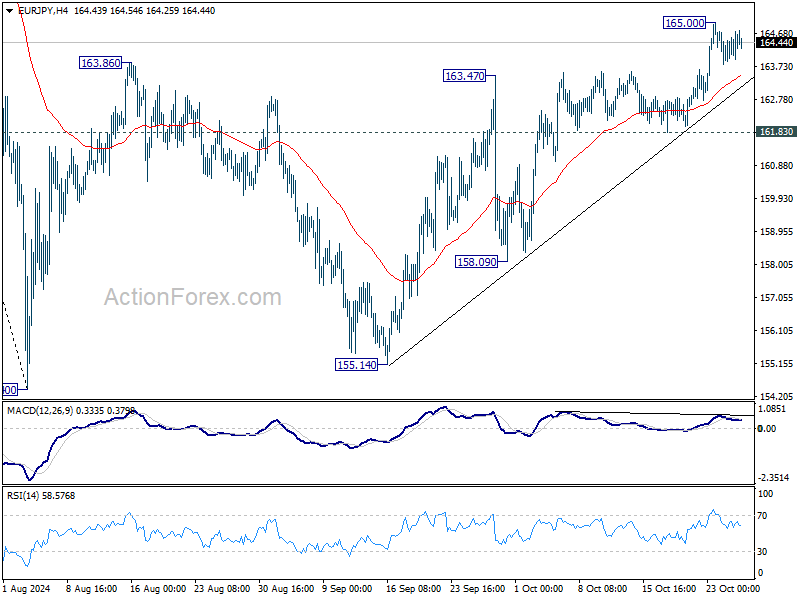
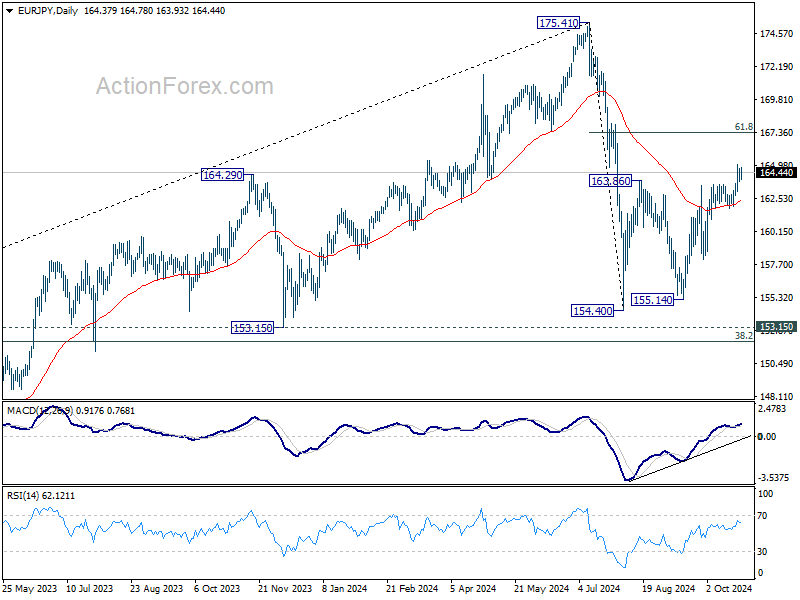
EUR/JPY's rise from 154.40 resumed last week but a temporary top was then formed at 165.00. Initial bias remains neutral this week for consolidations first. Further rally is expected as long as 161.83 support holds. Above 165.50 will target 61.8% retracement of 175.41 to 154.40 at 167.38. Sustained break there will pave the way to retest 175.41 high.
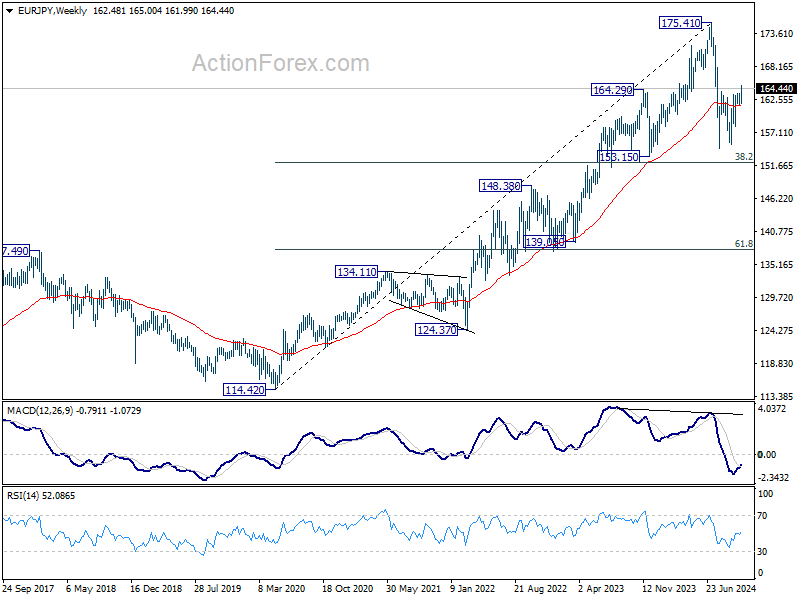
In the bigger picture, price actions from 175.41 are seen as correction to rally from 114.42 (2020 low). The range of consolidation should have been set between 38.2% retracement of 114.42 to 175.41 at 152.11 and 175.41 high. However, decisive break of 152.11 would argue that deeper correction is underway.
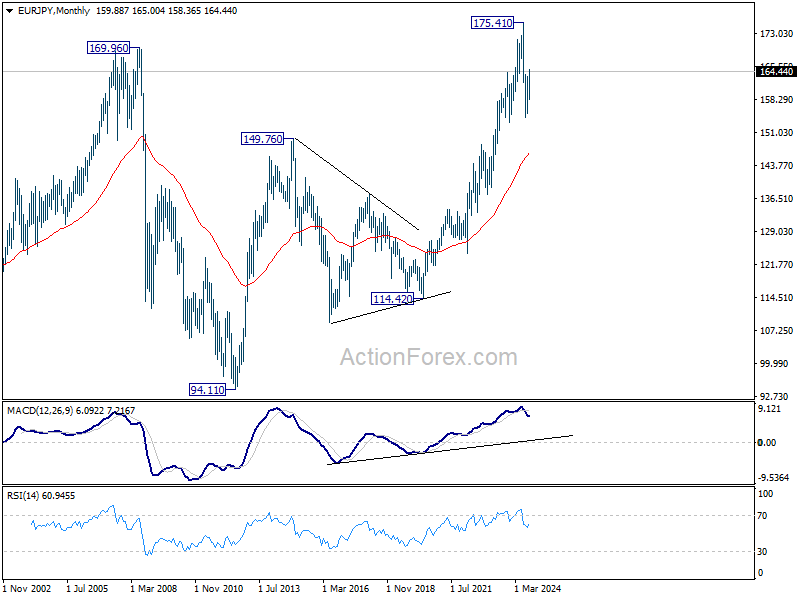
In the long term picture, considering bearish divergence condition in W MACD, 175.41 is at least a medium term top. It's still early to conclude that up trend from 94.11 (2012 low) has completed. But a medium term corrective phase is in progress with risk of deeper fall back to 55 M EMA (now at 146.64).
EUR/GBP Weekly Outlook
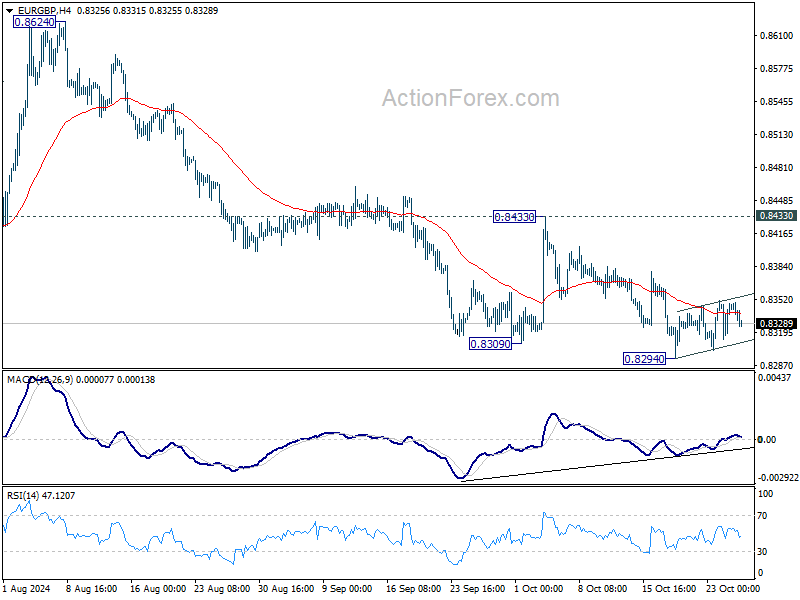
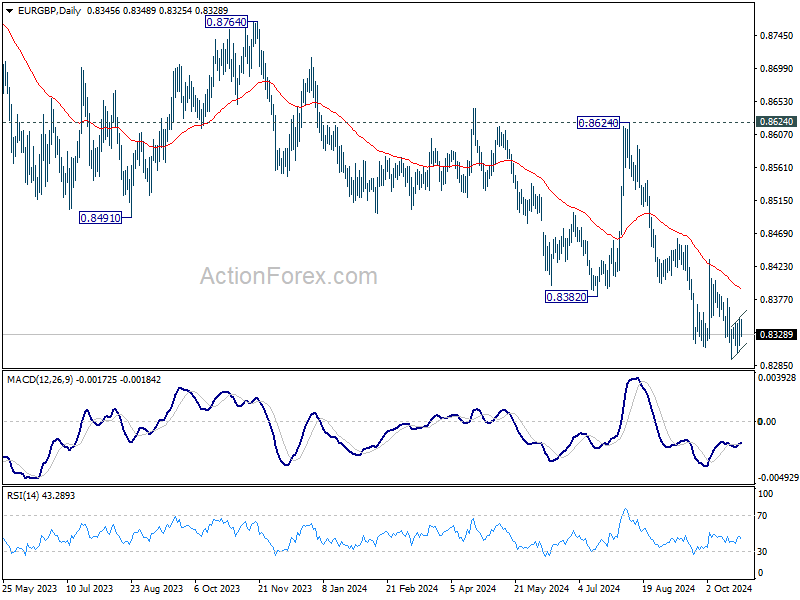
EUR/GBP stayed in consolidation above 0.8294 last week and outlook is unchanged. Initial bias remains neutral this week first. Further decline is expected as long as 0.8433 resistance holds. Break of 0.8294 will resume larger down trend to 0.8201 key support next. Strong support could be seen from there to bring rebound.
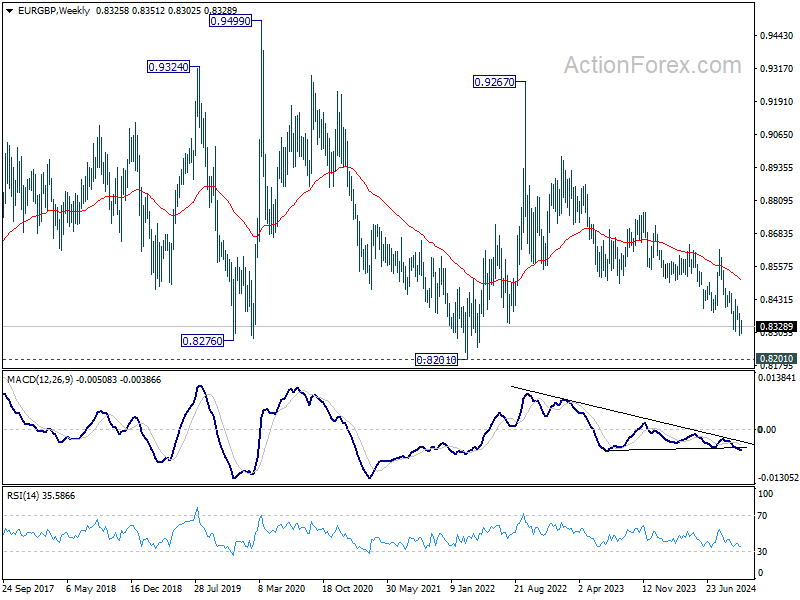
In the bigger picture, down trend from 0.9267 (2022 high) is in progress. Next target is 0.8201 (2022 low), but strong support should be seen there to bring rebound. However, outlook will remain bearish as long as 0.8624 resistance holds even in case of strong rebound. Decisive break of 0.8201 will indicate long term bearish reversal.
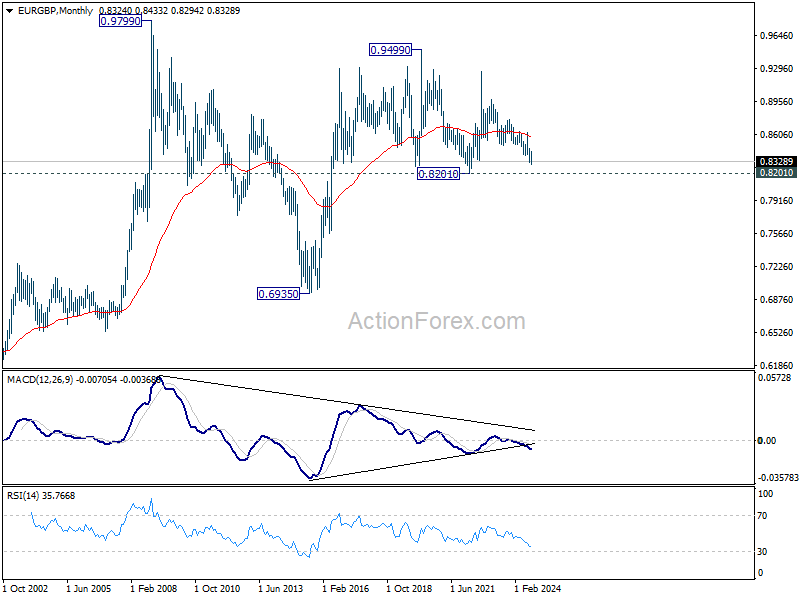
In the long term picture, price action from 0.9499 (2020 high) is seen as part of the long term range pattern from 0.9799 (2008 high). Range trading should continue between 0.8201 and 0.9499, until there is clear signal of imminent breakout.
EUR/AUD Weekly Outlook
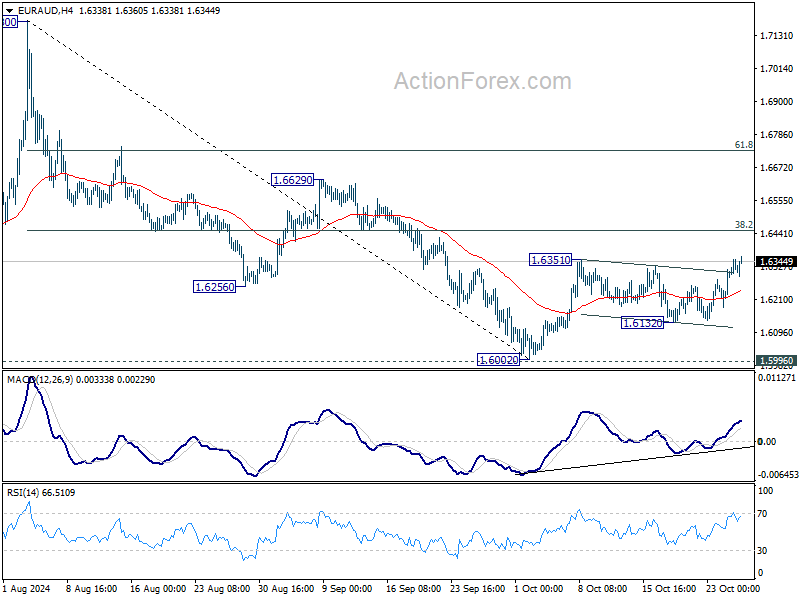
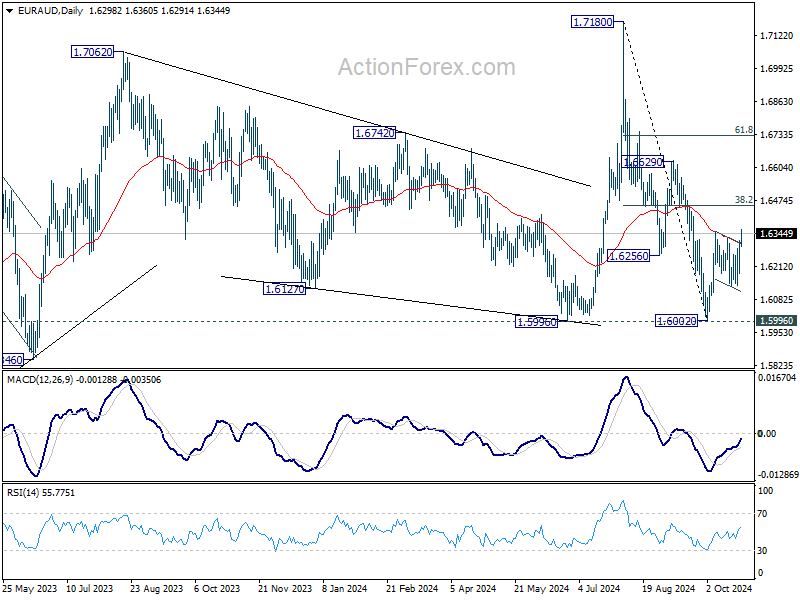
EUR/AUD's last break of 1.6351 resistance last week suggests that rebound from 1.6002 is resuming. Initial bias is now on the upside this week for 38.2% of 1.7180 to 1.6002 at 1.6452. Decisive break there should confirm that whole fall from 1.7180 has completed with three waves down to 1.6002, after being supported by 1.5996. On the downside, though, break of 1.6132 will bring retest of 1.6002 instead.
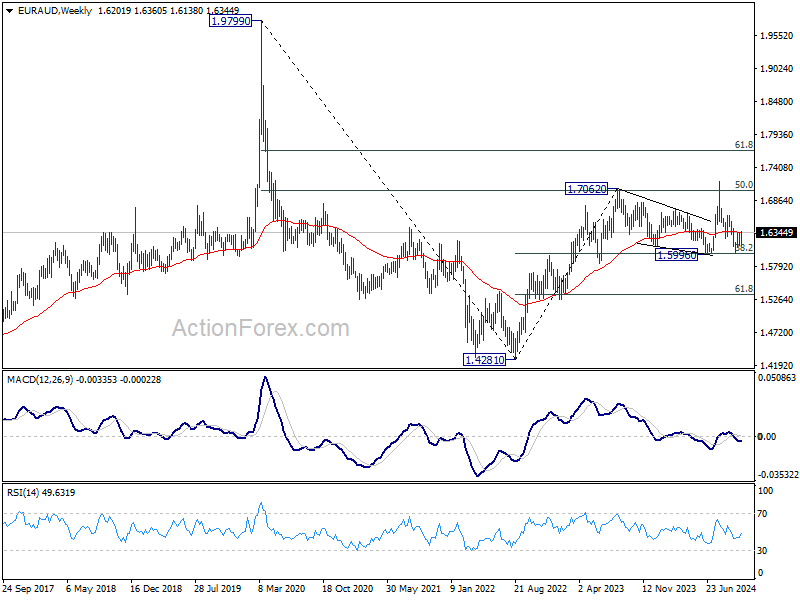
In the bigger picture, as long as 1.5996 cluster support holds (38.2% retracement of 1.4281 to 1.7062 (2023 high) at 1.6000), up trend from 1.4281 (2022 low) is still expected to resume at a later stage. However, decisive break of 1.5996 will argue that the medium term trend has reversed and turn outlook bearish.
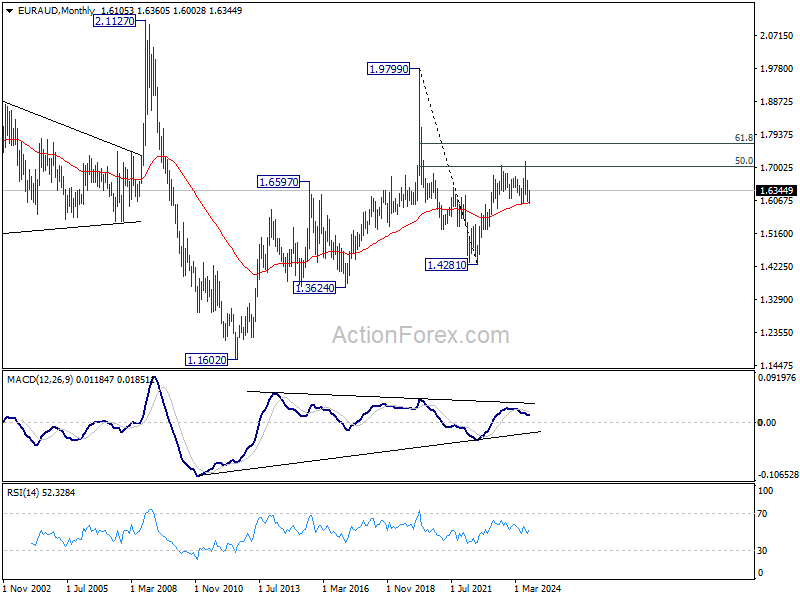
In the longer term picture, rise from 1.4281 is seen as the second leg of the pattern from 1.9799 (2020 high), which is part of the pattern from 2.1127 (2008 high). As long as 55 M EMA (now at 1.6015) holds, this second leg could still extend higher. However, sustained trading below 55 M EMA will open up the bearish case for extending the decline through 1.4281 low.
EUR/CHF Weekly Outlook
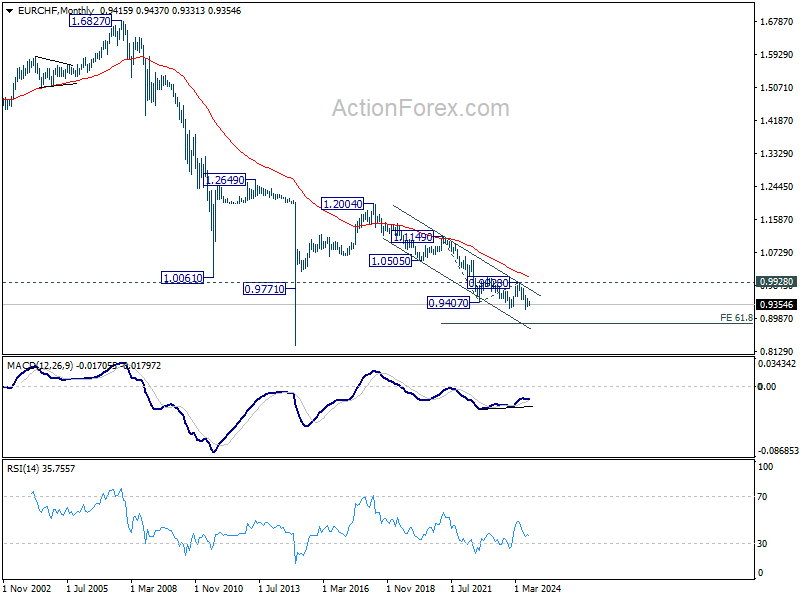
EUR/CHF gyrated lower last week but failed to break through 0.9332 support. Initial bias remains neutral this week first. On the downside, break of 0.9332 will resume the fall from 0.9579 towards 0.9209 low. On the upside, break of 0.9506 will turn intraday bias to the upside for 0.9579 resistance and above.
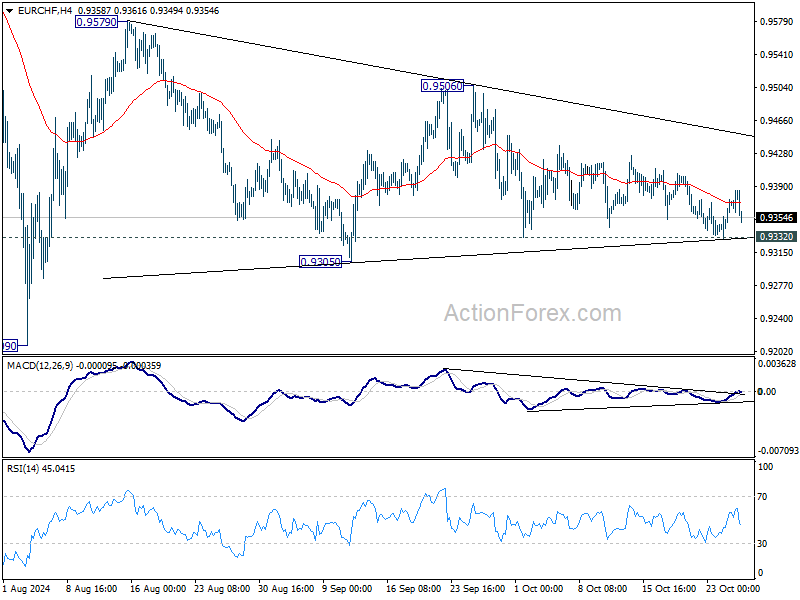
In the bigger picture, fall from 0.9928 is seen as part of the long term down trend. Repeated rejection by 55 D EMA (now at 0.9427) keeps outlook bearish for breaking through 0.9209 low at a later stage. Nevertheless, sustained trading above 55 D EMA will confirm medium term bottoming and bring stronger rebound back towards 0.9928 key resistance.
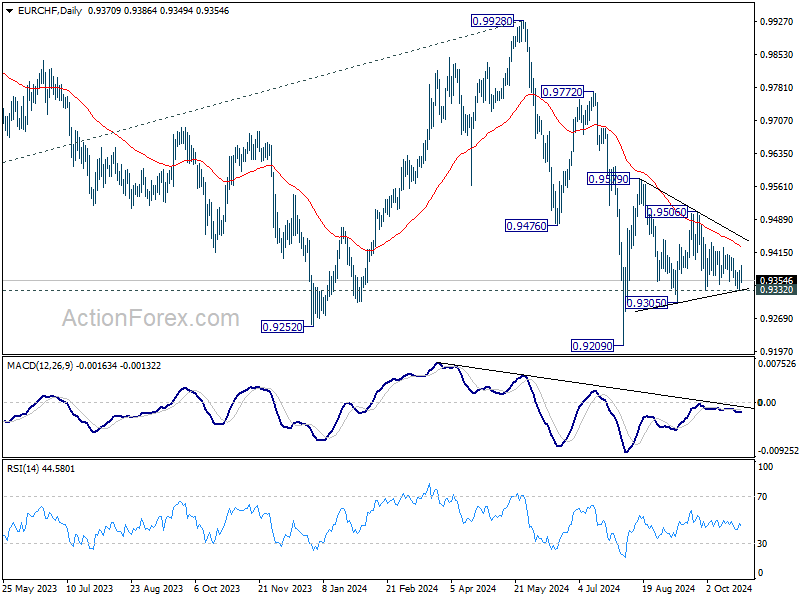
In the long term picture, fall from 1.2004 (2018 high) is part of the multi-decade down trend. Corrective pattern from 0.9407 (2022 low) might have completed with three waves to 0.9928. Decisive break of 0.9252 (2023 low) will confirm long term down trend resumption to 61.8% projection of 1.1149 to 0.9407 from 0.9928 at 0.8851. For now, outlook will stay bearish as long as 0.9928 resistance holds, even in case of strong rebound.