Sample Category Title
WTI Outlook: Oil Opens With Gap Lower as Supply Fears Fade After Israel’s Attack on Iran
WTI oil opened with wide gap lower on Monday and fell to the lowest levels in nearly one month, registering a drop of around 5% at the start of the week.
Israel’s attack on Iran over the weekend was a main oil driver with Iran’s oil facilities remaining intact that offset fears of energy supply disruption and deflated oil prices.
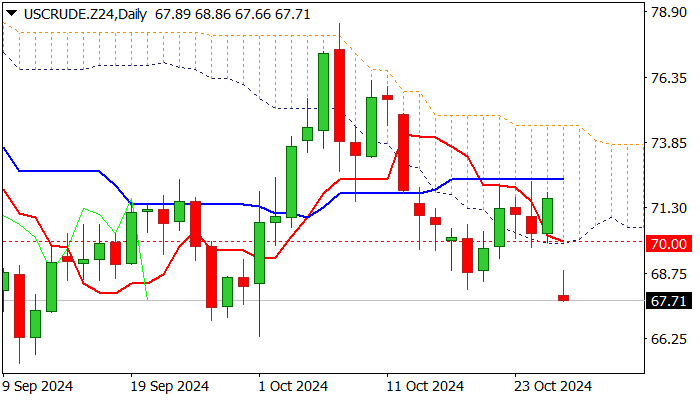
Monday’s sharp fall generated strong bearish signal on dip well below psychological $70 support (also the base of thick daily Ichimoku cloud) which held the action in past three days.
Also, breach of former higher low of Oct 18 ($68.15) added to negative outlook, along with short-lived recovery attempts in early European trading.
Bears pressure lower 20-d Bollinger band ($67.23) and eye Oct 1 spike low ($66.33) which guards key support at $65.26 (2024 low posted on Sep 10).
Close below $70 is seen as minimum requirement to keep bears in play, while close below $68.15 to reinforce bearish stance, as daily studies are in full bearish setup.
Res: 69.33; 70.00; 70.30; 71.00.
Sup: 67.23; 66.94; 66.33; 65.26.
Crypto Overcomes Last Week’s Corrective Sentiment
Market Picture
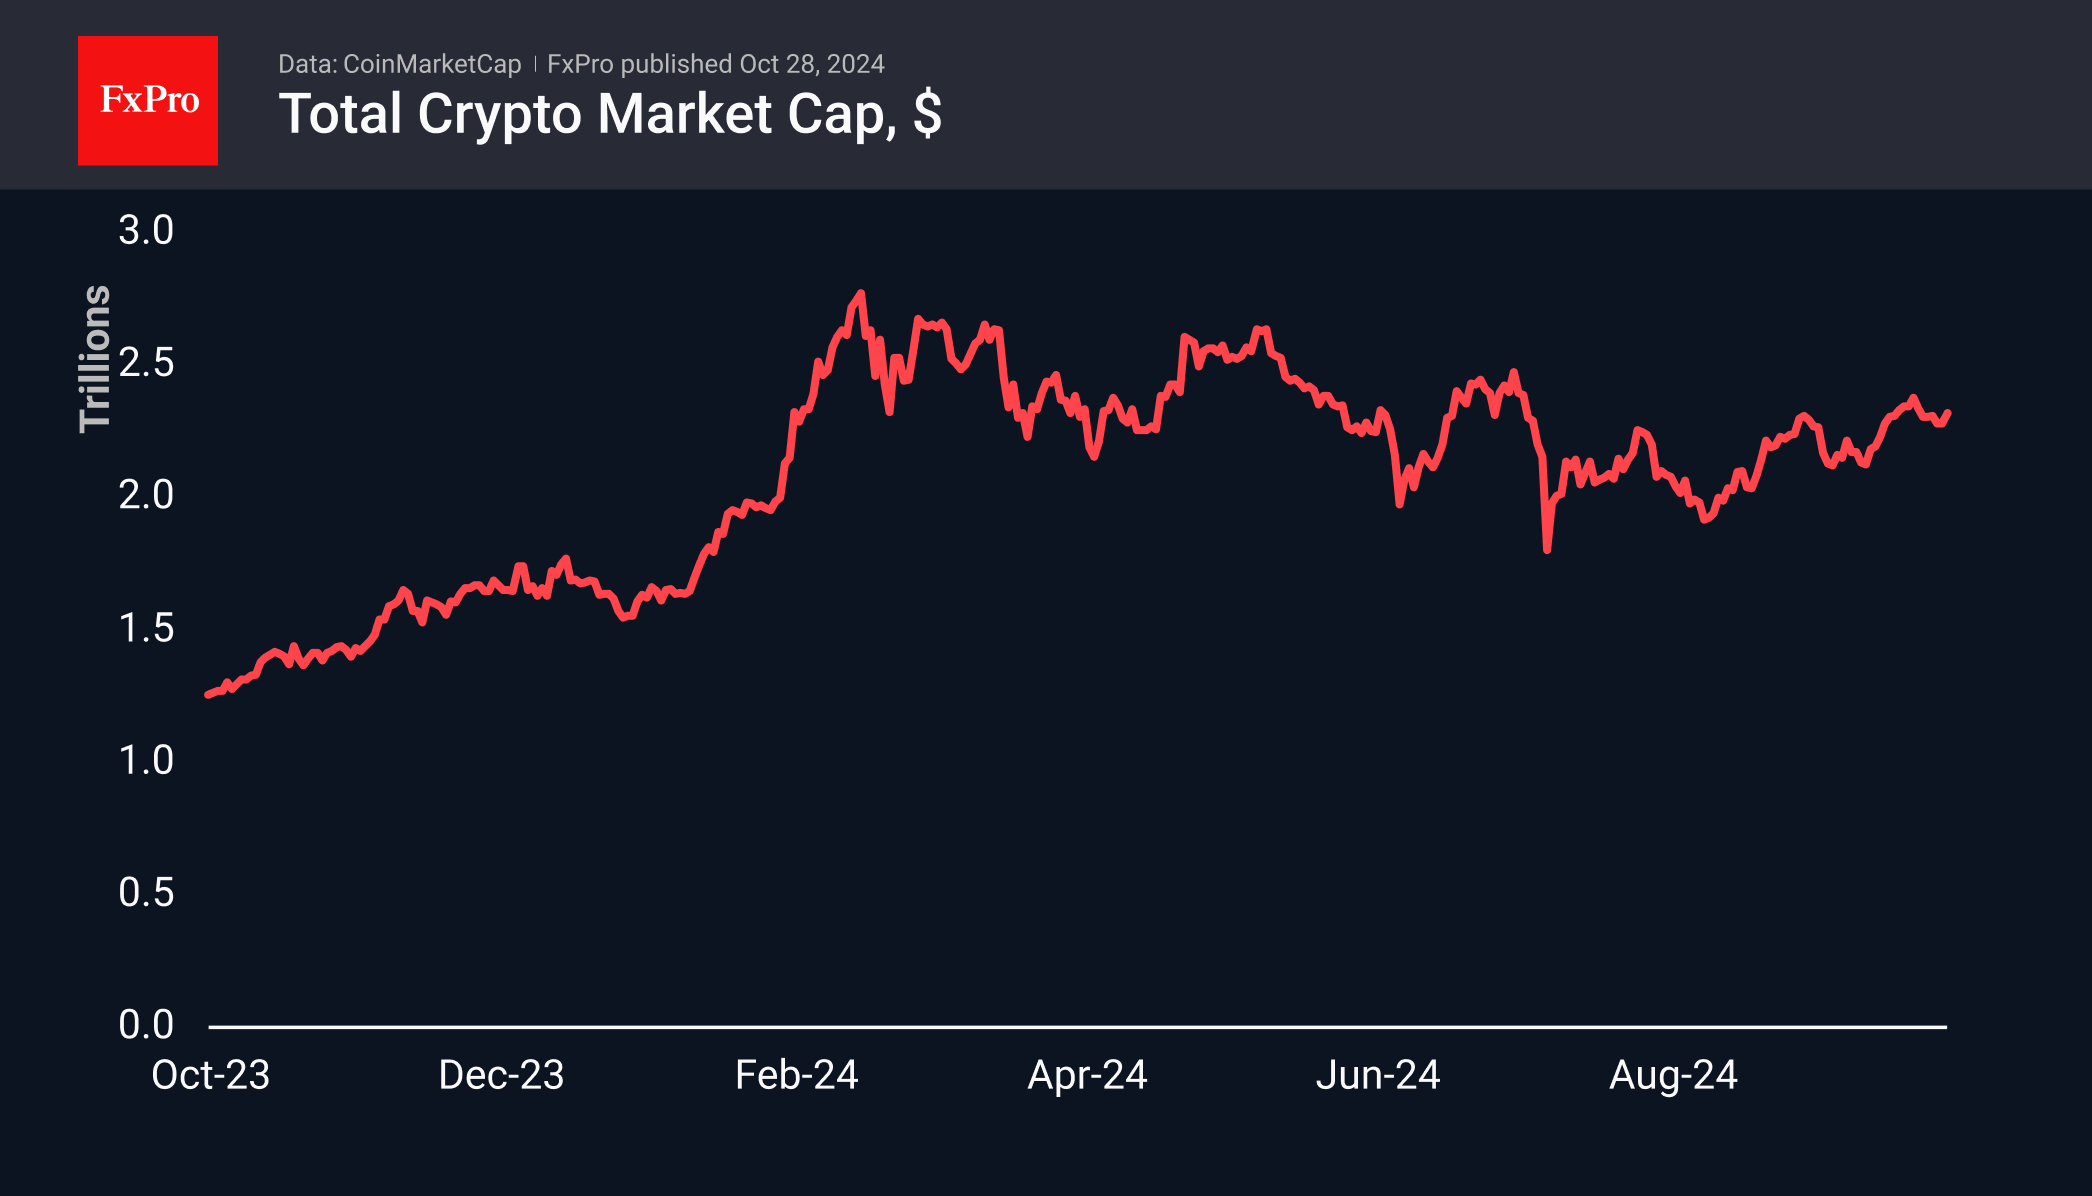
Last week, the cryptocurrency market was dominated by a risk-off sentiment that saw the total crypto market capitalisation fall from $2.4 trillion to $2.2 trillion. However, on Saturday, higher volumes led to a price recovery, bringing the market back to the $2.3 trillion valuation it started the week with. The sentiment index is at 72, having been in the 69-74 range for the past twelve days.
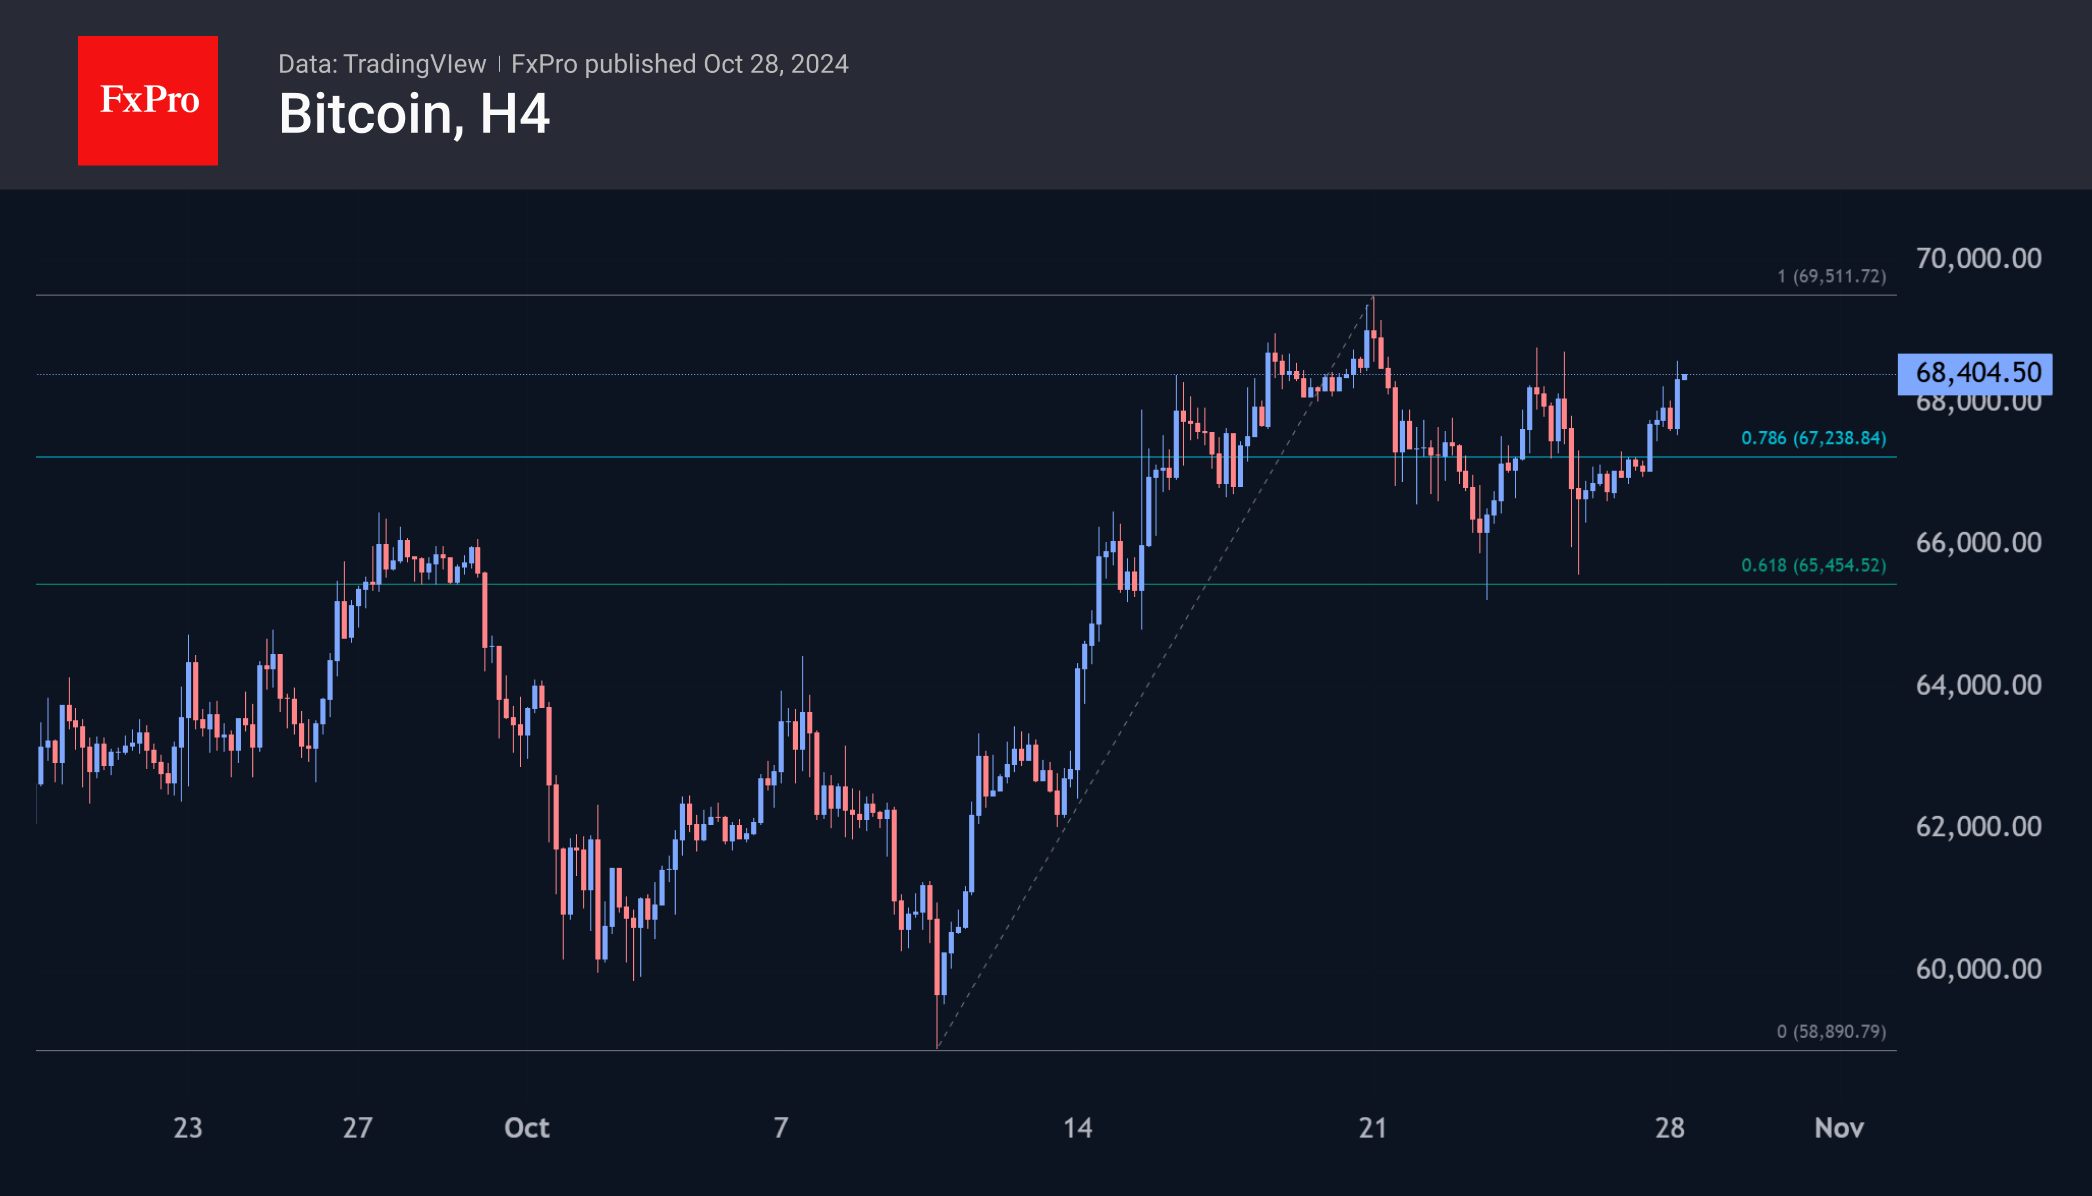
Bitcoin climbed to $68.4K, entering the range of the last six days. Last week, the market corrected the October 10th-20th gains, potentially paving the way for fresh upside momentum. Fibonacci pattern extensions suggest a potential upside to $76K, but the $70K and $72K areas could be a notable obstacle on the way.
News Background
Inflows into US spot Bitcoin ETFs continued for a third week, albeit at a slower pace. According to data from SoSoValue, inflows into BTC ETFs totalled $997.7 million last week, bringing the total to $21.93 billion since their launch in January.
The Ethereum ETF saw renewed outflows, totalling $24.5 million last week. Net outflows have risen to $504.4 million since the product’s launch.
Options on Deribit indicate only a 10% chance of Bitcoin hitting $100,000, notes CoinDesk analyst Omkar Godbole. Most market participants expect BTC to move towards the $80,000 mark.
Bitcoin alone isn’t enough to kick off the altcoin season just yet. According to Hashkey Capital, the altcoin season will be when BTC crosses $80K. Historically, the altcoin rally has been associated with BTC’s market dominance index rising to levels in the 62-70% range.
According to the Wall Street Journal, US authorities are investigating USDT issuer Tether for alleged violations of sanctions and anti-money laundering rules. Tether CEO Paolo Ardoino denies the information about the investigation.
EUR/USD Dives, USD/JPY Remains In Strong Uptrend
EUR/USD declined from the 1.0880 resistance and corrected gains. USD/JPY is rising and might gain pace above the 153.85 resistance.
Important Takeaways for EUR/USD and USD/JPY Analysis Today
- The Euro started a fresh decline below the 1.0850 support zone.
- There was a break below a connecting bullish trend line with support at 1.0805 on the hourly chart of EUR/USD at FXOpen.
- USD/JPY climbed higher above the 150.50 and 152.20 levels.
- There was a break above a key contracting triangle with resistance at 152.00 on the hourly chart at FXOpen.
EUR/USD Technical Analysis
On the hourly chart of EUR/USD at FXOpen, the pair struggled to clear the 1.0880 resistance zone. The Euro started a fresh decline and traded below the 1.0850 support zone against the US Dollar.
The pair declined below 1.0820 and tested the 1.0760 zone. A low was formed near 1.0761 and the pair recently attempted a recovery wave. There was a minor recovery wave above the 1.0800 level. However, the bears were active near 1.0840 and the pair started another decline.
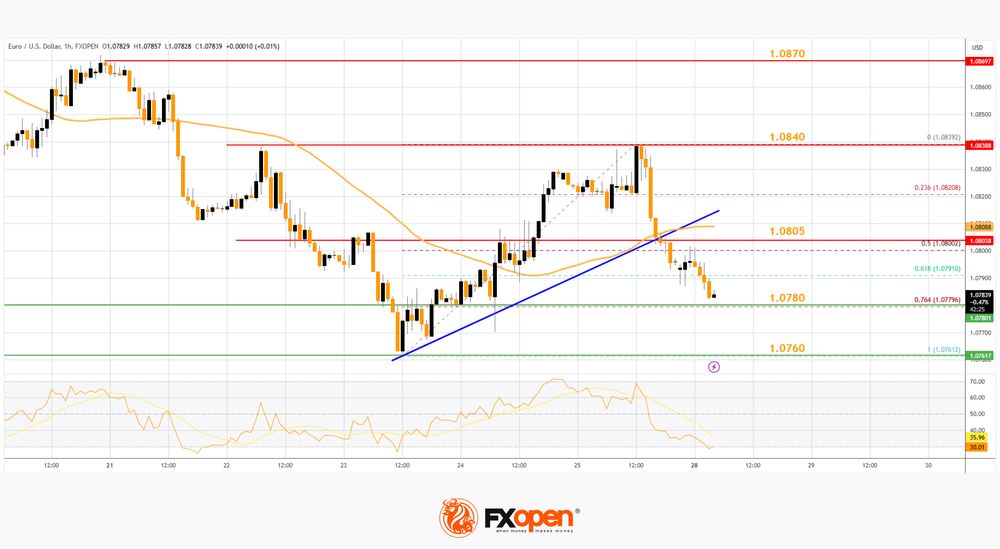
There was a move below the 1.0820 level. The pair declined below the 50% Fib retracement level of the recovery wave from the 1.0761 swing low to the 1.0839 high.
Besides, there was a break below a connecting bullish trend line with support at 1.0805. The pair is now trading below 1.0800 and the 50-hour simple moving average.
On the upside, the pair is now facing resistance near the 1.0805 level. The next key resistance is at 1.0840. The main resistance is near the 1.0870 level. A clear move above the 1.0870 level could send the pair toward the 1.0950 resistance.
An upside break above 1.0950 could set the pace for another increase. In the stated case, the pair might rise toward 1.0980. If not, the pair might resume its decline. The first major support on the EUR/USD chart is near 1.0780 and the 76.4% Fib retracement level of the recovery wave from the 1.0761 swing low to the 1.0839 high.
The next key support is at 1.0760. If there is a downside break below 1.0760, the pair could drop toward 1.0720. The next support is near 1.0650, below which the pair could start a major decline.
USD/JPY Technical Analysis
On the hourly chart of USD/JPY at FXOpen, the pair started a fresh upward move from the 149.00 zone. The US Dollar gained bullish momentum above 150.50 against the Japanese Yen.
It even cleared the 50-hour simple moving average and 152.00. There was a break above a key contracting triangle with resistance at 152.00. The pair climbed above 153.50 and traded as high as 153.88.
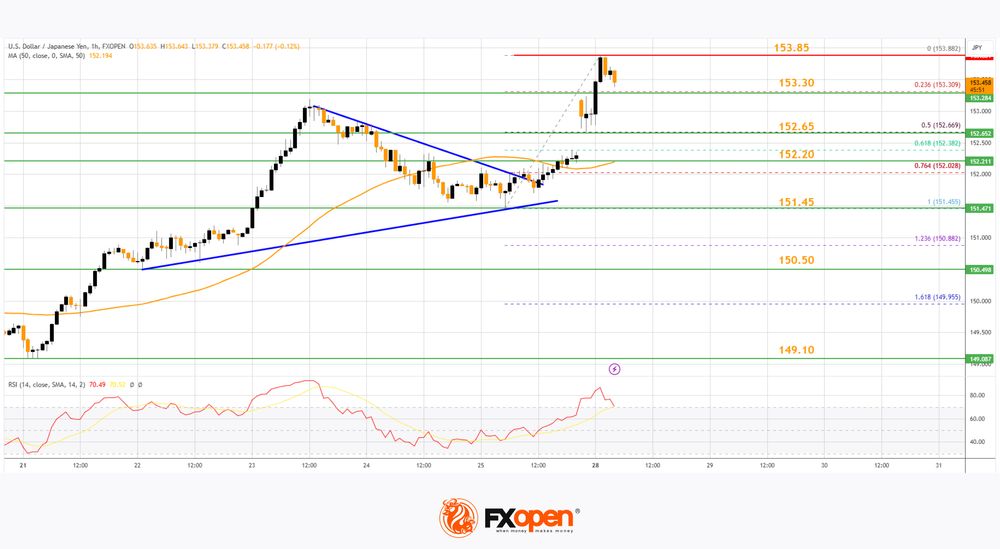
It is now consolidating gains above the 23.6% Fib retracement level of the upward move from the 151.45 swing low to the 153.88 high.
The current price action above the 153.20 level is positive. Immediate resistance on the USD/JPY chart is near 153.85. The first major resistance is near 154.20. If there is a close above the 154.20 level and the RSI moves above 65, the pair could rise toward 155.00.
The next major resistance is near 155.85, above which the pair could test 157.00 in the coming days. On the downside, the first major support is 153.20, below which the bears could gain strength.
The next major support is visible near the 50% Fib retracement level of the upward move from the 151.45 swing low to the 153.88 high at 152.65. If there is a close below 152.65, the pair could decline steadily. In the stated case, the pair might drop toward the 152.20 support zone. The next stop for the bears may perhaps be near the 151.45 region.
Trade over 50 forex markets 24 hours a day with FXOpen. Take advantage of low commissions, deep liquidity, and spreads from 0.0 pips. Open your FXOpen account now or learn more about trading forex with FXOpen.
This article represents the opinion of the Companies operating under the FXOpen brand only. It is not to be construed as an offer, solicitation, or recommendation with respect to products and services provided by the Companies operating under the FXOpen brand, nor is it to be considered financial advice.
A Bearish Gap on the Brent Crude Oil Chart
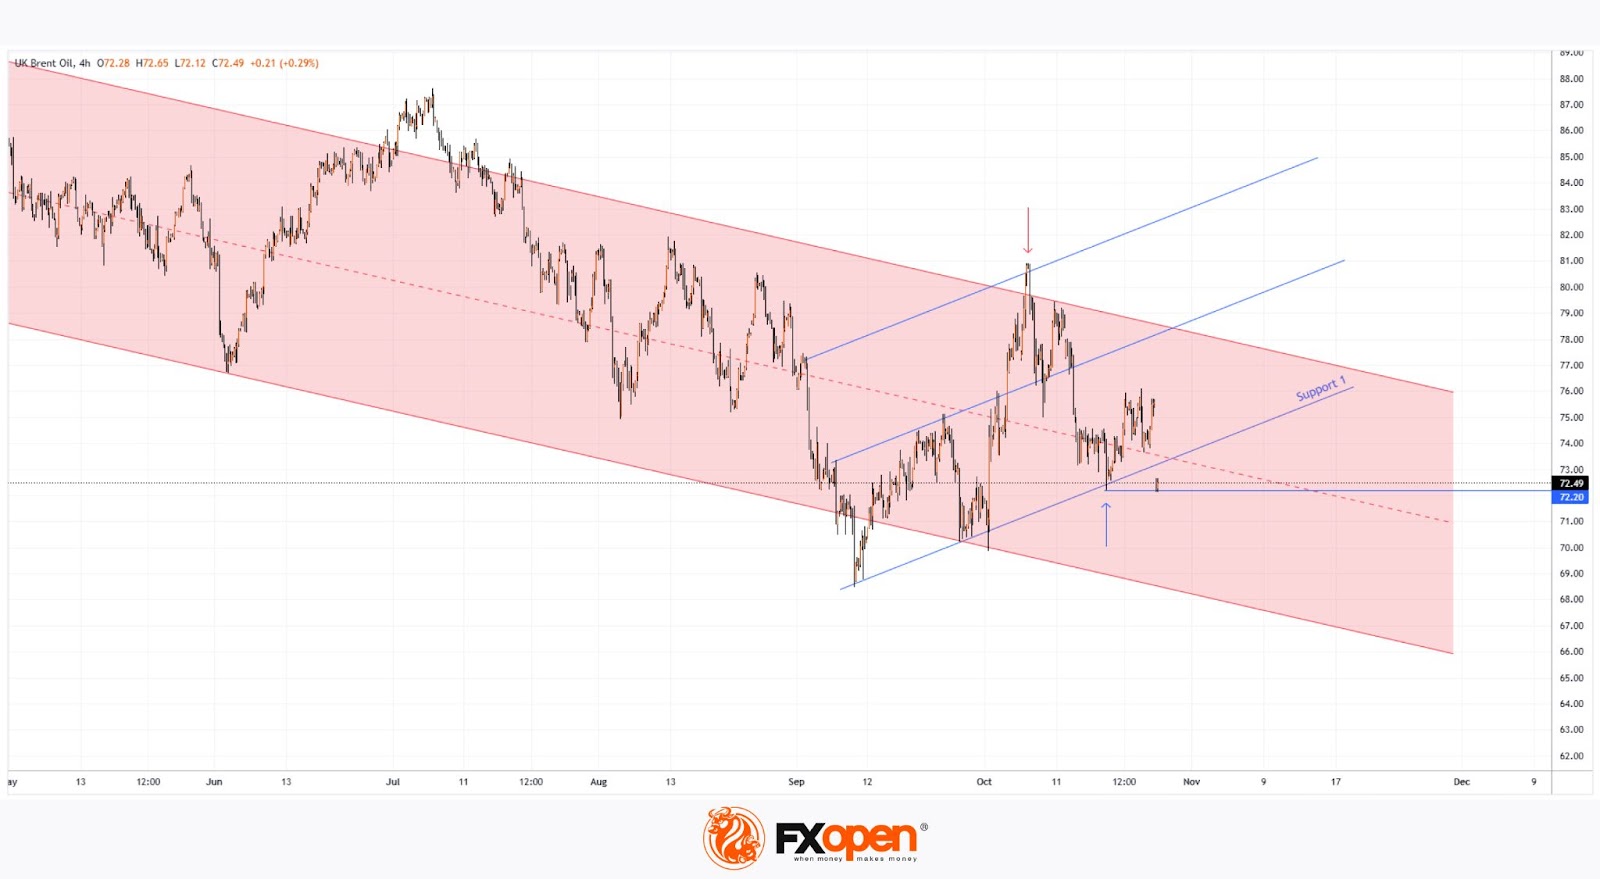
As the XBR/USD chart shows, Brent crude oil prices formed a gap at the start of this week: while Friday’s session closed at 75.60, Monday’s opening price dropped below 72.60.
According to Reuters, this development is tied to the fact that Israel’s recent missile strike on Iran did not impact oil or nuclear facilities, reducing the immediate risk of escalation.
Will Brent Crude Oil Prices Continue Falling?
In terms of technical analysis for XBR/USD today:
→ The price is within a descending channel (shown in red) that has been active since early summer. A bullish breakout attempt on 7 October was unsuccessful (marked by a red arrow), and Brent crude has since dropped over 10%. Price consolidation between 17-22 October near the median of this red channel confirms its current relevance.
→ Bulls had an opportunity to show strength with a bounce (marked by a blue arrow) from Support Line 1, which forms part of an upward structure represented by blue lines. However, today’s bearish gap erased these gains.
This allows traders to consider two scenarios:
→ Bearish Scenario: After breaking below Support, Brent could continue along the red descending channel. If the channel’s median line holds as resistance, this bearish outlook may be confirmed.
→ Bullish Scenario: Today’s bearish breach of the 18 October low could prove false, leading to a potential recovery back toward the structure of three blue lines.
Ultimately, which scenario plays out will largely depend on volatile news related to geopolitical tensions, the U.S. presidential election, and economic data from major economies.
Start trading commodity CFDs with tight spreads. Open your trading account now or learn more about trading commodity CFDs with FXOpen.
This article represents the opinion of the Companies operating under the FXOpen brand only. It is not to be construed as an offer, solicitation, or recommendation with respect to products and services provided by the Companies operating under the FXOpen brand, nor is it to be considered financial advice.
EURUSD Halts Decline But Downside Risks Persist
- EURUSD turns flat around 1.0790
- But momentum indicators stuck deep in bearish territory
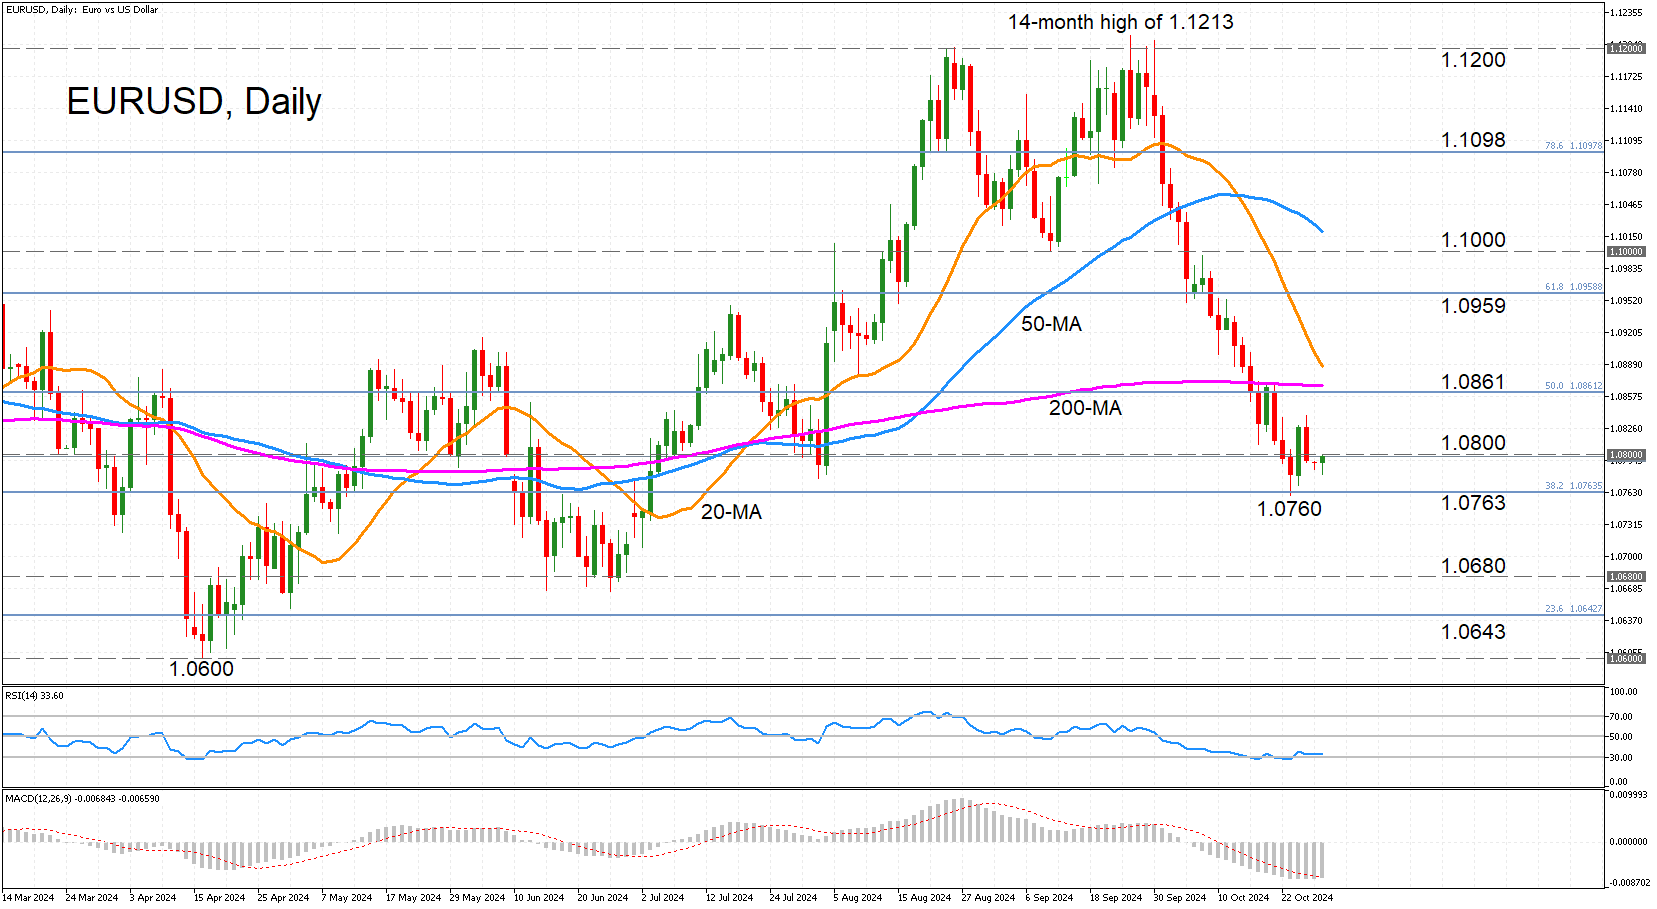
EURUSD has steadied around 1.0790 after its rebound from the 16-week low of 1.0760 faltered. However, whilst there is slight positive energy on Monday, with the price inching higher, the momentum indicators are overwhelmingly within the bearish zone.
Nevertheless, the selling pressure appears to be easing and a bullish reversal is possible in the near term as the RSI has flatlined just above the oversold level while the MACD has just crossed above its red signal line.
However, for any rebound attempt to succeed, the bulls would first need to overcome the immediate obstacle of 1.0800. A climb above it would clear the path towards the 50% Fibonacci retracement of the July-October 2023 downleg at 1.0861. The 200-day simple moving average (SMA) is descending towards it, making this a critical resistance area. Higher up, the 61.8% Fibonacci of 1.0959 is the next major hurdle before attention turns to the 1.1000 handle and the 50-day SMA that’s approaching it from above.
If, though, the price dips lower again, the October low of 1.0760 is likely to be revisited. A break below it would reinforce the bearish outlook in the medium term and the focus would then shift to the 1.0680 support and the April trough of 1.0600.
To sum up, there is some hope of an upside reversal in the near term despite the bearish signals. But for any rebound to get off on a solid footing, the price would have to recover at least until the 200-day SMA.
ECB’s Wunsch: Soft landing likely, no immediate need to accelerate rate cuts
In an interview with Reuters, Belgian ECB Governing Council member Pierre Wunsch emphasized the importance of patience regarding monetary policy adjustments, pointing to strong employment figures and rising real wages as signals of economic resilience.
Wunsch remarked that with the economy likely headed for a "soft landing," there is “no urgency in further accelerating the easing of monetary policy.”
Wunsch downplayed temporary inflation undershooting, and warned against "overdramatize such an event". He added, "Being a bit below 2% is not a big event if the medium term continues to point to 2%," especially if driven by a favorable terms of trade shock.
Wunsch further cautioned against making premature decisions ahead of December’s ECB meeting, noting that several high-stakes developments are expected in the coming weeks.
"We’ll have so much information until then, including two more inflation readings and new staff projections," he said. "There will be a U.S. election, and we also need to see how the conflict in the Middle East develops, so discussing precise levels is premature."
EUR/USD Weakens Amid Global Economic Uncertainty and Strong US Dollar
The EUR/USD pair began the week around 1.0789, reflecting heightened global economic uncertainties and a strong inclination towards safe-haven assets. The appeal of the US dollar is bolstered by rising US government bond yields and positive consumer confidence indicators from the University of Michigan, which reported a rise to 70.5 points in October, surpassing expectations.
The preference for the US dollar as a safe haven was notably evident over the weekend during Japan's general election, underscoring the currency's reliability in times of political and economic uncertainty.
Looking ahead, the EUR/USD pair faces a critical week with upcoming releases of October's labor market data from the US. These figures are crucial as they could influence the Federal Reserve's cautious stance on interest rate adjustments. Current market expectations lean towards two rate cuts by the end of the year, each by 25 basis points. However, upcoming employment data could potentially recalibrate these expectations, impacting the EUR/USD trajectory.
Technical Analysis of EUR/USD
H4 Chart Analysis: The EUR/USD has recently completed an upward wave reaching towards 1.0838 and is now undergoing a correction towards 1.0780. Should this correction complete, anticipation for a new growth wave towards 1.0850 will increase, potentially leading to the formation of a consolidation range around this level. A break above this range could extend the upward momentum towards 1.0944. The MACD indicator supports this potential, with its signal line positioned below zero but pointing upwards, suggesting an impending positive shift in momentum.
H1 Chart Analysis: On the hourly chart, the EUR/USD has stretched a growth structure to 1.0838 and is currently correcting towards 1.0780. Once this correction target is met, a new upward movement is expected to commence towards 1.0815, with potential to continue towards 1.0850. This forecast is backed by the Stochastic oscillator, whose signal line is rising from above 20 towards 80, indicating the likelihood of continued upward price action.
EUR/USD Daily Outlook
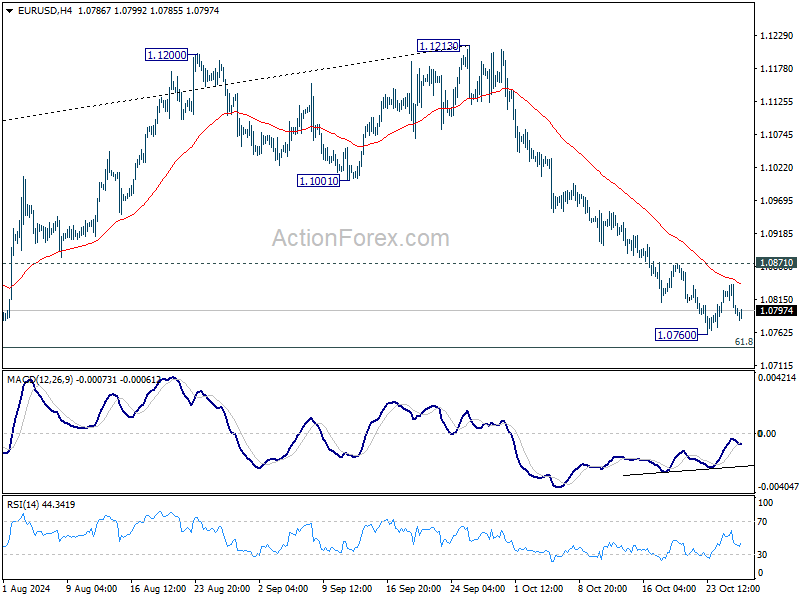
Daily Pivots: (S1) 1.0780; (P) 1.0809; (R1) 1.0826; More...
Intraday bias in EUR/USD remains neutral and more consolidations could be seen above 1.0760 temporary low. Further decline is expected as long as 1.0871 resistance holds. Below 1.0760 will target 61.8% retracement of 1.0447 to 1.1213 at 1.0740. Firm break there will target 1.0601 support next. However, considering bullish convergence condition in 4H MACD, break of 1.0871 will indicate short term bottoming, and turn bias back to the upside for 55 D EMA (now at 1.0956).
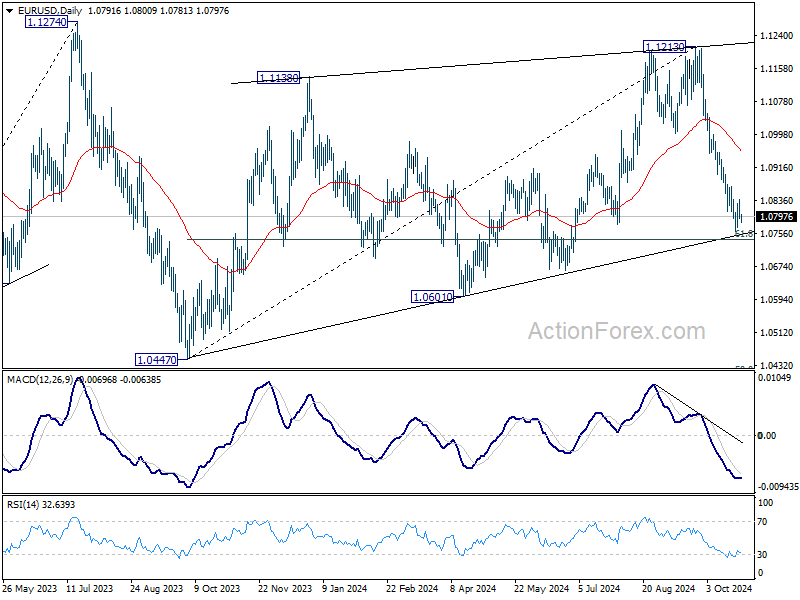
In the bigger picture, price actions from 1.1274 (2023 high) are seen as a consolidation pattern to up trend from 0.9534 (2022 low), with fall from 1.1213 as the third leg. Downside should be contained by 50% retracement of 0.9534 (2022 low) to 1.1274 at 1.0404, to bring up trend resumption at a later stage.
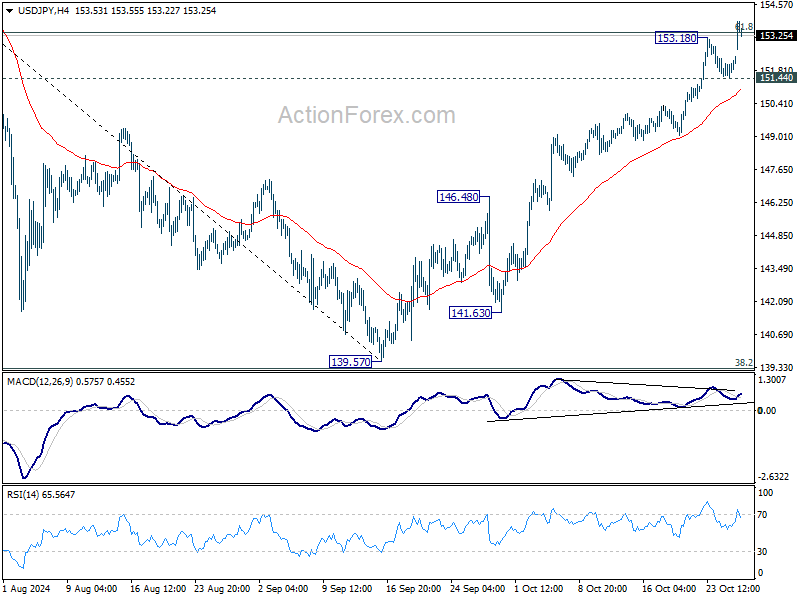
USD/JPY Daily Outlook
Daily Pivots: (S1) 151.68; (P) 152.03; (R1) 152.62; More...
USD/JPY's rally from 139.57 resumed after brief consolidations and intraday bias is back on the upside. Sustained trading above 61.8% retracement of 161.94 to 139.57 at 153.39 will pave the way to retest 161.94 high. On the downside, below 151.44 minor support will turn intraday bias neutral again first.
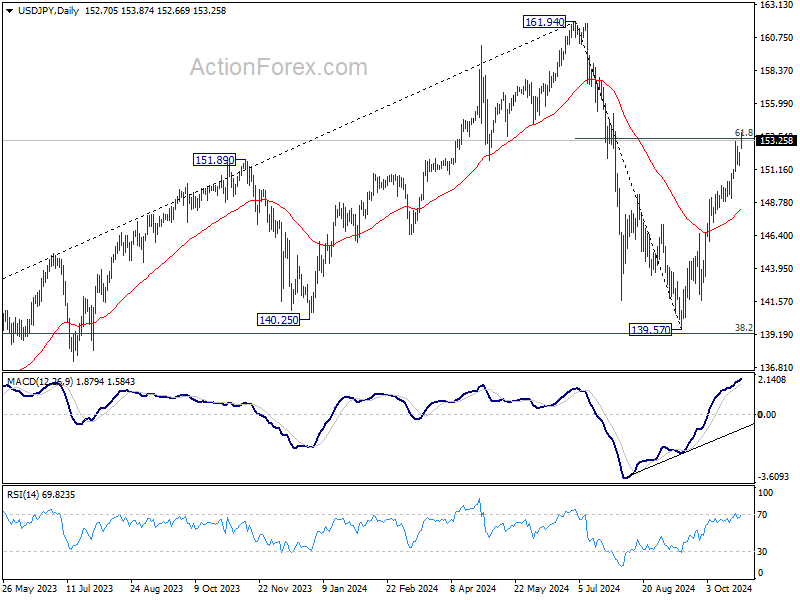
In the bigger picture, price actions from 161.94 are seen as a corrective pattern to rise from 102.58 (2021 low). The range of medium term consolidation should be set between 38.2% retracement of 102.58 to 161.94 at 139.26 and 161.94. Nevertheless, sustained break of 139.26 would open up deeper medium term decline to 61.8% retracement at 125.25.
GBP/USD Daily Outlook
Daily Pivots: (S1) 1.2946; (P) 1.2972; (R1) 1.2989; More...
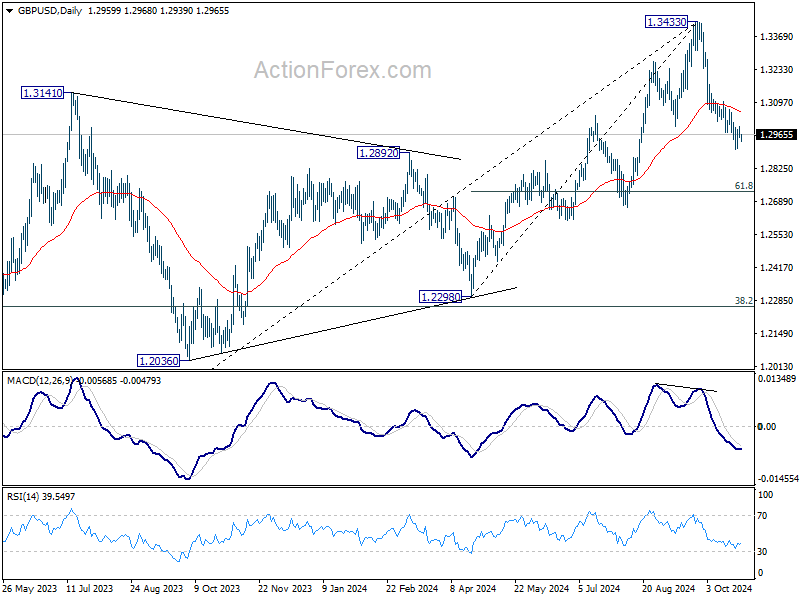
Intraday bias in GBP/USD remains neutral for the moment and some more consolidations could be seen above 1.2906 temporary low. Further decline is expected as long as 1.3070 minor resistance holds. Below 1.2906 will target 61.8% retracement of 1.2298 to 1.3433 at 1.2732. However, considering bearish divergence condition in 4H MACD, firm break 1.3070 resistance will indicate short term bottoming, and turn bias back to the upside for stronger rebound.
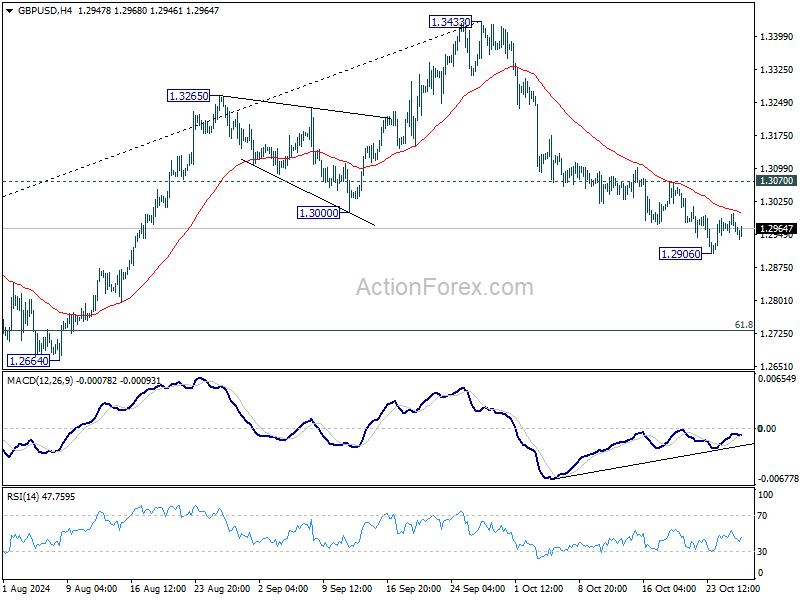
In the bigger picture, considering mildly bearish divergence condition in D MACD, a medium term top is likely in place at 1.3433 already. Price actions from there are seen as correction to whole up trend from 1.0351 (2022 low). Deeper decline would be seen to 38.2% retracement of 1.0351 to 1.3433 at 1.2256, which is close to 1.2298 structural support. Strong support should be seen there to bring rebound.