
Sample Category Title
USD/JPY Mid-Day Outlook
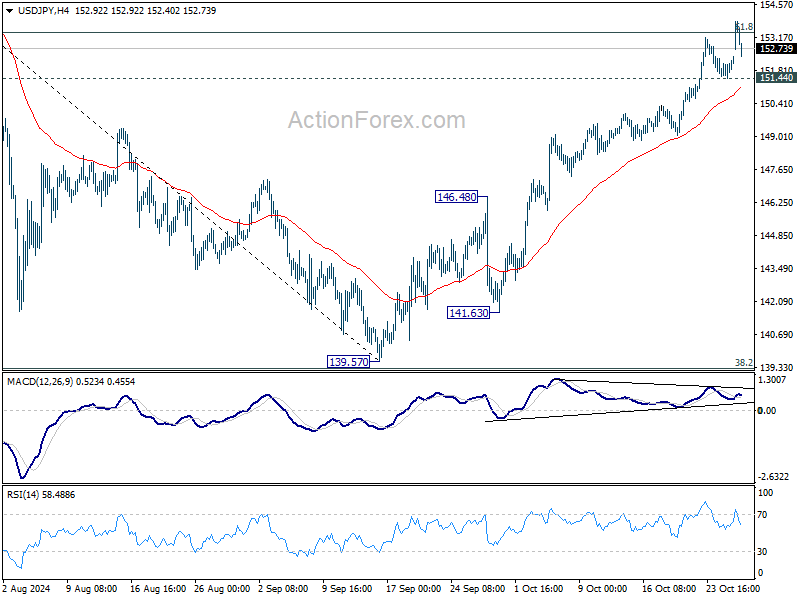
Daily Pivots: (S1) 151.68; (P) 152.03; (R1) 152.62; More...
Intraday bias in USD/JPY stays on the upside with 151.44 minor support intact. Sustained trading above 61.8% retracement of 161.94 to 139.57 at 153.39 will pave the way to retest 161.94 high. On the downside, below 151.44 minor support will turn intraday bias neutral again first.
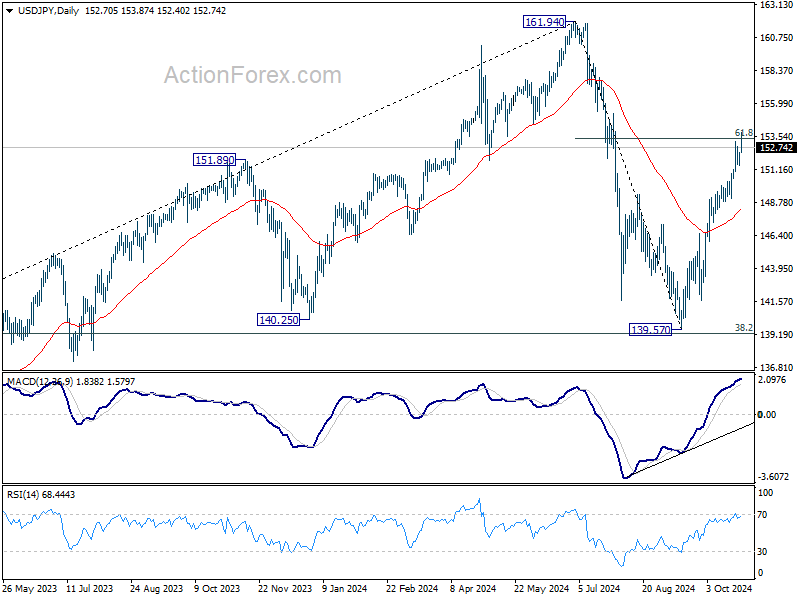
In the bigger picture, price actions from 161.94 are seen as a corrective pattern to rise from 102.58 (2021 low). The range of medium term consolidation should be set between 38.2% retracement of 102.58 to 161.94 at 139.26 and 161.94. Nevertheless, sustained break of 139.26 would open up deeper medium term decline to 61.8% retracement at 125.25.
USD/CHF Mid-Day Outlook
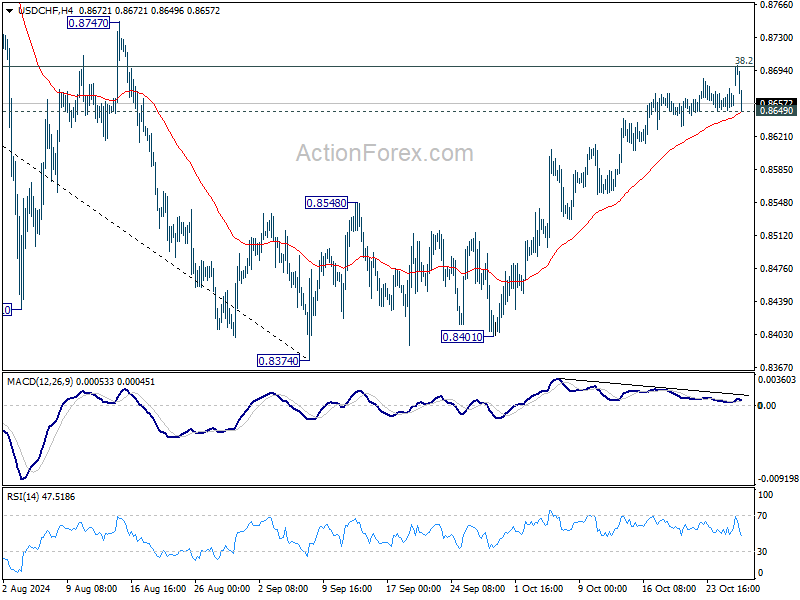
Daily Pivots: (S1) 0.8652; (P) 0.8664; (R1) 0.8679; More…
Intraday bias in USD/CHF stays mildly on the upside with 0.8469 minor support intact. Decisive break of 38.2% retracement of 0.9223 to 0.8374 at 0.8698 will argue that fall from 0.9223 has completed after defending 0.8332 low. Further rally should then be seen to 61.8% retracement at 0.8899 next. On the downside, below 0.8649 minor support will turn intraday bias neutral again first.
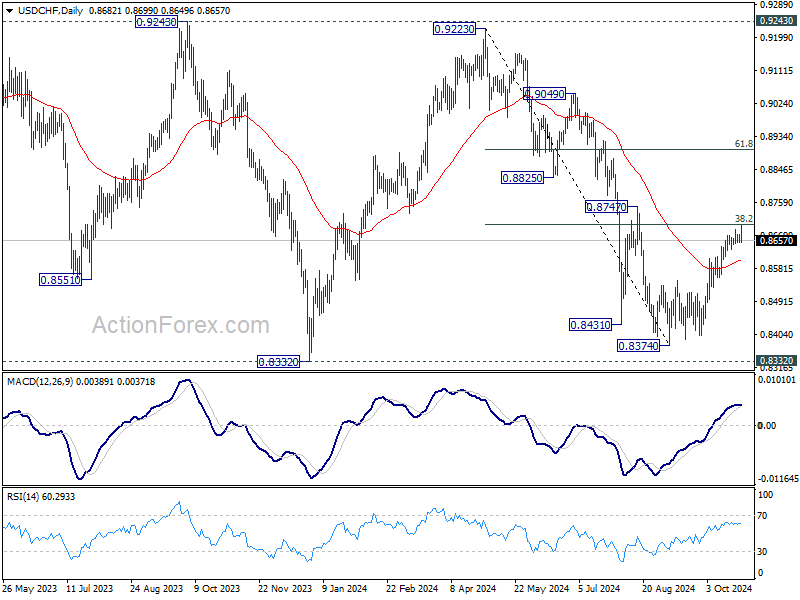
In the bigger picture, price actions from 0.8332 (2023 low) are currently seen as a medium term corrective pattern, with fall from 0.9223 as the second leg. Strong support could be seen from 0.8332 to bring rebound. Yet, overall outlook will continue to stay bearish as long as 0.9243 resistance holds. Firm break of 0.8332, however, will resume larger down trend from 1.0146 (2022 high).
GBP/USD Mid-Day Outlook
Daily Pivots: (S1) 1.2946; (P) 1.2972; (R1) 1.2989; More...
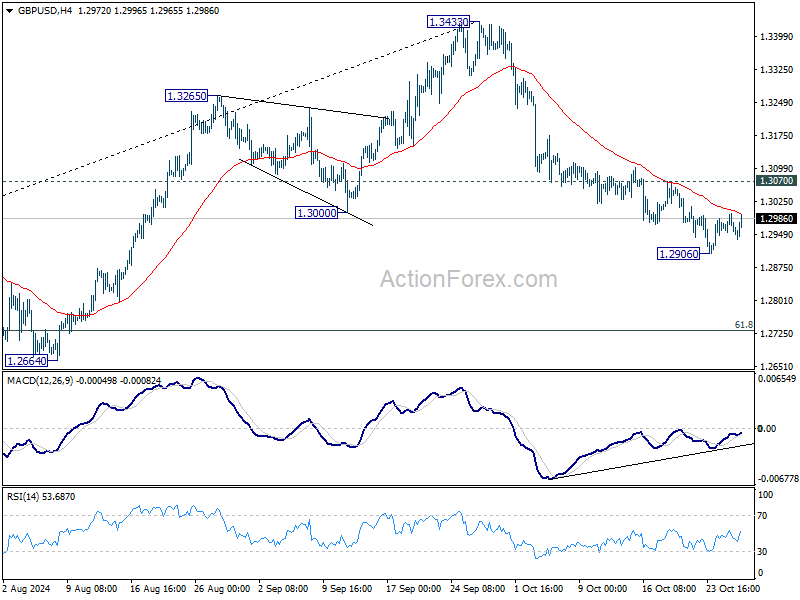
GBP/USD is staying in consolidation above 1.2906 and intraday bias remains neutral for the moment. Further decline is expected as long as 1.3070 minor resistance holds. Below 1.2906 will target 61.8% retracement of 1.2298 to 1.3433 at 1.2732. However, considering bearish divergence condition in 4H MACD, firm break 1.3070 resistance will indicate short term bottoming, and turn bias back to the upside for stronger rebound.
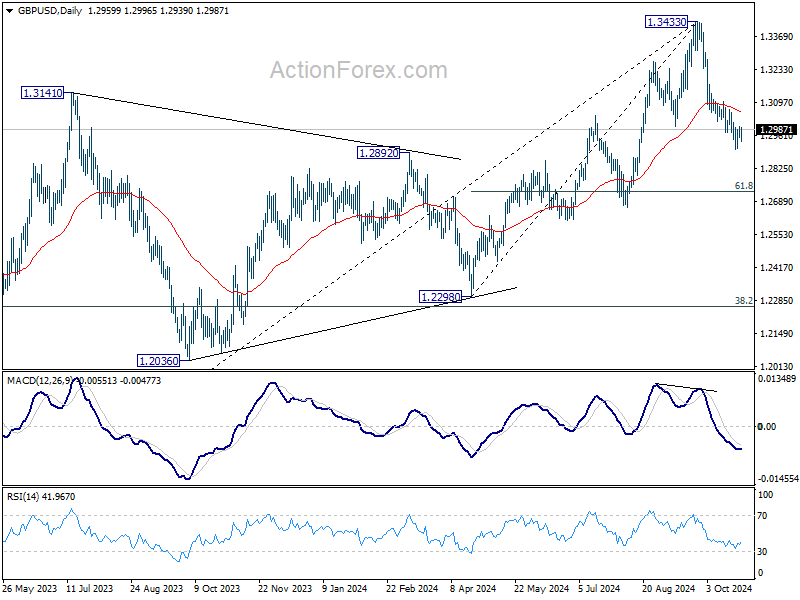
In the bigger picture, considering mildly bearish divergence condition in D MACD, a medium term top is likely in place at 1.3433 already. Price actions from there are seen as correction to whole up trend from 1.0351 (2022 low). Deeper decline would be seen to 38.2% retracement of 1.0351 to 1.3433 at 1.2256, which is close to 1.2298 structural support. Strong support should be seen there to bring rebound.
EUR/USD Mid-Day Outlook
Daily Pivots: (S1) 1.0780; (P) 1.0809; (R1) 1.0826; More...
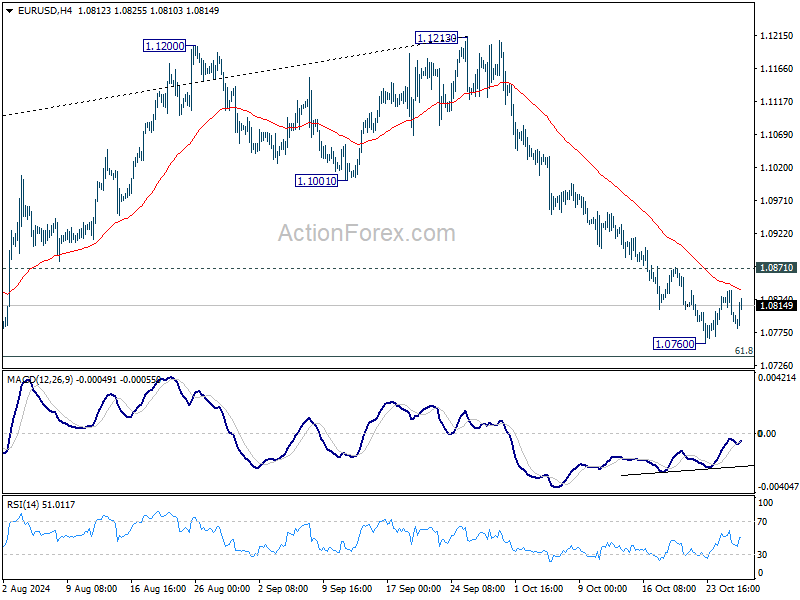
EUR/USD is extending consolidations above 1.0760 and intraday bias stays neutral. Further decline is expected as long as 1.0871 resistance holds. Below 1.0760 will target 61.8% retracement of 1.0447 to 1.1213 at 1.0740. Firm break there will target 1.0601 support next. However, considering bullish convergence condition in 4H MACD, break of 1.0871 will indicate short term bottoming, and turn bias back to the upside for 55 D EMA (now at 1.0956).
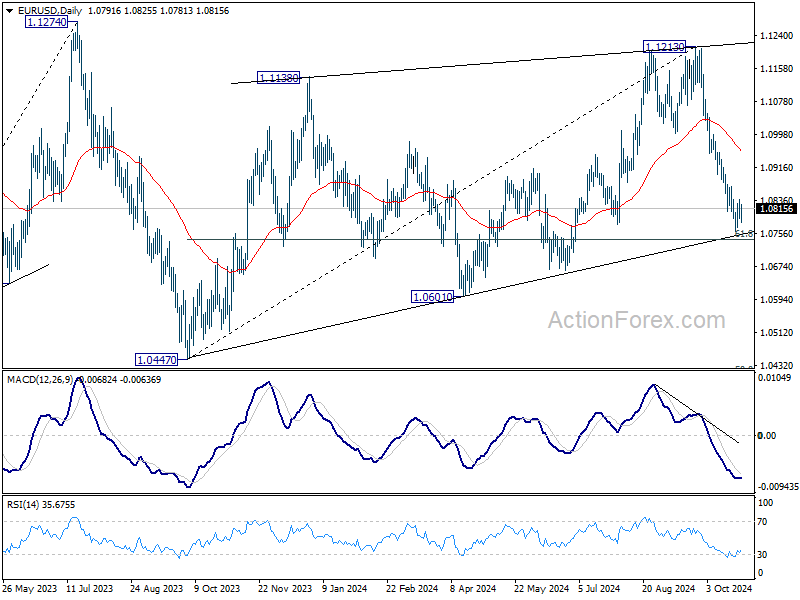
In the bigger picture, price actions from 1.1274 (2023 high) are seen as a consolidation pattern to up trend from 0.9534 (2022 low), with fall from 1.1213 as the third leg. Downside should be contained by 50% retracement of 0.9534 (2022 low) to 1.1274 at 1.0404, to bring up trend resumption at a later stage.
Yen Stabilizes Amid Political Speculation as Wage Growth Hits Record Levels
While Yen remains the weakest performer today, it has managed to recover part of its initial losses following the weekend’s inconclusive election. Investor sentiment stabilized somewhat on hopes that Japan's Liberal Democratic Party could still secure a majority in the lower house through a coalition with Komeito and smaller parties. Reports suggest that the government and ruling coalition are preparing to convene a special Diet session on November 11, leaving room for further political developments in the coming weeks.
Adding to Japan’s economic backdrop, average monthly wages in Japanese businesses reached a record 11,961 Yen this year, surpassing the 10,000-Yen mark for the first time. The 4.1% increase, the highest since 1999, reflects successful spring wage negotiations between management and labor unions, signaling a shift in Japan’s traditionally conservative pay culture. This sustained wage growth suggests that Japanese companies are responding to rising inflation, marking a third consecutive year of increases.
In the broader currency markets, Canadian Dollar follows Yen as the day’s second weakest currency, while Dollar ranks third after giving up early gains. Meanwhile, Euro is leading as the strongest, trailed by British Pound and New Zealand Dollar, with Swiss franc and Australian Dollar positioned in the middle.
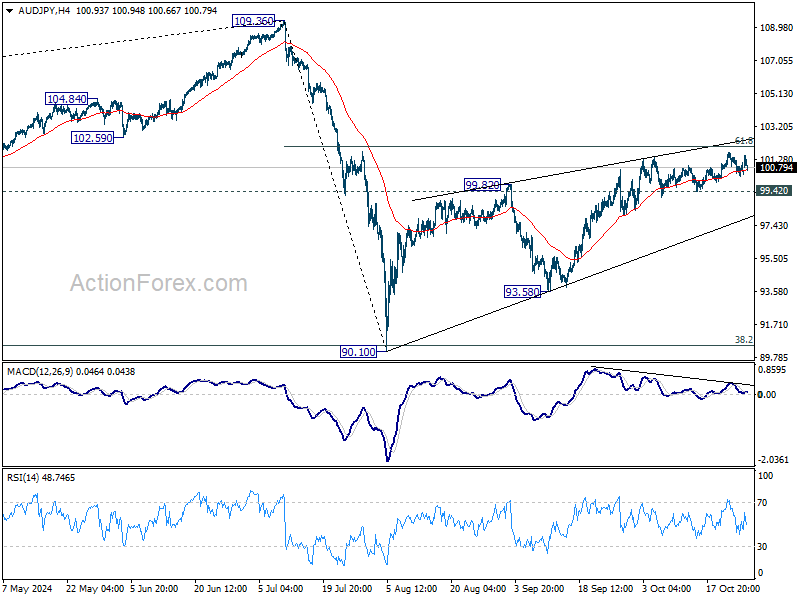
Technically, AUD/JPY has been a laggard in the rallies in Yen crosses today. Bearish divergence condition indicates continuous loss of upside momentum. While another rise cannot be ruled out, strong resistance could emerge at 61.8% retracement of 109.36 to 90.10 at 102.00 to limit upside. Break of 99.42 support should indicate short term topping, and bring deeper fall back towards 93.58 support.
In Europe, at the time of writing, FTSE is down -0.47%. DAX is down -0.25%. CAC is up 0.05%. UK 10-year yield is down -0.0243 at 4.215. Germany 10-year yield is down -0.0029 at 2.266. Earlier in Asia, Nikkei rose 1.92%. Hong Kong HSI rose 0.04%. China Shanghai SSE rose 0.68%. Singapore Strait Times fell -0.26%. Japan 10-year JGB yield rose 0.0227 at 0.975.
ECB’s Wunsch: Soft landing likely, no immediate need to accelerate rate cuts
In an interview with Reuters, Belgian ECB Governing Council member Pierre Wunsch emphasized the importance of patience regarding monetary policy adjustments, pointing to strong employment figures and rising real wages as signals of economic resilience.
Wunsch remarked that with the economy likely headed for a "soft landing," there is “no urgency in further accelerating the easing of monetary policy.”
Wunsch downplayed temporary inflation undershooting, and warned against "overdramatize such an event". He added, "Being a bit below 2% is not a big event if the medium term continues to point to 2%," especially if driven by a favorable terms of trade shock.
Wunsch further cautioned against making premature decisions ahead of December’s ECB meeting, noting that several high-stakes developments are expected in the coming weeks.
"We’ll have so much information until then, including two more inflation readings and new staff projections," he said. "There will be a U.S. election, and we also need to see how the conflict in the Middle East develops, so discussing precise levels is premature."
EUR/USD Mid-Day Outlook
Daily Pivots: (S1) 1.0780; (P) 1.0809; (R1) 1.0826; More...
EUR/USD is extending consolidations above 1.0760 and intraday bias stays neutral. Further decline is expected as long as 1.0871 resistance holds. Below 1.0760 will target 61.8% retracement of 1.0447 to 1.1213 at 1.0740. Firm break there will target 1.0601 support next. However, considering bullish convergence condition in 4H MACD, break of 1.0871 will indicate short term bottoming, and turn bias back to the upside for 55 D EMA (now at 1.0956).
In the bigger picture, price actions from 1.1274 (2023 high) are seen as a consolidation pattern to up trend from 0.9534 (2022 low), with fall from 1.1213 as the third leg. Downside should be contained by 50% retracement of 0.9534 (2022 low) to 1.1274 at 1.0404, to bring up trend resumption at a later stage.
NASDAQ Futures (NQ_F) Forecasting the Rally From the Equal Legs Zone
Hello fellow traders. In this technical article we’re going to take a look at the Elliott Wave charts charts of NASDAQ Futures (NQ_F) published in members area of the website. Our members know NQ_F is showing impulsive bullish sequences and we are favoring the long side. In this discussion, we’ll break down the Elliott Wave pattern and forecast.
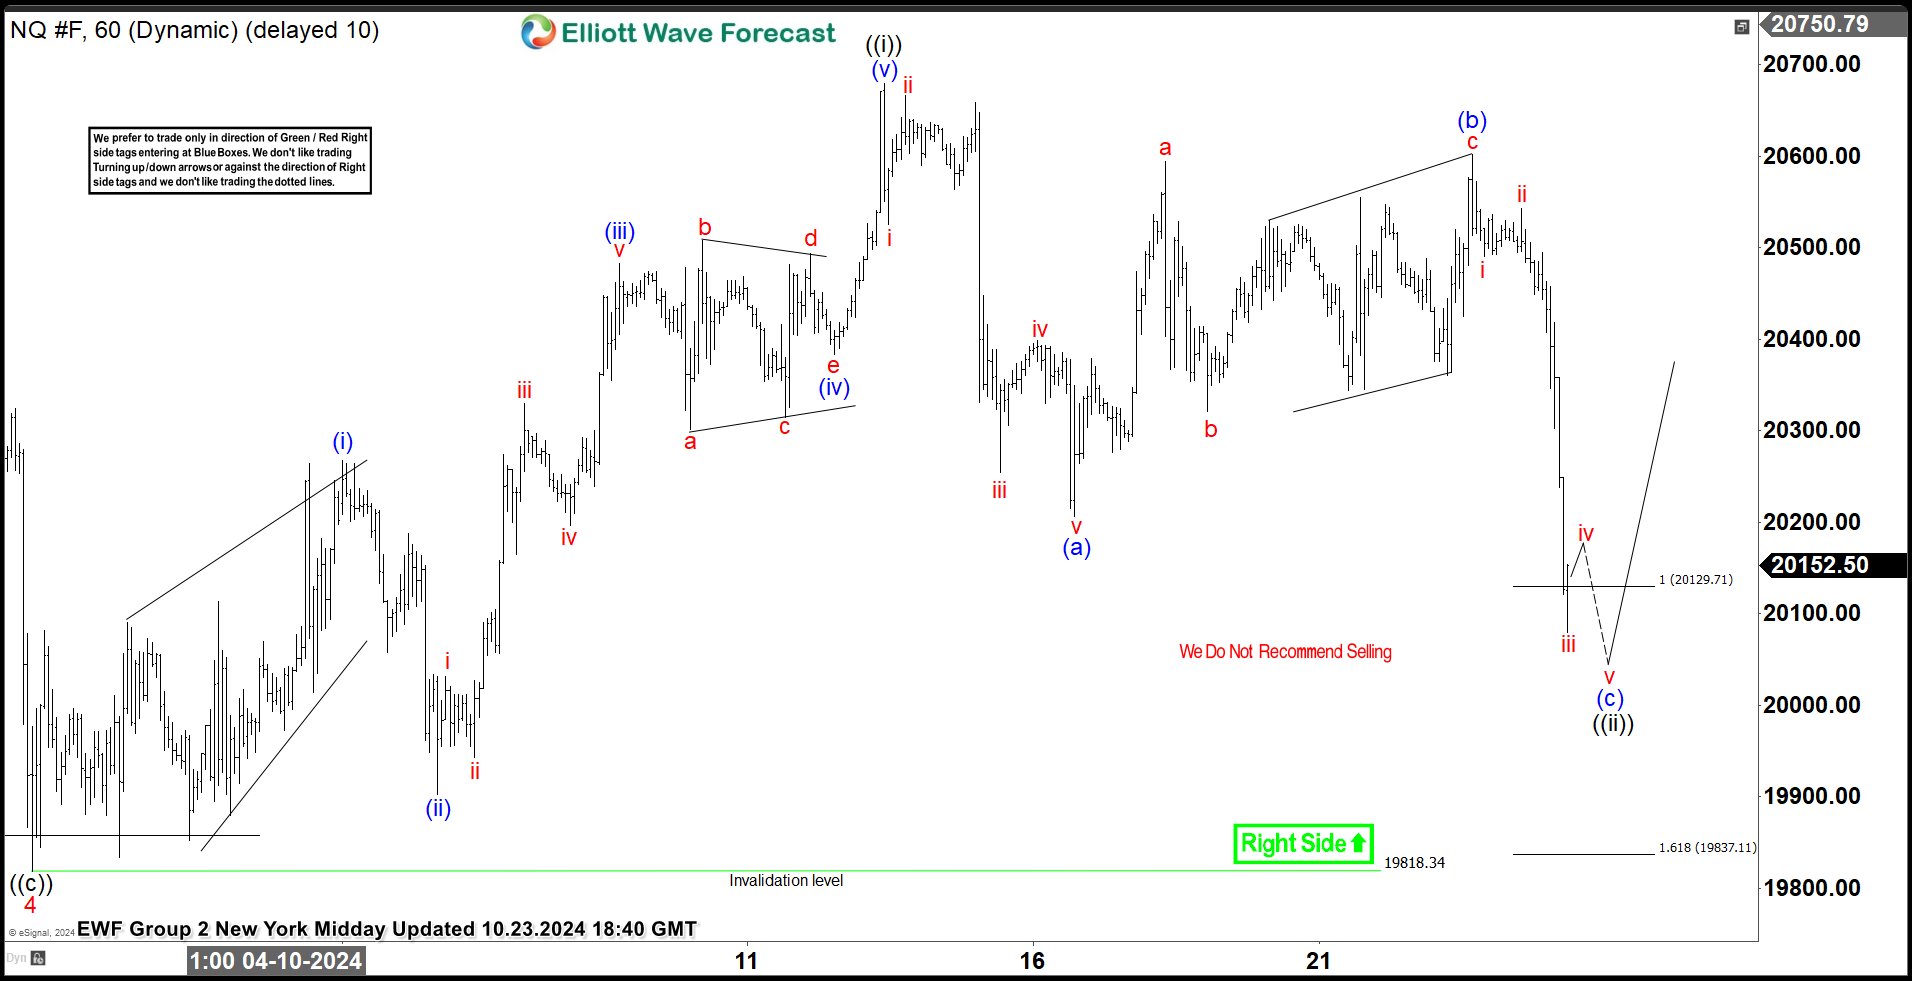
NASDAQ Elliott Wave 1 Hour Chart 10.23.2024
NASDAQ is giving us wave ((ii)) black correction. The futures has reached extreme zone from the peak at 20129- 19837 area. NQ_F shows clear 3 waves from the high, suggesting pull back could be ending any moment. Consequently , we expect rally in wave ((iii)) to happen any moment. We recommend members to avoid selling the futures and keep favoring the long side. As the main trend is bullish we expect to see rally toward new highs ideally or 3 waves bounce from the equal legs alternatively.
Official trading strategy on How to trade 3, 7, or 11 swing and equal leg is explained in details in Educational Video, available for members viewing inside the membership area.
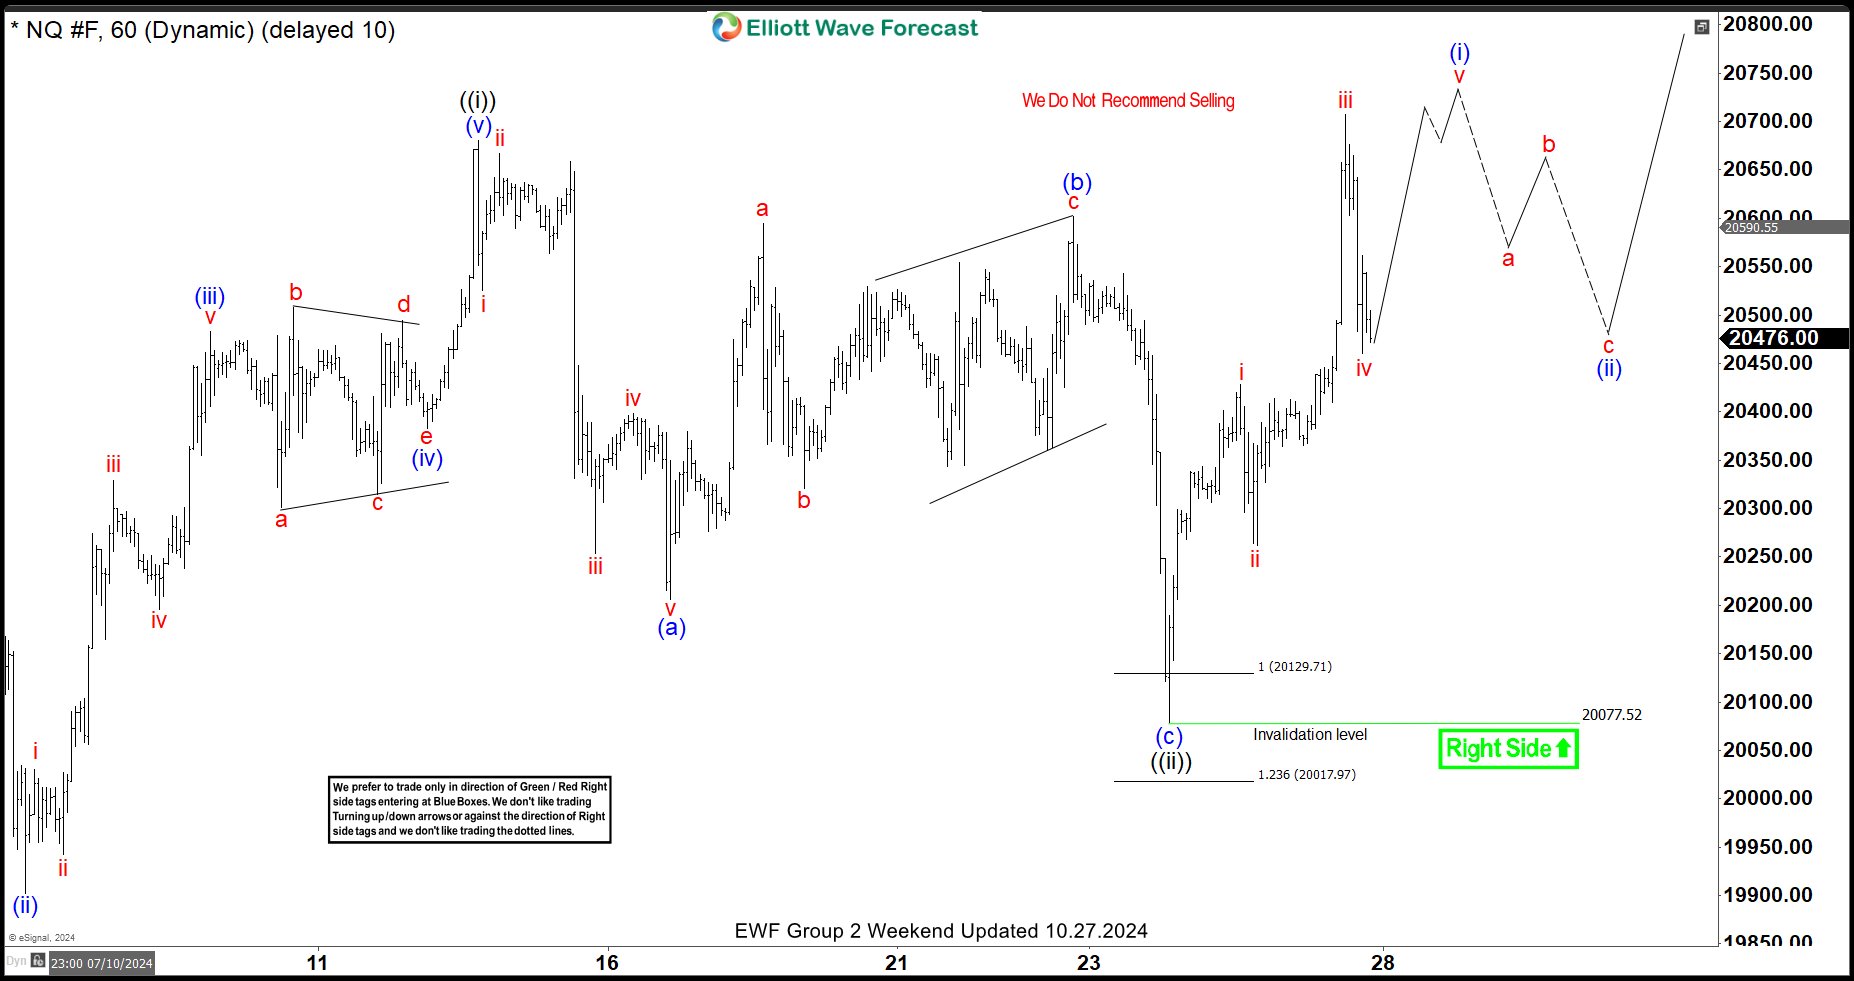
NASDAQ Elliott Wave 1 Hour Chart 10.23.2024
NASDAQ responded exactly as anticipated at the equal legs. The futures found buyers and made a substantial rally from our recommended buying zone. Eventually we got break of ((i)) black peak , confirming next leg up is in progress. The futures should ideally keep finding buyers in 3,7,11 swings sequences against the 20077.5 pivot.
GBP/AUD and GBP/NZD Pairs Step Into Final Leg of a Recovery
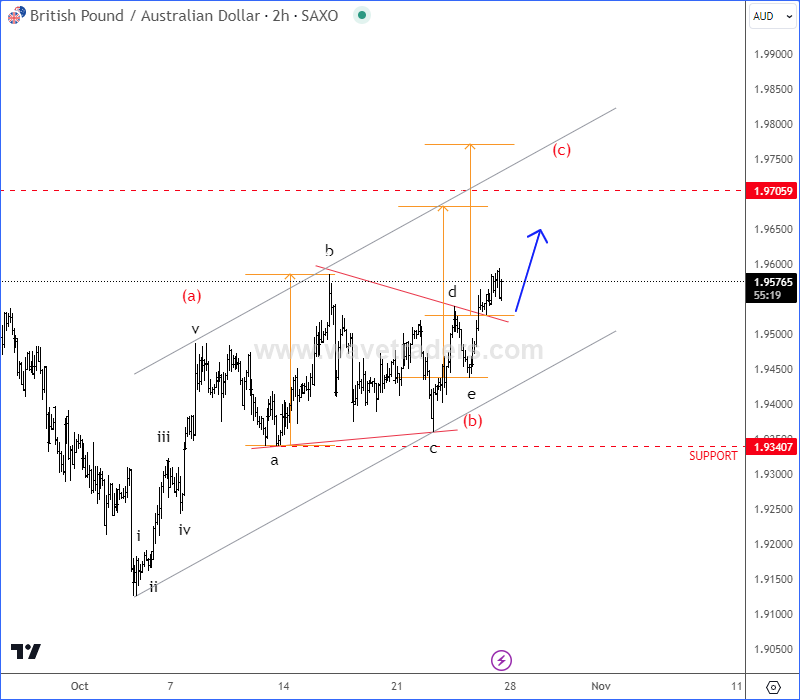
GBPAUD pair is now breaking out of a projected bullish abcde running triangle pattern. And, because of a break out of a triangle, it means it’s breaking ouf wave (b) into a wave (c) of a corrective recovery, but there can be still space up to around 1,97 area before it finds the resistance.
GBPAUD 2h Chart
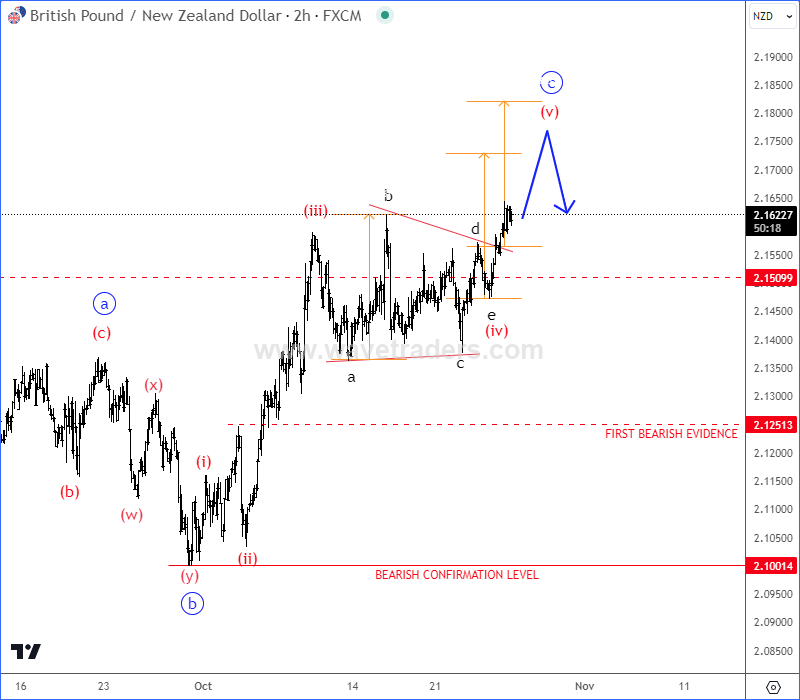
GBPNZD is breaking out of projected subwave (iv) running triangle into final subwave (v) of »c« of a correction, but before bears show up again, we still see room up to 2,17 – 2,18 resistance area.
GBPNZD 2h Chart
A triangle appears to reflect a balance of forces, causing a sideways movement that is usually associated with decreasing volume and volatility. The triangle pattern contains five overlapping waves that subdivide 3-3-3-3-3 and are labeled A-B-C-D-E. The running triangle is a region of horizontal price movement, a consolidation of a prior move, and it is composed of “threes.” That means each of the A-B-C-D-E waves have three subwaves. The triangle pattern is generally categorized as a continuation pattern, meaning that after the pattern completes, it’s assumed that the price will continue in the trend direction it was moving before the pattern appeared. However, triangles also indicate that the final leg is coming before a reversal and that’s why triangles are labeled in wave B, wave X or wave 4.
Yen Slips to 3-Month Low After Japanese Election
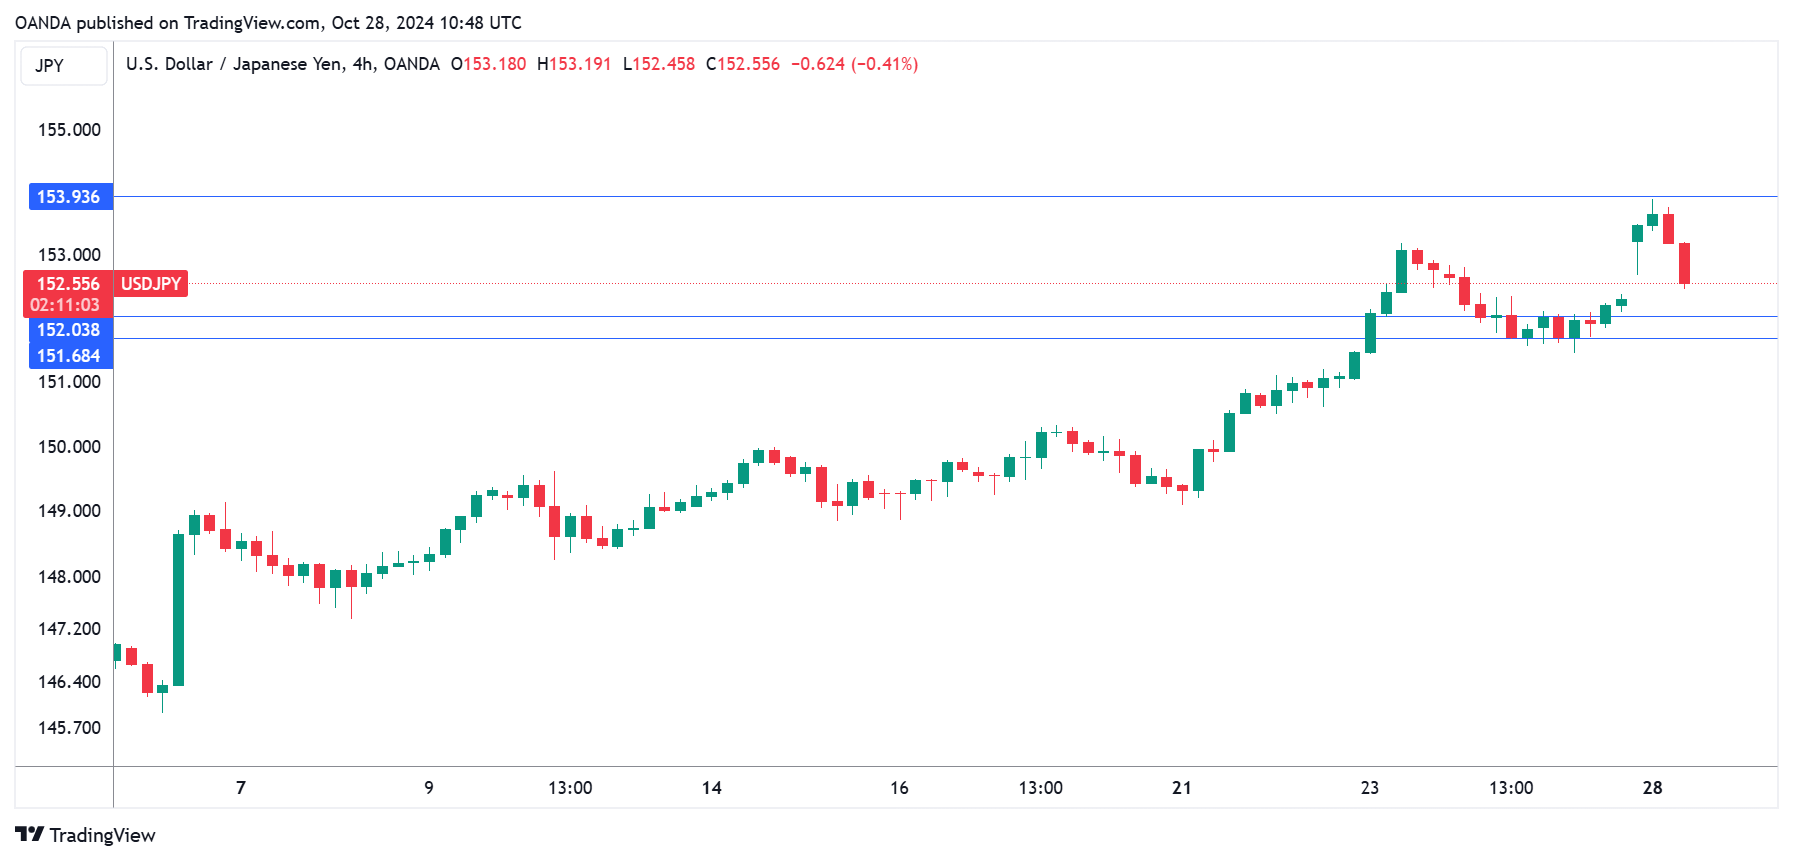
The Japanese yen is lower on Monday. In the European session, USD/JPY is trading at 152.63, up 0.22% at the time of writing. The yen weakened as far as 153.88 but has pared most of the losses.
Yen slumps after Ichida loses parliamentary majority
The new trading week has barely begun but the markets are busy digesting the drama out of Tokyo. The snap parliamentary election over the weekend was a disaster for new Prime Minister Shigeru Ishiba, as his Liberal Democratic Party (LPD) coalition won just 215 seats, short of the 233 majority.
Ishiba has been in power for only a month and the snap election backfired as the LDP lost its parliamentary majority for the first time since 2009. It’s unclear if Ishiba will be able to cobble together a majority and the political uncertainly could push the yen, which is trading at 3-month lows, even lower.
The election bombshell comes just ahead of the Bank of Japan’s on Oct. 31. The BoJ is expected to maintain policy settings and will release updated growth and inflation forecasts. The BoJ has intervened in the past when the yen showed a sharp and quick decline and there is speculation that the central bank might intervene if the yen falls to 155 or 160 per dollar.
The US wrapped up the week with mixed results. Durable Goods Orders declined 0.8% in September, unchanged from a revised -0.8% reading in August and above the market estimate of -1%. The UoM Consumer Sentiment index improved slightly to 70.5 in October, above 70.1 in September, beating the market estimate of 69.0.
USD/JPY Technical
- USD/JPY continues to push through resistance lines. The next resistance line is 153.94
- 152.03 and 151.68 are providing support
Nasdaq 100 Technical: Negative Feedback Loop from Rising US Treasury Yields May Overshadow Mega-Cap Earnings Results
- Five mega-cap technology stocks (Alphabet, Microsoft, Meta, Apple and Amazon) will report their respective earnings results this week.
- Bullish momentum of the recent 4-week rally seen in the 10-year US Treasury yield remains intact.
- A continuation of the surge in the 10-year US Treasury yield may challenge the positive vibes from the US mega-cap technology earnings results.
Pivotal week for the Nasdaq 100 as five mega-cap technology stocks; Alphabet, Microsoft, Meta, Apple and Amazon that have a combined weightage of around 31% will report their respective Q3 earnings results this week.
Ex-post earnings share performances of these five mega-cap technology firms after one to two days from their prior Q2 respective earnings results release dates had been lacklustre.
So far rosy expectations have been set for the Q3 earnings results of Alphabet, Meta, and Amazon that are poised for double-digit earnings growth supported by ad spending. Apple may get an uplift on sales of its latest iPhone 16 model from its key China market accordingly to a news report from Bloomberg.
Nasdaq 100 resilience may be tested by rising long-term 10-year US Treasury yield
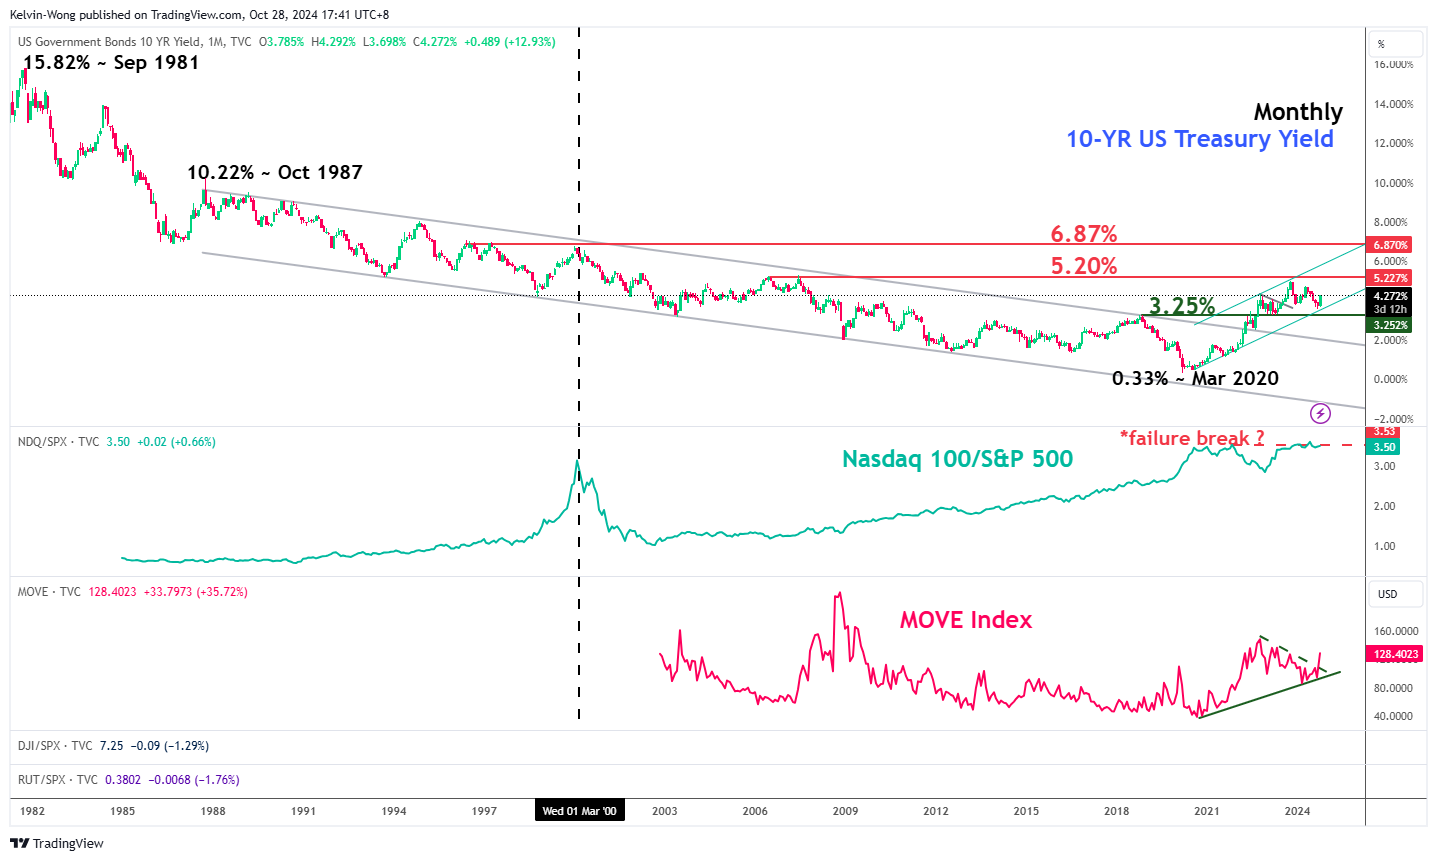
Fig 1: 10-year US Treasury yield long-term secular trend with Nasdaq 100/S&P 500 ratio & MOVE Index as of 25 Oct 2024 (Source: TradingView, click to enlarge chart)
The Nasdaq 100 has so far managed to notch a month-to-date return of 1.45% for October as of 25 October while the 10-year US Treasury yield has rallied by 50 basis points over the same period, its biggest monthly jump in almost two years.
This recent bout of significant push up in the 10-year US Treasury yield has been accompanied by rising interest rate implied volatility where the MOVE Index has jumped to a one-year high.
Based on past data, such swift increase in the 10-year US Treasury yield and MOVE Index have saw the Nasdaq 100 staged a medium-term corrective decline between July 2023 to October 2023 and November 2021 to October 2022 (see Fig 1).
The “Trump Trade” narrative has gained traction in the recent week due to rising odds of Republican nominee Trump winning the US presidential election based on data from betting markets (61%Trump versus 37% Harris based on Real Clear Politics data as of 27 October).
So far Trump’s proposed key policies of a lower corporate tax rate, and higher trade tariffs on China and rest of the world imports to the US is likely to see a resurgence of inflationary pressure from a medium-term to long-term horizon.
Hence, a rising 10-year US Treasury yield that is driven by inflationary rather than economic growth uplift is likely to be detrimental to the Nasdaq 100 from a valuation standpoint.
Nasdaq 100’s market breadth has remained lacklustre
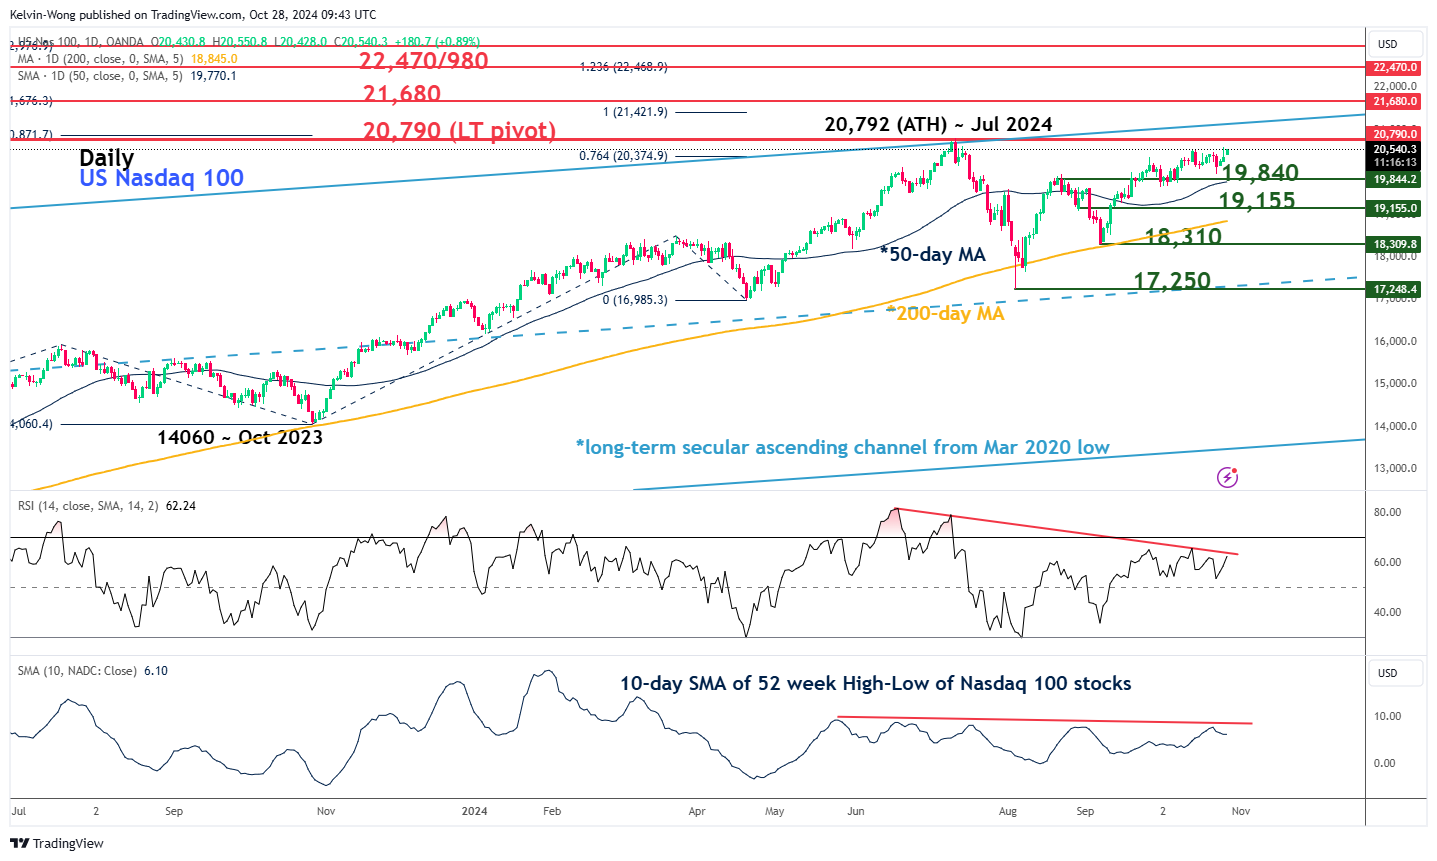
Fig 2: Nasdaq 100 CFD major & medium-term trends as of 28 Oct 2024 (Source: TradingView, click to enlarge chart)
The 10-day moving average of the Nasdaq 100’s 52-week high minus 52-week low market breadth indicator has continued to print a lower low and inched downwards.
This observation suggests that there are fewer Nasdaq 100 component stocks hitting new 52-week highs; a potential bearish reversal may be looming on the horizon for the Nasdaq 100 (see Fig 2).
Watch the 20,790 key long-term pivotal resistance on the Nasdaq 100 CFD Index (a proxy of Nasdaq 100 E-mini futures), a break below the 19,840 intermediate support (also the 50-day moving average) may expose the next medium-term supports of 19,155 and 18,310.
On the other hand, a clearance above 20,790 long-term pivotal resistance invalidates the bearish scenario to see the next medium-term resistances coming in at 21,680 and 22,470/980.
USD/JPY Chart Analysis: Rate Hits Autumn High
Today’s USD/JPY chart indicates that the U.S. dollar has strengthened against the yen by over 6.6% since the beginning of the month. Starting this trading week, the rate has surpassed 153 yen per dollar, a level not seen since August 31.
This bullish sentiment towards the dollar has been driven by the outcome of Japan’s parliamentary elections over the weekend. According to Reuters, investors believe that the loss of the ruling coalition’s majority in Japan’s parliament reduces the likelihood of a future interest rate hike, contributing to the yen's weakening.
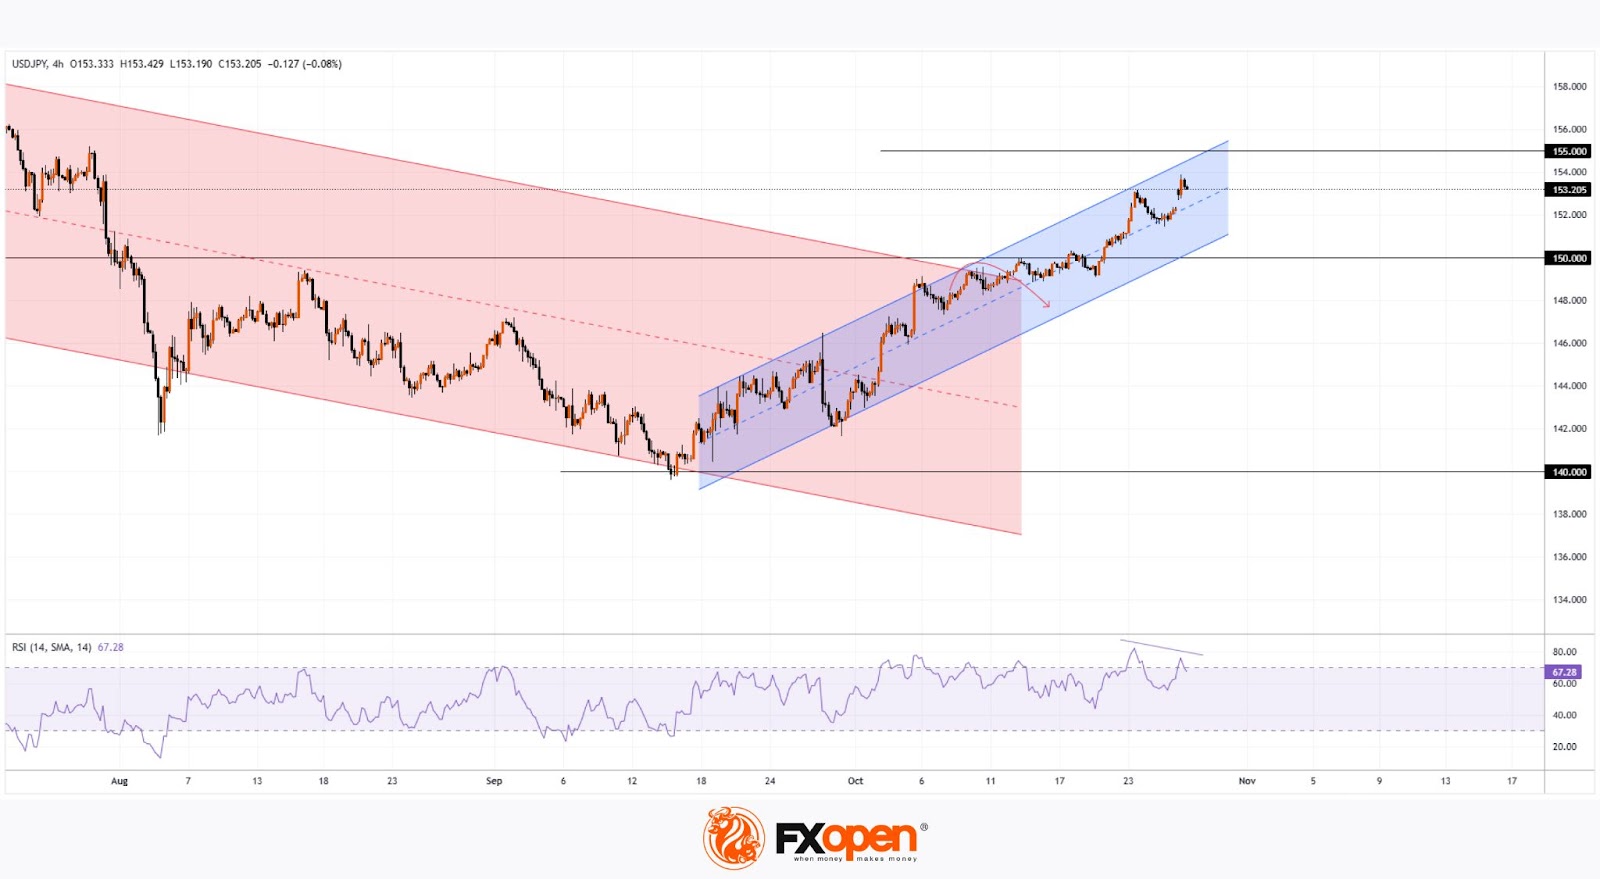
On October 10, there was speculation that bears might halt the October rally (marked by the blue channel) and guide the rate back down within a descending channel from its upper boundary (marked in red), with the psychological level of 150 yen per dollar acting as resistance.
However, bulls maintained their momentum (which originated from the psychological level of 140 yen) and continued the rally, breaking through this resistance. Per USD/JPY technical analysis, the 150 yen level may now serve as a support line.
The RSI indicator currently suggests the formation of a potential bearish divergence, hinting that a slight correction might occur as the market anticipates key upcoming news, which could heavily influence the sustainability of the current USD/JPY rally:
→ The Bank of Japan’s interest rate decision, expected on Thursday
→ Key U.S. labor market data releases scheduled for later in the week
Trade over 50 forex markets 24 hours a day with FXOpen. Take advantage of low commissions, deep liquidity, and spreads from 0.0 pips. Open your FXOpen account now or learn more about trading forex with FXOpen.
This article represents the opinion of the Companies operating under the FXOpen brand only. It is not to be construed as an offer, solicitation, or recommendation with respect to products and services provided by the Companies operating under the FXOpen brand, nor is it to be considered financial advice.