Sample Category Title
NZ CPI Review: The Inflation Dragon is Back in Its Cave
- Consumer prices rose by 0.6% in the September quarter. That saw annual inflation fall to 2.2%, the first time it’s been in the RBNZ’s target band since 2021.
- Inflation has been pulled down by a sharp fall in imported prices. Domestic inflation has been easing, but more gradually.
- While there were some large quarter-toquarter swings (in part related to policy changes), the broader trend in inflation is down. Inflation is set to track close to 2% over the coming year.
- We continue to expect a 50bp cut from the RBNZ at their 27 November meeting.
Inflation is back inside the RBNZ’s target band for the first time since 2021.
Consumer prices rose 0.6% in the September quarter. That saw the annual inflation rate fall to 2.2%, down from 3.3% in the year to June.
The result was a little below our forecast and was also lower than the RBNZ’s last published forecast.
What underpinned inflation in the September quarter?
Underpinning September’s rise in consumer prices was another big increase in local council rates (+12.2%) and a large increase in food prices (+1.3%, including a seasonal rise in vegetable prices). There was also an increase in healthcare costs related to the reintroduction of prescription fees, with the price of pharmaceutical products rising 17%.
On the housing front, rents were up 0.9% in the September quarter, leaving them up 4.5% over the past year. Housing construction costs were up only 0.1%, with competitive pressures one factor contributing to the low result.
Balanced against those increases, the September quarter saw a 6.5% fall in petrol prices. There has also been softness in the prices of a range of imported durable consumer goods. Notably, new and used motor vehicle prices were down 0.6% and 2.8% respectively. There has also been softness in apparel prices.
Inflation in the September quarter was also pulled down by the introduction of the FamilyBoost early childhood education rebate scheme which began on 1 July 2024.
- This policy allows eligible families to claim up to 25% of their weekly childcare fees (up to a maximum of $975 every three months).
- Early childhood education costs account for 0.6% of the CPI, and the 22.8% reduction in those costs shaved 0.3ppts off inflation in the September quarter.
- If not for that policy change, the quarterly inflation rate would have been 0.9%.
- This policy change will dampen the annual inflation figures over the next few quarters, before dropping out of the calculations in September next year.
Annual and core inflation: trending back to target.
Of more note than the quarter-to-quarter swings in prices is the continued downtrend in annual inflation, which has been steadily falling for around two years now.
The downtrend in headline inflation is mainly due to the low level of tradables prices (mainly imported retail goods).
- Tradable prices fell by 0.2% this quarter, leaving them down 1.6% over the past year. The drop in tradables inflation has been stark – this time last year annual tradables inflation was running at +4.7%.
- The fall in tradables prices has in part been due to falls in global prices as international supply conditions have improved over the past couple of years.
- The downward pressure on prices has been somewhat amplified by the pressures on household budgets and the related weakness in discretionary spending. That’s resulted in softness in the prices of a range of consumer goods.
Domestic (non-tradable) price pressures have also been easing, but more gradually.
- Non-tradable prices rose 1.3% in the September quarter, with the annual rate slowing to 4.9%. While that’s down from 5.4% last quarter, it’s still well above long-run averages.
- Notably, non-tradables inflation has been pulled down by the change to early childcare costs (If not for that change, annual non-tradables inflation would have been 5.2%). However, the impact of that policy change is balanced against the reintroduction of prescription fees, which had a similar sized impact.
- Under the surface, we are seeing some notable differences in domestic costs. Inflation in service sectors is easing back, consistent with the downturn in economic growth and softening in the labour market. But at the same time, we’re still seeing continued large increases in some non-discretionary expenses, like local council rates. That mix of conditions is likely to continue for some time, meaning that overall non-tradable inflation will remain at firm levels for a while yet.
Even with the ‘stickiness’ in domestic prices, overall inflation is trending down. That was reflected in the various measures of core inflation (which smooth through volatile quarter-to-quarter price movements, and instead track the underlying trend in prices). Most measures of core inflation have been dropping back and are now close to 3%, or in some cases a little below.
- Inflation excluding food, fuel and energy costs eased from 3.4% to 3.1% previously.
- 30% trimmed mean inflation fell from 3.8% to 2.7%
- Weighted median inflation fell from 3.5% to 2.8%
Implications.
Inflation is at long last back in the RBNZ’s target band, and it looks set to track close to 2% over the year ahead. Consistent with that more-contained inflation outlook, we expect that the RBNZ will deliver another jumbo-sized 50bp cut in November, with further but more gradual cuts next year.
But although the RBNZ will now be feeling more comfortable about how inflation is tracking, the underlying details of today’s inflation report highlight some key areas to watch that could be important for the stance of monetary policy.
First, domestic inflation is still elevated, and not just because of items like council rates. That ‘stickiness’ in domestic prices will be important for how far and fast inflation eases, especially with interest rates now moving down.
At the same time, we are seeing weakness in the prices of imported consumer goods and household spending is still weak. With tradable prices heavily influenced by offshore conditions, the RBNZ often tends to de-emphasise surprises on this front in their policy deliberations. However, continued softness on this front would raise the risk of inflation falling below 2% next year.
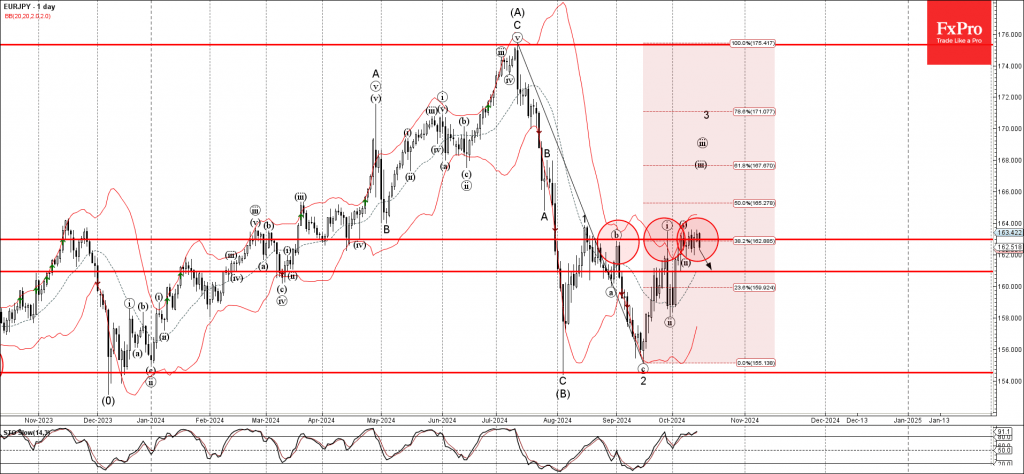
EURJPY Wave Analysis
- EURJPY reversed from the resistance zone
- Likely to fall to support level 160.90
EURJPY currency pair recently reversed down from the resistance zone located between the key resistance level 163.00 (which has been reversing the price from the end of September), the upper daily Bollinger Band and the 38.2% Fibonacci correction of the downward impulse from July.
The downward reversal from this resistance zone stopped the earlier short-term impulse waves iii, 3 – which belong to the impulse wave (C) from August.
Given the overbought daily Stochastic, EURJPY can be expected to fall further to the next support level 160.90 (former minor support from the start of October).
S&P 500, Nasdaq 100 – Wall Street Indexes Eye Further Gains as Earnings Filter Through
- Wall Street indexes showed positive momentum, driven by strong bank earnings reports.
- Tech sector earnings, expected later in October, could further boost US indices.
- S&P 500 technical analysis suggests potential bullish continuation with key resistance levels identified.
The major Wall Street Indexes took a breather this morning following a stellar rally yesterday. The Dow Jones Industrial Index touched the 43000 handle for the first time while the S&P and Nasdaq 100 both continued to advance as well. The Nasdaq 100 continues to lag its peers however and still remains around 300 points of its all time highs of 20790.
Earnings season got underway last week with major banks JpMorgan Chase JPM.N and Wells Fargo WFC.N both posting surprisingly positive results. This week however steps things up a bit with 41 S&P 500 companies scheduled to report earnings, which could stoke a lot of volatility in US indices.
Earnings from Bank of America today were not as upbeat as some of its peers but the share price has recovered from an initial drop to trade in green for the day. Goldman Sachs and CitiGroup however smashed estimates with their earnings releases which could be the reason for the recovery in US indexes this morning. Johnson and Johnson were another name that beat estimates on both profits and sales forecasts as well as the expectations by Wall Street.
On the flip side, Oil stocks were lower today as Crude Oil prices plummeted on hopes that supply disruptions in the Middle East would not materialize. Exxon Mobil XOM.N, Occidental Petroleum OXY.N, and Chevron all falling between 2.5% and 3% on the day.
It has been an interesting start to earnings with the banks surprising thus far. Given that markets are expecting the Technology and Communication sectors to boom and post their largest YoY growth, this could set up US indices for further gains. The tech heavyweights are scheduled to report toward the backend of October and thus could propel US indexes higher just before the US election.
This is intriguing to say the least given that markets do usually experience a ‘Santa Rally’ in December meaning that US Indices could continue their upward trend heading into 2025.
NAS 100 Early Session Heatmap
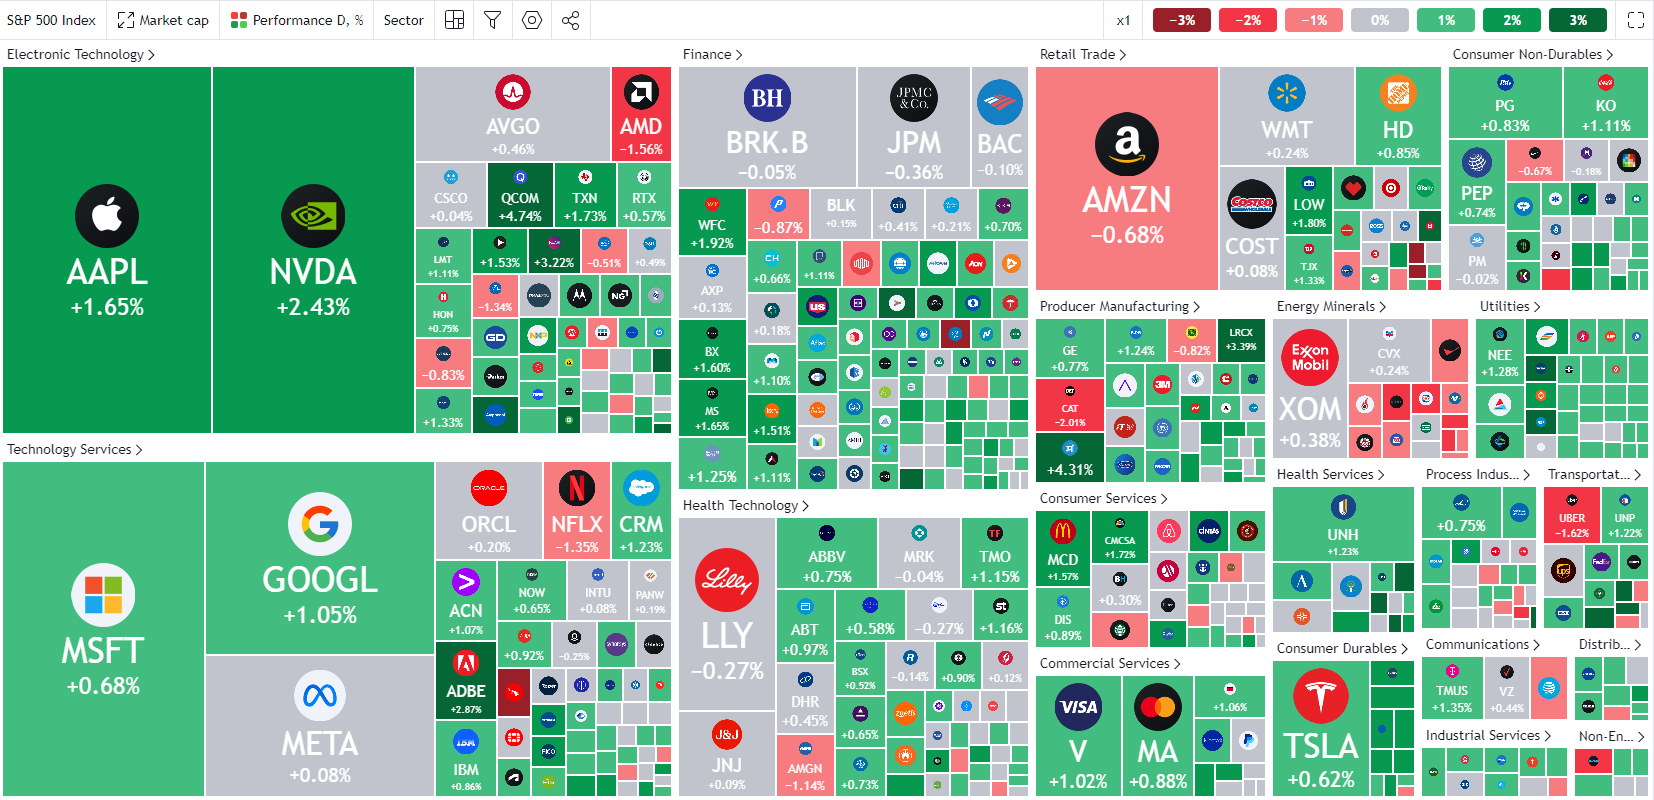
Source: TradingView.com (click to enlarge)
Looking ahead to the rest of today’s session, US data is sparse. All earnings releases are also out of the way with nothing scheduled after market close which shifts the focus to comments from Federal Reserve policymakers.
On the docket we have comments from Fed policymaker Mary Daly and Adriana Kugler which may provide further insights into policy making heading into the November meeting and beyond. Barring any surprise comments I do not expect any material change to market expectations around the upcoming Fed meetings.
Technical Analysis
S&P 500
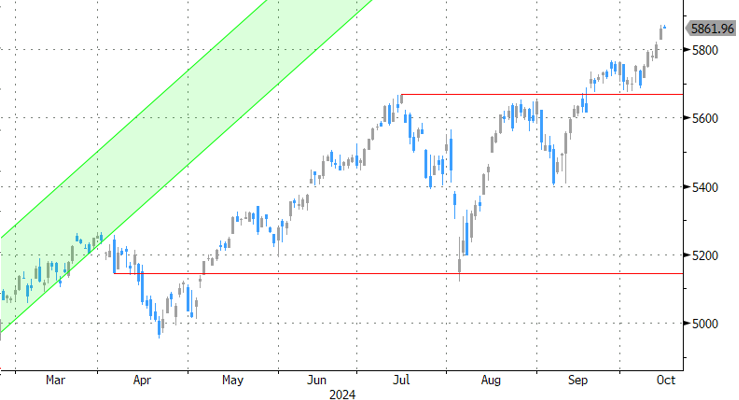
From a technical standpoint, the S&P is continuing its long term move to the upside. For those who have followed my previous articles, the S&P 500 broke out of a triangle pattern a few weeks back. As technical patterns go, the potential targets following the breakout rest around the 5910 handle 6169 handle with the index reaching a fresh high of 5872 yesterday.
However, given the amount of movement we have already had the opportunity for would be bulls to get involved may be gone by now. There is a possibility of getting one or two small scalps in before the index reaches its first potential target at 5910.
A break above the 5910 handle will lead to a run toward the psychological 6000 handle which could prove a stubborn stumbling block. This could mean that a retracement may take place before the index makes a run for the 6169 handle.
S&P 500 Daily Chart, October 15, 2024
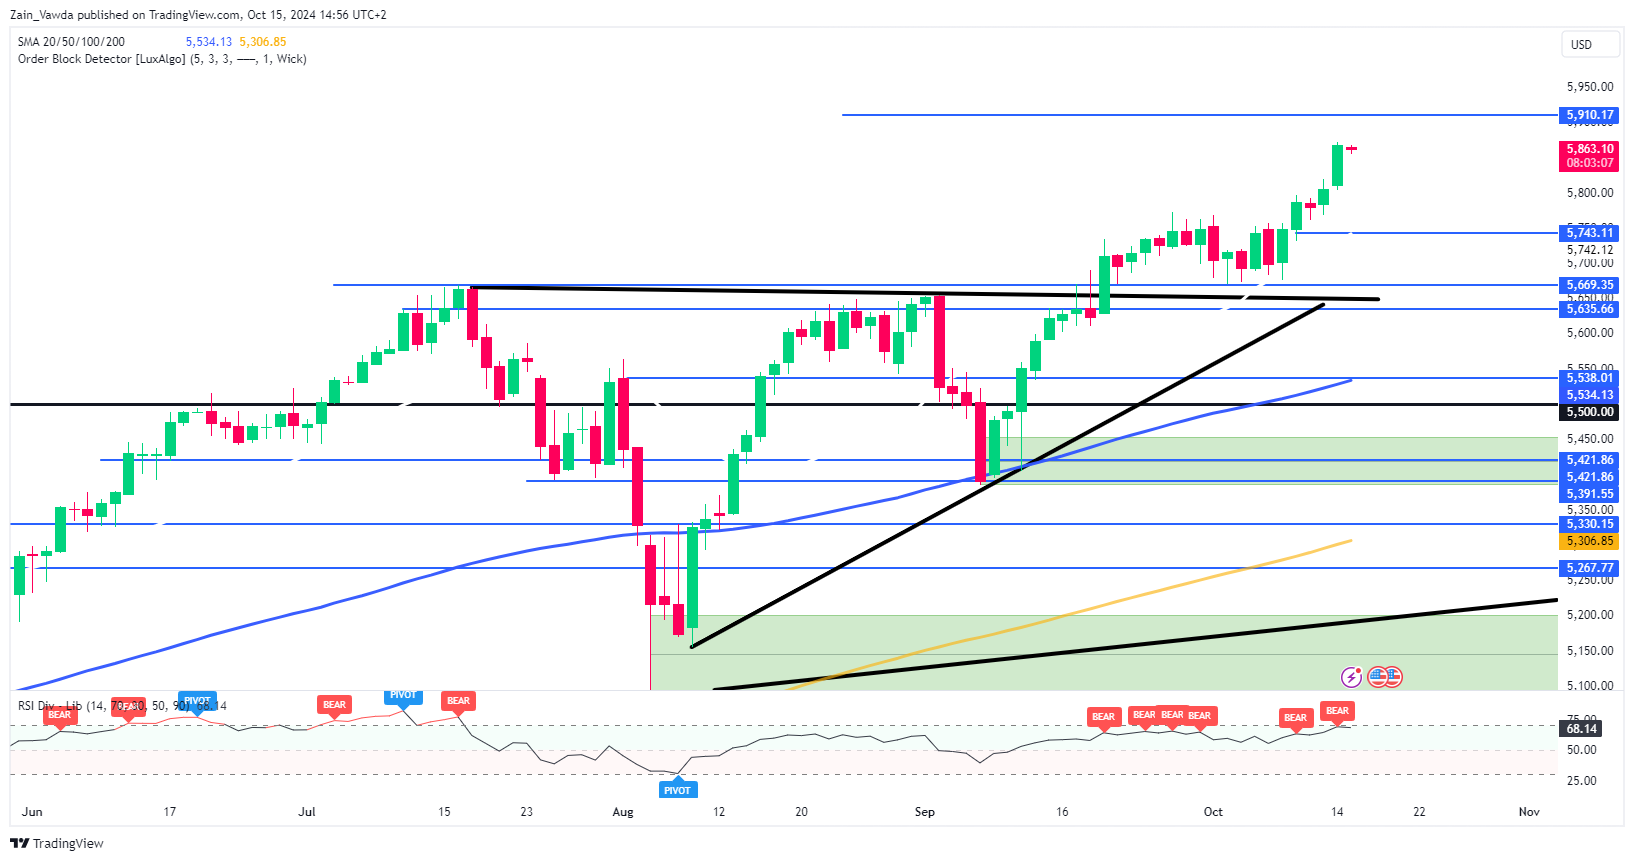
Source: TradingView (click to enlarge)
Support
- 5757
- 5669
- 5613
Resistance
- 5913
- 6000
- 6169
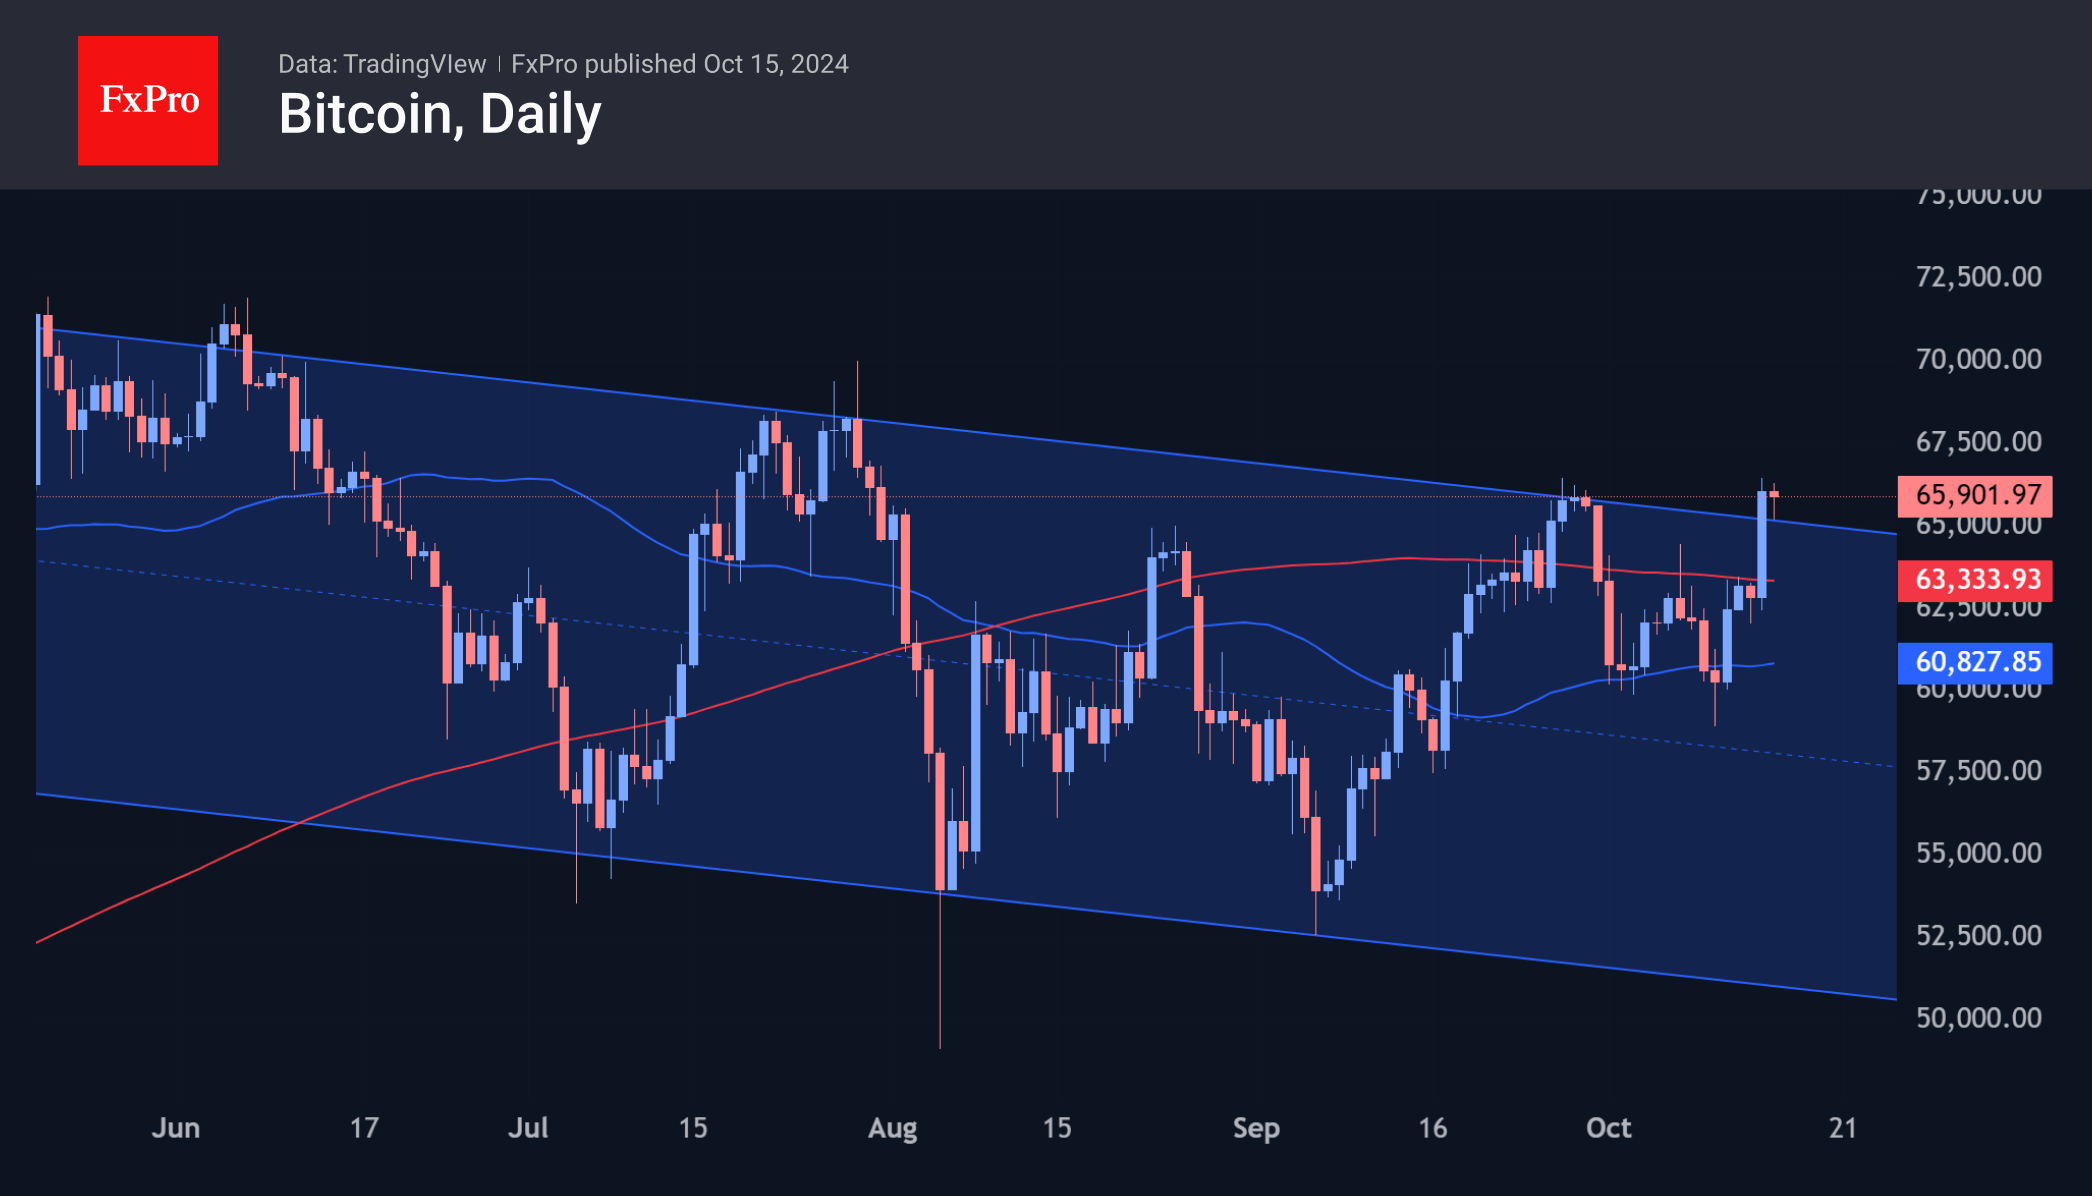
Soaring Bitcoin
Market Picture
The cryptocurrency market rose 1% in 24 hours to $2.28 trillion. The market cooled off somewhat during the day, moving away from local highs above $2.30 trillion, which were the highest in more than two weeks. Sentiment jumped sharply to ‘greed’, reaching the 65 level, the highest since late July.
The price of Bitcoin traded above $66.5K for a while on Tuesday, matching the high of 30 July. This is a very nominal break above the previous high and an attempt to consolidate above the resistance of the descending channel. An important driver is the continued optimism in the US equity markets. Barring any sudden bouts of profit-taking, Bitcoin could consolidate the breakout from the multi-month downtrend. The potential first target of the new bull rally looks to be the area of historical highs as it approaches $74K, with a more distant target of $80K by the end of the year.
News Background
According to CoinShares, global crypto fund investments increased by $407 million last week, following outflows of $147 million the week before. Bitcoin investments increased by $419 million, Solana investments increased by $0.6 million, and Ethereum investments decreased by $10 million.
According to experts, BTC’s growth is being fuelled by expectations of new stimulus measures in China. Over the weekend, Chinese Finance Minister Lan Fo’an said that the country will soon introduce a package of additional fiscal measures to support economic development.
Searches for Bitcoin on Google fell to an annual low. Searches for altcoins show a similar dynamic. At the same time, user interest in meme coins remains relatively stable. The segment is recovering despite the massive failure of new coins and the disappointment of some traders.
The UAE Central Bank has approved the launch of a dirham-based stablecoin, the AED stablecoin. This coin is leading the race to become the first issuer of a regulated stablecoin.
Sunset Market Commentary
Markets
The release of labour market data kicked off a triptych of key UK data that should help clarify whether the time is right for the BoE to move to a ‘more activist approach’ when it comes to reducing policy restriction. The employment report didn’t change (money) markets’ positioning in any profound way (> 90% chance of a 25 bps cut in November and slightly less than 50% chance on an additional step in December). The unemployment rate declined to 4% from 4.1%. Employment growth in the 3M to August accelerated to 373k (from 265k), but a preliminary figure for September (payrolled employees) shows signs of a slowdown (-15k). Average weekly earnings (ex-bonus) as expected eased to 4.9% from 5.1%, but this is probably still too high to sustainably return inflation back to 2%. Tomorrow’s price data and/or Friday’s retail sales could still provide a more straightforward narrative. UK bond yields basically follow the broader decline in US Treasuries and Bunds. Sterling again outperforms (cable 1.3085; EUR/GBP 0.8335, nearing the October 01 correction low of 0.831).
US interest rate markets reopened after the Columbus Day holiday. Yesterday’s sharp drop in oil prices limited any tentative further upside pressure in inflation expectations and in US (and other core) yields. A weak NY Fed Empire Manufacturing survey (-11.9 from +11.5 vs 3 expected) pointed in the same direction. For now, the ‘hawkish’ repricing after stronger than expected early month US data has run its course. US yields decline between 3 bps (2-y) and 6.5 bps (30-y). German Bund yields are easing 4 to 5 bps across the curve. The expectations index of ZEW German investor sentiment improved slightly more than expected from 3.6 to 13.1, but understandably had hardly any impact on market pricing. After yesterday’s record levels for the Dow and the S&P 500, US equities show no clear trend even as US banks’ earnings published today mostly beat market expectations. After yesterday’s setback, Brent holds below $75/b. Lower core yields also prevent the dollar from building on its recent uptrend. DXY eases slightly (103.05) as nearby resistance (103.34, 50% retracement on April-September decline) is in play. The comparable level in EUR/USD (1.0907) looked like being broken this morning, but EUR/USD intraday also got some reprieve from lower US yields (1.0915 currently). Still the picture remains fragile.
News & Views
Canadian inflation just missed the bar in September. Headline prices dropped 0.4% m/m (-0.3% expected), bringing Y/Y reading down from 2% to 1.6%. That’s below the 1.8% estimate and the lowest since February 2021, after which the post-pandemic inflation surge began to materialize. Core readings (ex gasoline, median, trimmed) matched the August readings of 2.2-2.4%, compared with expectations for a slight acceleration in one of the three key metrics. Statistics Canada attributed the sharp drop of the headline Y/Y figure to energy (gasoline, -7.1% m/m following a 2.6% decline in August). Shelter price rises decelerated from 0.4% to 0.1% m/m. Clothing & footwear (+0.9% m/m) and health & personal care (+0.5%) printed some of the largest monthly gains. In sectoral terms, goods prices dropped for a second month straight by 0.6%, joined by a second consecutive easing in services prices (-0.2%). The CPI news comes after last week’s solid labour market report. In the end, it didn’t change much to market expectations (+/- 50%) of the Bank of Canada moving ahead in bigger steps, something governor Macklem didn’t rule out in September. Conviction grows today to more than 75% of a 50 bps move on October 23. The Canadian Loonie is headed for a tenth day of losses. USD/CAD pushes beyond 1.38(3).
The Polish government today launched a dual EUR-denominated bond sale. Its return to the FX bond market after several months of silence comes after the draft 2025 budget showed a jump in bond sales (net borrowing needs rise from PLN 215.7bn to PLN 366.9bn) in that presidential pre-election year. By tapping the international bond market, the Ministry of Finance seeks to further diversify funding. Poland successfully raised €1.75bn at MS+85 bps for its 7-yr (Oct 22, 2031) bond and €1.25bn for the 15-yr one (Oct 22, 2039) at MS+140. Books ran above €8.9bn for the former and €6.5bn for the latter. The sale follows the biggest EUR-denominated one (dual-tranche) ever in early January, tapping a combined €3.75bn. It raised $8bn from a sale in US dollars back in March.
Graphs
USD/CAD: Loonie stays in the defensive as markets see growing chance of 50 bps BoC rate cut
EUR/GBP nears YTD low as UK data provide ‘final input’ for November 07 BoE meeting.
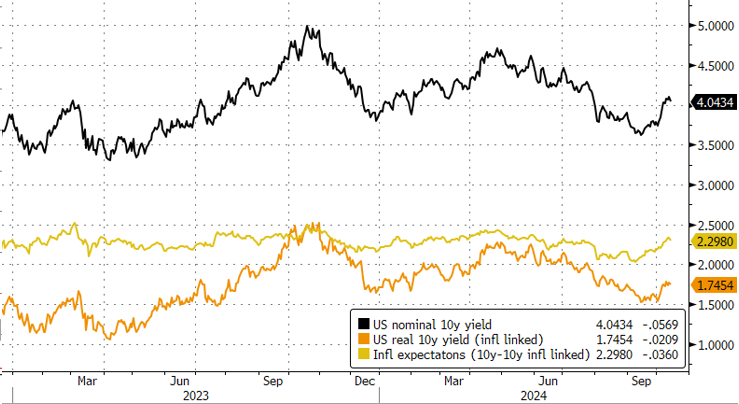
US 10-y yields: decline in oil prices caps rebound in inflation expectations (yellow).
S&P 500 continues record race on combinaition of solid US growth and hoped for easing of financial conditions.
USD/JPY Faces Resistance Amid Geopolitical and Economic Uncertainties
USD/JPY has been struggling to break past the resistance level at 149.55 despite repeated attempts over the past five trading sessions. The Japanese yen remains under pressure as the Federal Reserve signals a more moderate approach to interest rate cuts in its upcoming meetings, contrasting with the broader expectations of more aggressive rate reductions.
Further complicating the currency dynamics, recent fiscal stimulus announcements from China have yet to manage to bolster market confidence. Over the weekend, China's Finance Minister Lan Fo'an detailed plans for additional capital injections into state-owned banks and measures to support the property market. However, the lack of specific details regarding the spending amount and the precise nature of these measures left investors feeling uncertain about the effectiveness and scale of the proposed stimulus.
In Japan, dovish comments from Bank of Japan Governor Kazuo Ueda and opposition from new Prime Minister Shigeru Ishiba against further rate hikes have added to the pressure on the yen. Earlier this month, Ishiba expressed concerns that the current economic conditions do not warrant additional rate increases. However, other senior officials later softened this stance, indicating some internal conflict or reassessment within the Japanese government regarding monetary policy.
Technical analysis of USD/JPY
The USD/JPY pair is currently within a broad consolidation range around 149.22. The range has expanded to 149.96, and the market is now forming a downward movement towards 149.22, testing this level from above. If the market rebounds from here, we might see an ascent towards 150.22. A break above this level could signal a continuation towards 153.22. Conversely, a drop below 148.88 could lead to a further correction down to 147.47. The MACD indicator supports this view, with the signal line high above zero but starting to descend towards it, suggesting a potential shift in momentum.
On the hourly chart, USD/JPY has completed a growth wave to 149.96 and is undergoing a correction to 149.22. Following this corrective phase, the market is expected to resume its upward trajectory towards 150.22. This movement aligns with the Stochastic oscillator's current trajectory, which shows the signal line moving upwards from 50 towards 80, indicating potential for further gains in the short term.
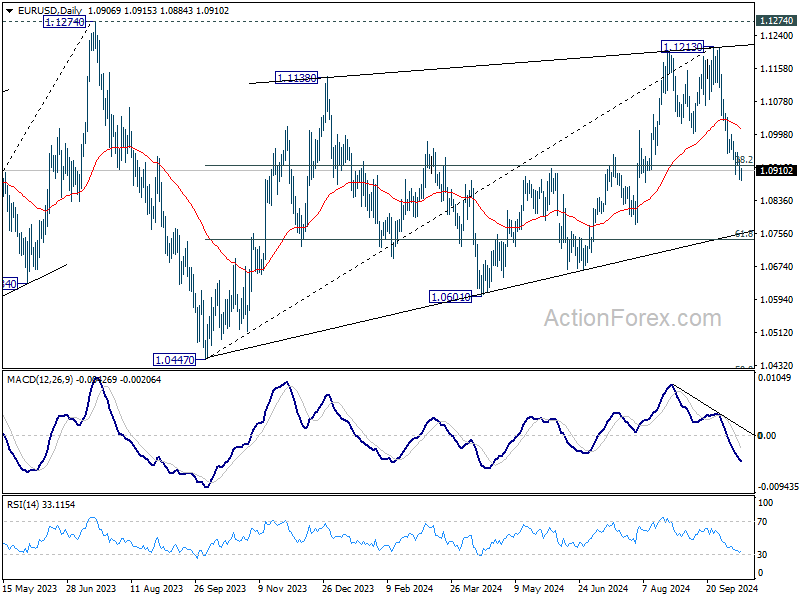
EUR/USD Mid-Day Outlook
Daily Pivots: (S1) 1.0886; (P) 1.0911; (R1) 1.0935; More....
Intraday bias in EUR/USD remains on the downside for the moment. Sustained trading below 38.2% retracement of 1.0447 to 1.1213 at 1.0920 will argue that fall from 1.1213 is the third leg of the corrective pattern from 1.1274. In this case, deeper decline would be seen to 61.8% retracement at 1.0740 next. On the upside, above 1.0953 minor resistance will turn intraday bias neutral again first.
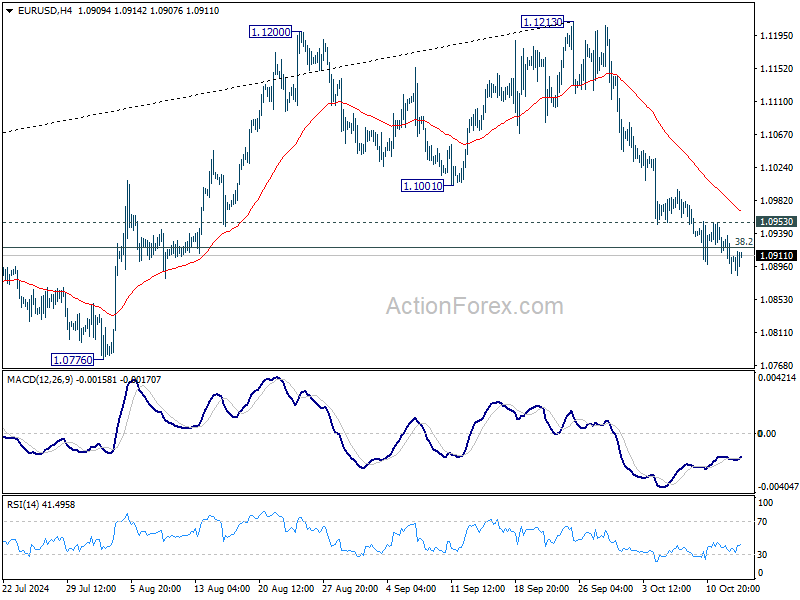
In the bigger picture, rejection by 1.1274 resistance suggests that corrective pattern from 1.1274 (2023 high) is not completed yet. Instead, decline from 1.1213 might be another falling leg. Sustained break of 55 W EMA (now at 1.0877) will validate this case, and bring deeper fall towards 1.0447 support again.
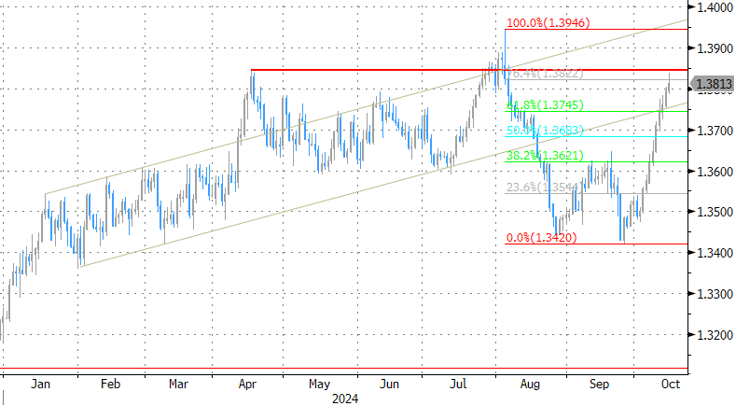
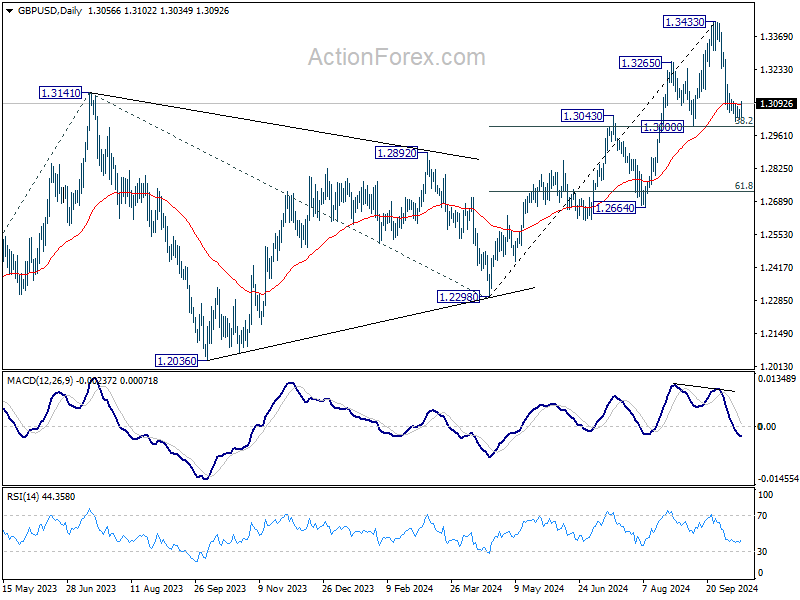
GBP/USD Mid-Day Outlook
Daily Pivots: (S1) 1.3035; (P) 1.3054; (R1) 1.3077; More...
Intraday bias in GBP/USD remains neutral and outlook is unchanged. Strong support should be seen from 1.3000 cluster support (38.2% retracement of 1.2298 to 1.3433 at 1.2999) to complete the correction from 1.3433. On the upside, break of 1.3174 minor resistance will turn bias back to the upside for retesting 1.3433. However, sustained break of 1.3000 will carry larger bearish implications and target 61.8% retracement at 1.2732.
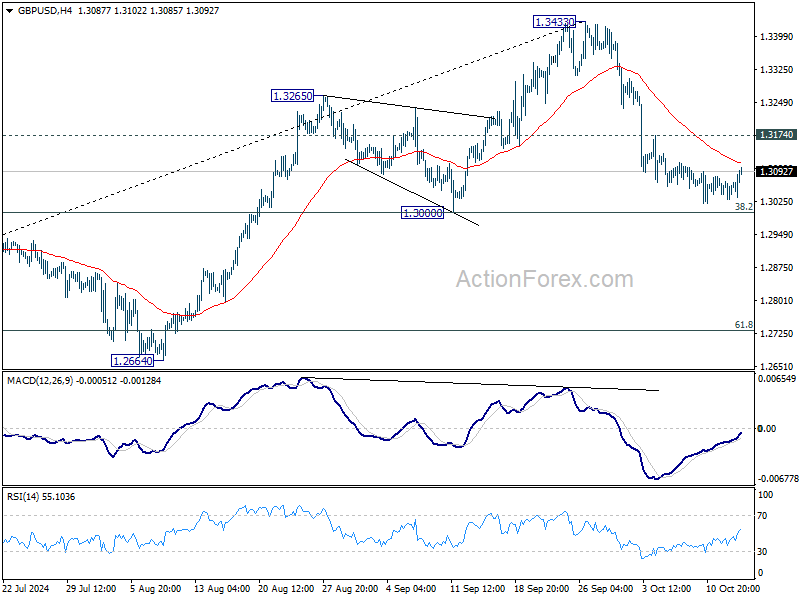
In the bigger picture, as long as 1.3000 support holds, the up trend from 1.0351 (2022 low) is still in progress. Next target is 61.8% projection of 1.0351 to 1.3141 from 1.2298 at 1.4022. However, considering mild bearish divergence condition in D MACD, decisive break of 1.3000 will argue that a medium term top is already in place, and bring deeper fall back to 1.2664 support next.
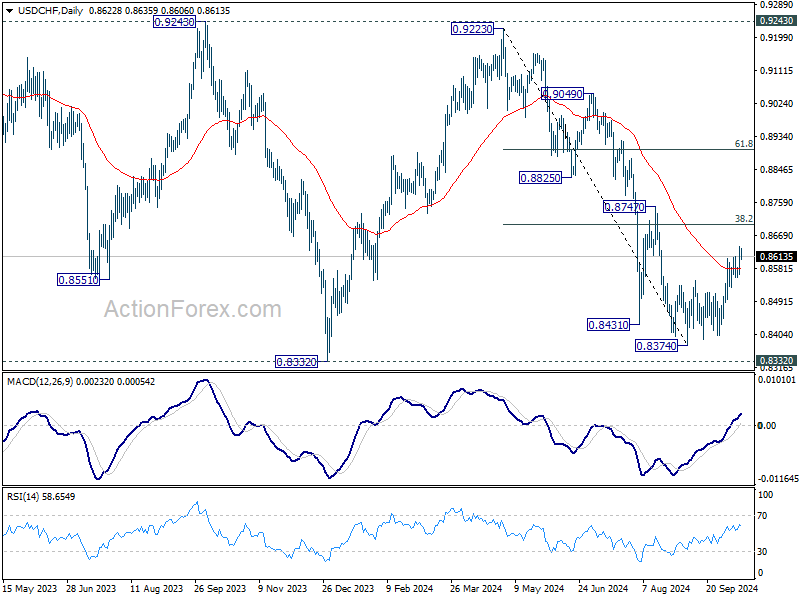
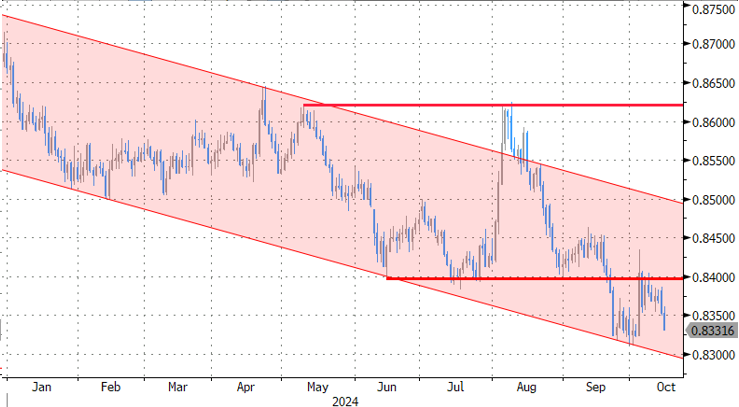
USD/CHF Mid-Day Outlook
Daily Pivots: (S1) 0.8583; (P) 0.8612; (R1) 0.8655; More…
USD/CHF's rise from 0.8374 is still in progress. Intraday bias stays on the upside for 38.2% retracement of 0.9223 to 0.8374 at 0.8698. Sustained break there will argue that fall from 0.9223 has completed after defending 0.8332 low. Further rally should be seen to 61.8% retracement at 0.8899 next. On the downside, below 0.8557 minor support will turn intraday bias neutral again first.
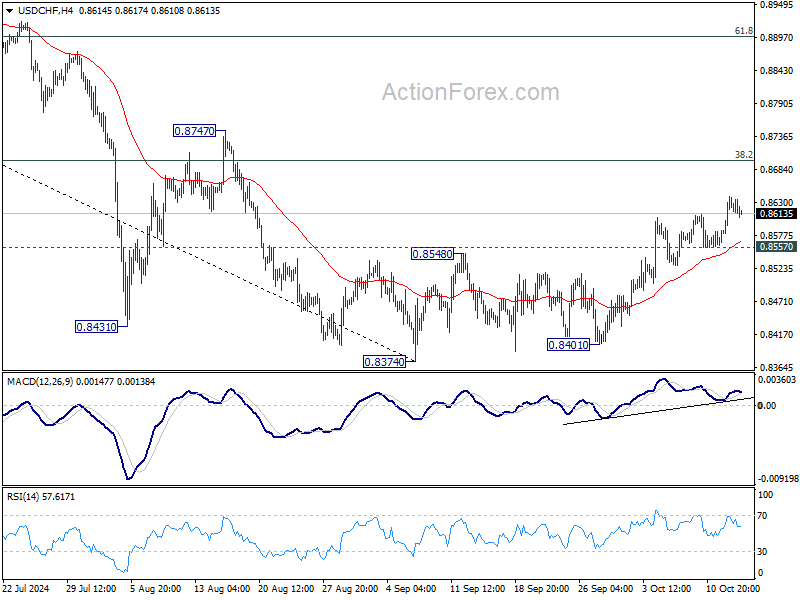
In the bigger picture, price actions from 0.8332 (2023 low) are currently seen as a medium term corrective pattern, with fall from 0.9223 as the second leg. Strong support could be seen from 0.8332 to bring rebound. Yet, overall outlook will continue to stay bearish as long as 0.9243 resistance holds. Firm break of 0.8332, however, will resume larger down trend from 1.0146 (2022 high).