
Sample Category Title
USD/CHF Mid-Day Outlook
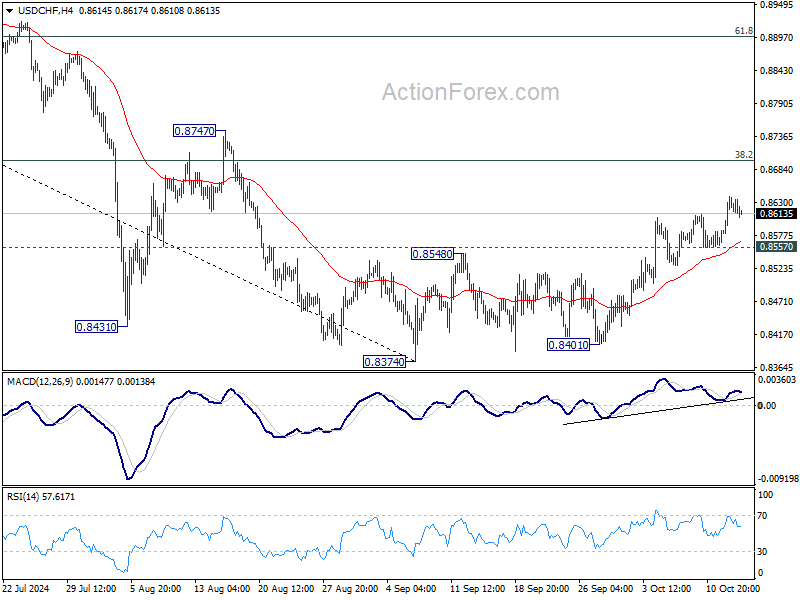
Daily Pivots: (S1) 0.8583; (P) 0.8612; (R1) 0.8655; More…
USD/CHF's rise from 0.8374 is still in progress. Intraday bias stays on the upside for 38.2% retracement of 0.9223 to 0.8374 at 0.8698. Sustained break there will argue that fall from 0.9223 has completed after defending 0.8332 low. Further rally should be seen to 61.8% retracement at 0.8899 next. On the downside, below 0.8557 minor support will turn intraday bias neutral again first.
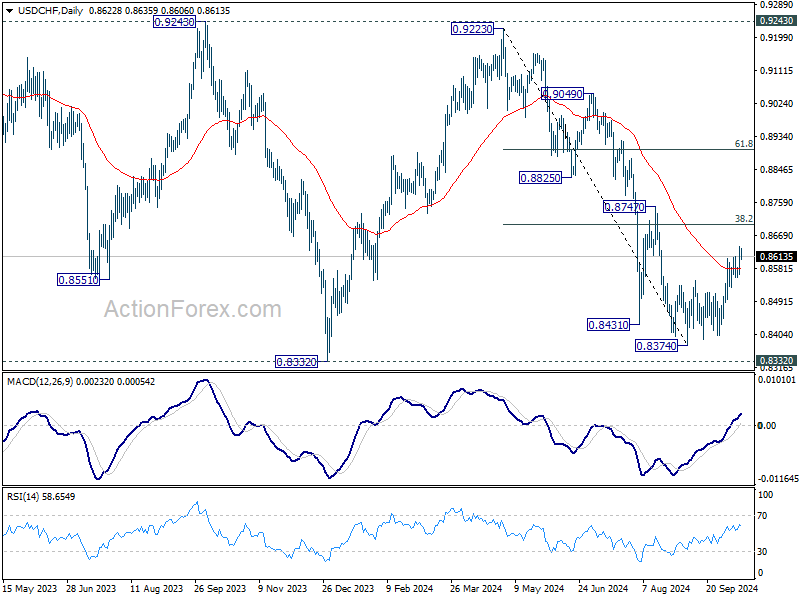
In the bigger picture, price actions from 0.8332 (2023 low) are currently seen as a medium term corrective pattern, with fall from 0.9223 as the second leg. Strong support could be seen from 0.8332 to bring rebound. Yet, overall outlook will continue to stay bearish as long as 0.9243 resistance holds. Firm break of 0.8332, however, will resume larger down trend from 1.0146 (2022 high).
USD/JPY Mid-Day Outlook
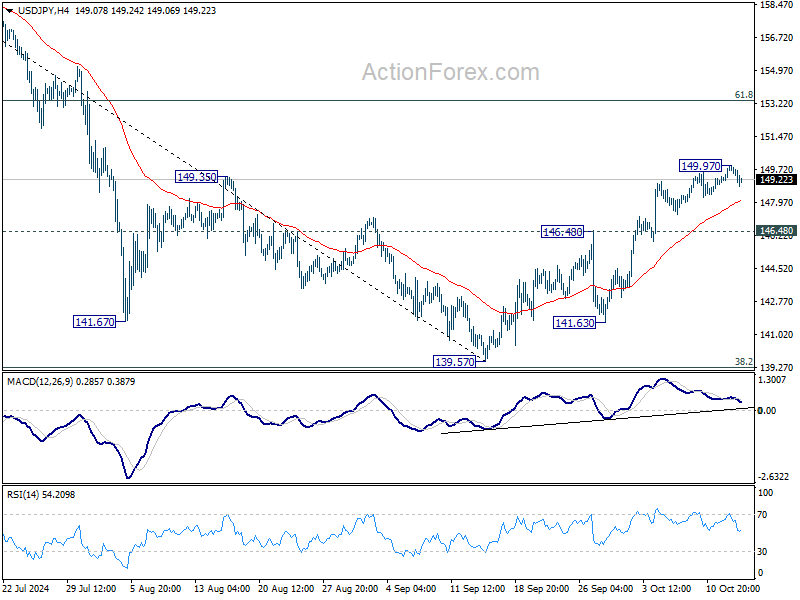
Daily Pivots: (S1) 149.20; (P) 149.59; (R1) 150.15; More...
Intraday bias in USD/JPY is turned neutral again with current retreat. Another rise is expected for now, and break of 149.97 will resume the rise from 139.57 to 61.8% retracement of 161.94 to 139.57 at 153.39 next. However, firm break of 146.48 will argue that such rebound has completed, and turn bias back to the downside for retesting 139.57 low.
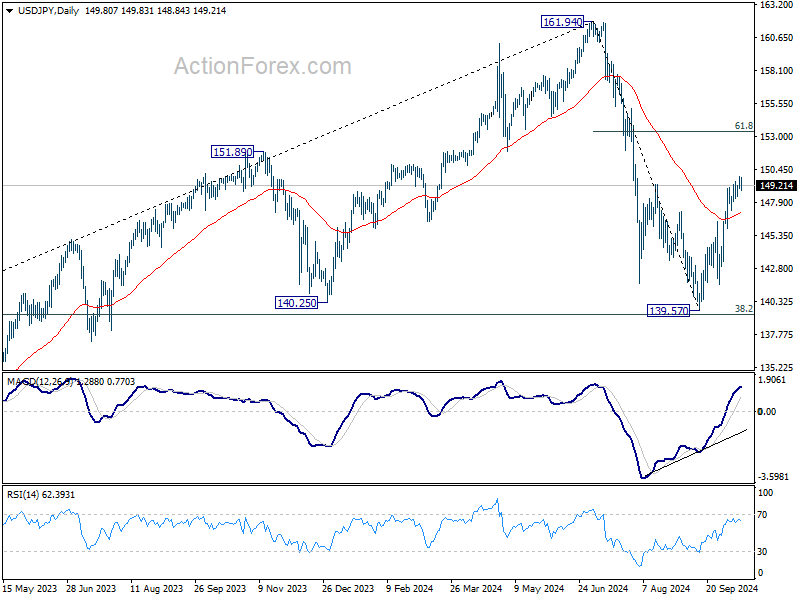
In the bigger picture, price actions from 161.94 are seen as a corrective pattern to rise from 102.58 (2021 low). The range of medium term consolidation should now be set between 38.2% retracement of 102.58 to 161.94 at 139.26 and 161.94. Nevertheless, sustained break of 139.26 would open up deeper medium term decline to 61.8% retracement at 125.25.
Canadian Inflation Falls Further Below BoC’s Target
Headline CPI inflation eased in September to 1.6% year-on-year (y/y), below expectations for a 1.8% y/y print and less than the 2.0% y/y reading from August.
The deceleration was led by gasoline, which was down 10.7% y/y and 7.1% in September alone. Fears over weakening global economic growth have pulled down oil prices, which has fed through to cheaper prices at the pump.
Encouragingly, inflation in services has started to ease (4.0% y/y from 4.3% y/y in August). Shelter costs have been a big driver of services inflation, but with lower interest rates, mortgage interest cost inflation has decelerated (16.7% y/y from 18.8% y/y in August), while rent prices too are easing (8.2% y/y from 8.9% y/y in August). Another swing factor over the last few months has been the cost of air travel. With the end of the summer travel season, this category is starting to drop (-4.4% y/y).
The Bank of Canada's preferred "core" inflation measures held firm at 2.4% y/y in September. On a three-month annualized basis, the average moved from 2.3% in August to 2.1% in September, essentially at the BoC's target. This points to further easing in the core metrics in the months ahead.
Key Implications
With headline inflation now decisively below the Bank of Canada's (BoC's) target and core inflation looking likely to follow, inflation risks have eroded over the last few months. Below the surface, this trend looks to continue with housing costs finally starting to subside, with inflation excluding shelter running at a paltry 0.4% y/y. All in, the inflation outlook is looking a bit softer than we expected in our recently published forecast.
The BoC is scheduled to meet next week and debate over whether the central bank will go big with a 50 basis point cut is rising. Thus far, the bank has been predictable, with a steady streak of 25 bp cuts over the last three meetings. Given the persistent strength of the jobs market, the BoC would be validated in maintaining its steady rate cutting pace. On the other side, market participants are increasingly betting on a 50 bp cut, assuming that the BoC will focus on the downside risks now that headline inflation has moved closer to the bottom end of its target range. Either way, it will be a close call for the BoC next week.
USD/CAD Mid-Day Outlook
Daily Pivots: (S1) 1.3768; (P) 1.3786; (R1) 1.3816; More...
Intraday bias in USD/CAD remains on the upside as rise from 1.3418 is in progress. Next target is a test on 1.3946/76 key resistance zone. On the downside, 1.3769 minor support will turn intraday bias neutral first. But further rally will be expected as long as 1.3646 resistance turned support holds, in case of retreat.
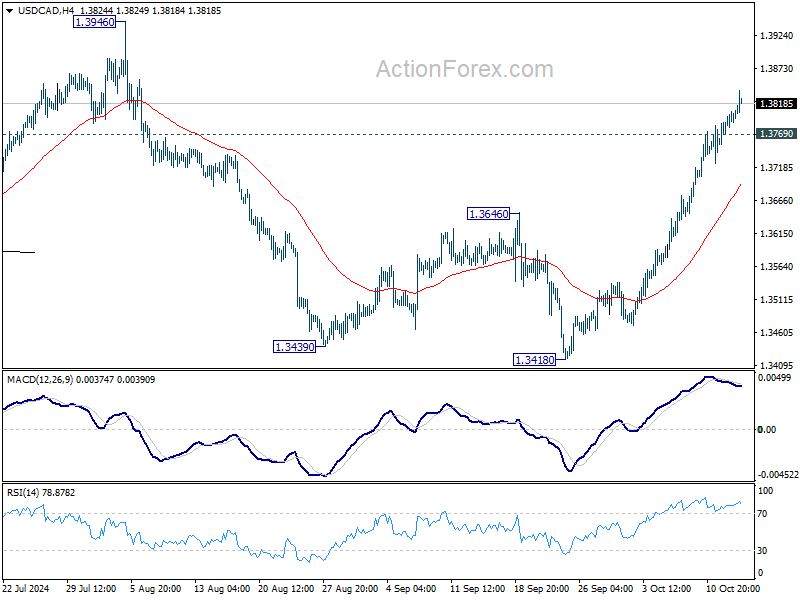
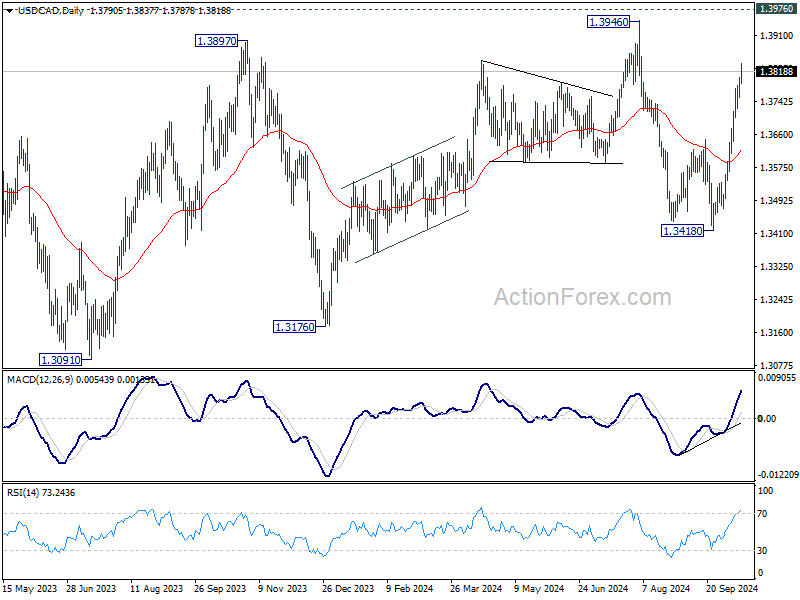
In the bigger picture, sideway consolidation pattern from 1.3976 (2022 high) might still extend further. While another decline cannot be ruled out, strong support should emerge above 1.2947 resistance turned support to bring rebound. Rise from 1.2005 (2021 low) is still in favor to resume at a later stage.
Canadian Dollar Slumps as Inflation Miss Heightens BoC 50bps Cut Expectations
Canadian Dollar weakens broadly decline in early US session following weaker-than-expected inflation data. The drop in headline CPI, driven primarily by falling gasoline prices, was steeper than anticipated. However, core inflation measures, especially the closely-watched CPI common, remained near 2% level. This further solidifies expectations that BoC would accelerate its policy easing, with a 50bps rate cut likely at the October 23 meeting.
In contrast, British Pound found some support from a mixed set of labor market data. UK unemployment rate unexpectedly fell to 4%, while wage growth slowed to its lowest point in over two years. This data leaves the decision for a BoE rate cut in November finely balanced. However, the market's focus is now shifting to tomorrow's UK CPI release, which is expected to carry more weight in shaping BoE's course of action.
For the day, Yen has surprising emerged as the strongest performer. Many traders are still hesitant to push USD/JPY above 150 psychological level. Sterling follows, while the Swiss Franc also shows strength. Canadian Dollar is the weakest performer so far, followed by Australian and New Zealand Dollars. The continued uncertainty over China's fiscal policy, despite another upcoming press conference from key ministries, is keeping sentiment subdued for Chinese and Hong Kong stocks, weighing further on the Aussie and Kiwi.
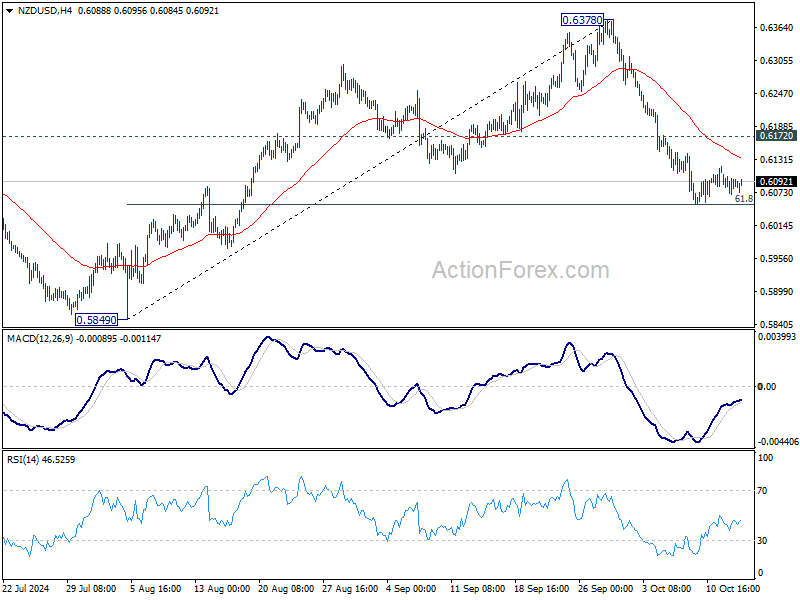
Looking ahead, New Zealand’s CPI data, to be released in the next Asian session, could be pivotal in determining whether the RBNZ will follow through with a second 50bps rate cut in November. Technically, NZD/USD continues to hover in tight range above 61.8% retracement of 0.5849 to 0.6378 at 0.6051. Further decline is expected as long as 0.6172 resistance holds. Firm break of 0.6051 will extend the decline from 0.6378 to 0.5849 support next.
In Europe, at the time of writing, FTSE is down -0.42%. DAX is up 0.30%. CAC Is down -0.91%. UK 10-year yield is down -0.0571 at 4.185. Germany 10-year yield is down -0.049 at 2.232. Earlier in Asia, Nikkei rose 0.77%. Hong Kong HSI fell -3.67%. China Shanghai SSE fell -2.53%. Singapore Strait Times fell -0.01%. Japan 10-year JGB yield rose 0.0241 to 0.976.
Canadian CPI down -0.4% mom in Sep, annual rate slows to 1.6% yoy
Canada's CPI fell -0.4% mom in September, much worse than expectation of -0.2% mom. Over the 12-month period, CPI slowed from 2.0% yoy to 1.6% yoy, below expectation of 1.8% yoy. That was the lowest figure since February 2021. The main contributor to headline deceleration was lower year-over-year prices for gasoline in September (-10.7%). CPI ex-gasoline was unchanged at 2.2% yoy.
The core measures showed CPI median unchanged at 2.3% yoy. CPI trimmed unchanged at 2.4% yoy. CPI common rose from 1.9% yoy to 2.1% yoy. All matched expectations.
Germany's ZEW jumps to 13.1 in Oct, driven by optimism on inflation and ECB rate cuts
Germany's ZEW Economic Sentiment index surged significantly to from 3.6 to 13.1 in October, surpassing market expectations of 10.2. However, Current Situation Index dropped further into negative territory, falling from -84.5 to -86.9, slightly worse than forecast of -85.0.
For the Eurozone, ZEW Economic Sentiment rose from 9.3 to 20.1, beating expectations of 16.9. Current Situation Index, however, saw a small decline, edging lower by -0.4 points to -40.8.
ZEW President Achim Wambach highlighted the mixed signals, noting that despite a very weak current economic situation in Germany, optimism is growing. He cited "stable inflation" expectations and the prospect of "further interest rate cuts" by ECB as key contributors to this improved outlook.
Wambach added that positive signals from key export markets such as the US, China, and the Eurozone also played a role in improving the outlook for Germany’s economy. China's recent economic stimulus measures have contributed to this optimism too, boosting expectations for Germany's exports.
Eurozone industrial production rises 1.8% mom in Aug, driven by capital goods
Eurozone industrial production increased by 1.8% mom in August, meeting market expectations. This growth was supported primarily by a significant 3.7% rise in capital goods production. Durable consumer goods also saw a notable rise of 1.7%, while energy production edged up by 0.4%. However, intermediate goods saw a contraction of -0.3%, and non-durable consumer goods posted a modest gain of 0.2%.
Across the broader European Union, industrial production rose by 1.3% mom. Ireland led the gains with a robust 4.5% rise, followed by Germany and Lithuania, which both saw increases of 3.3%. Malta also posted solid growth of 2.7%. On the downside, Luxembourg experienced a sharp decline of -9.2%, while Croatia and Denmark saw drops of -4.6% and -4.5%, respectively.
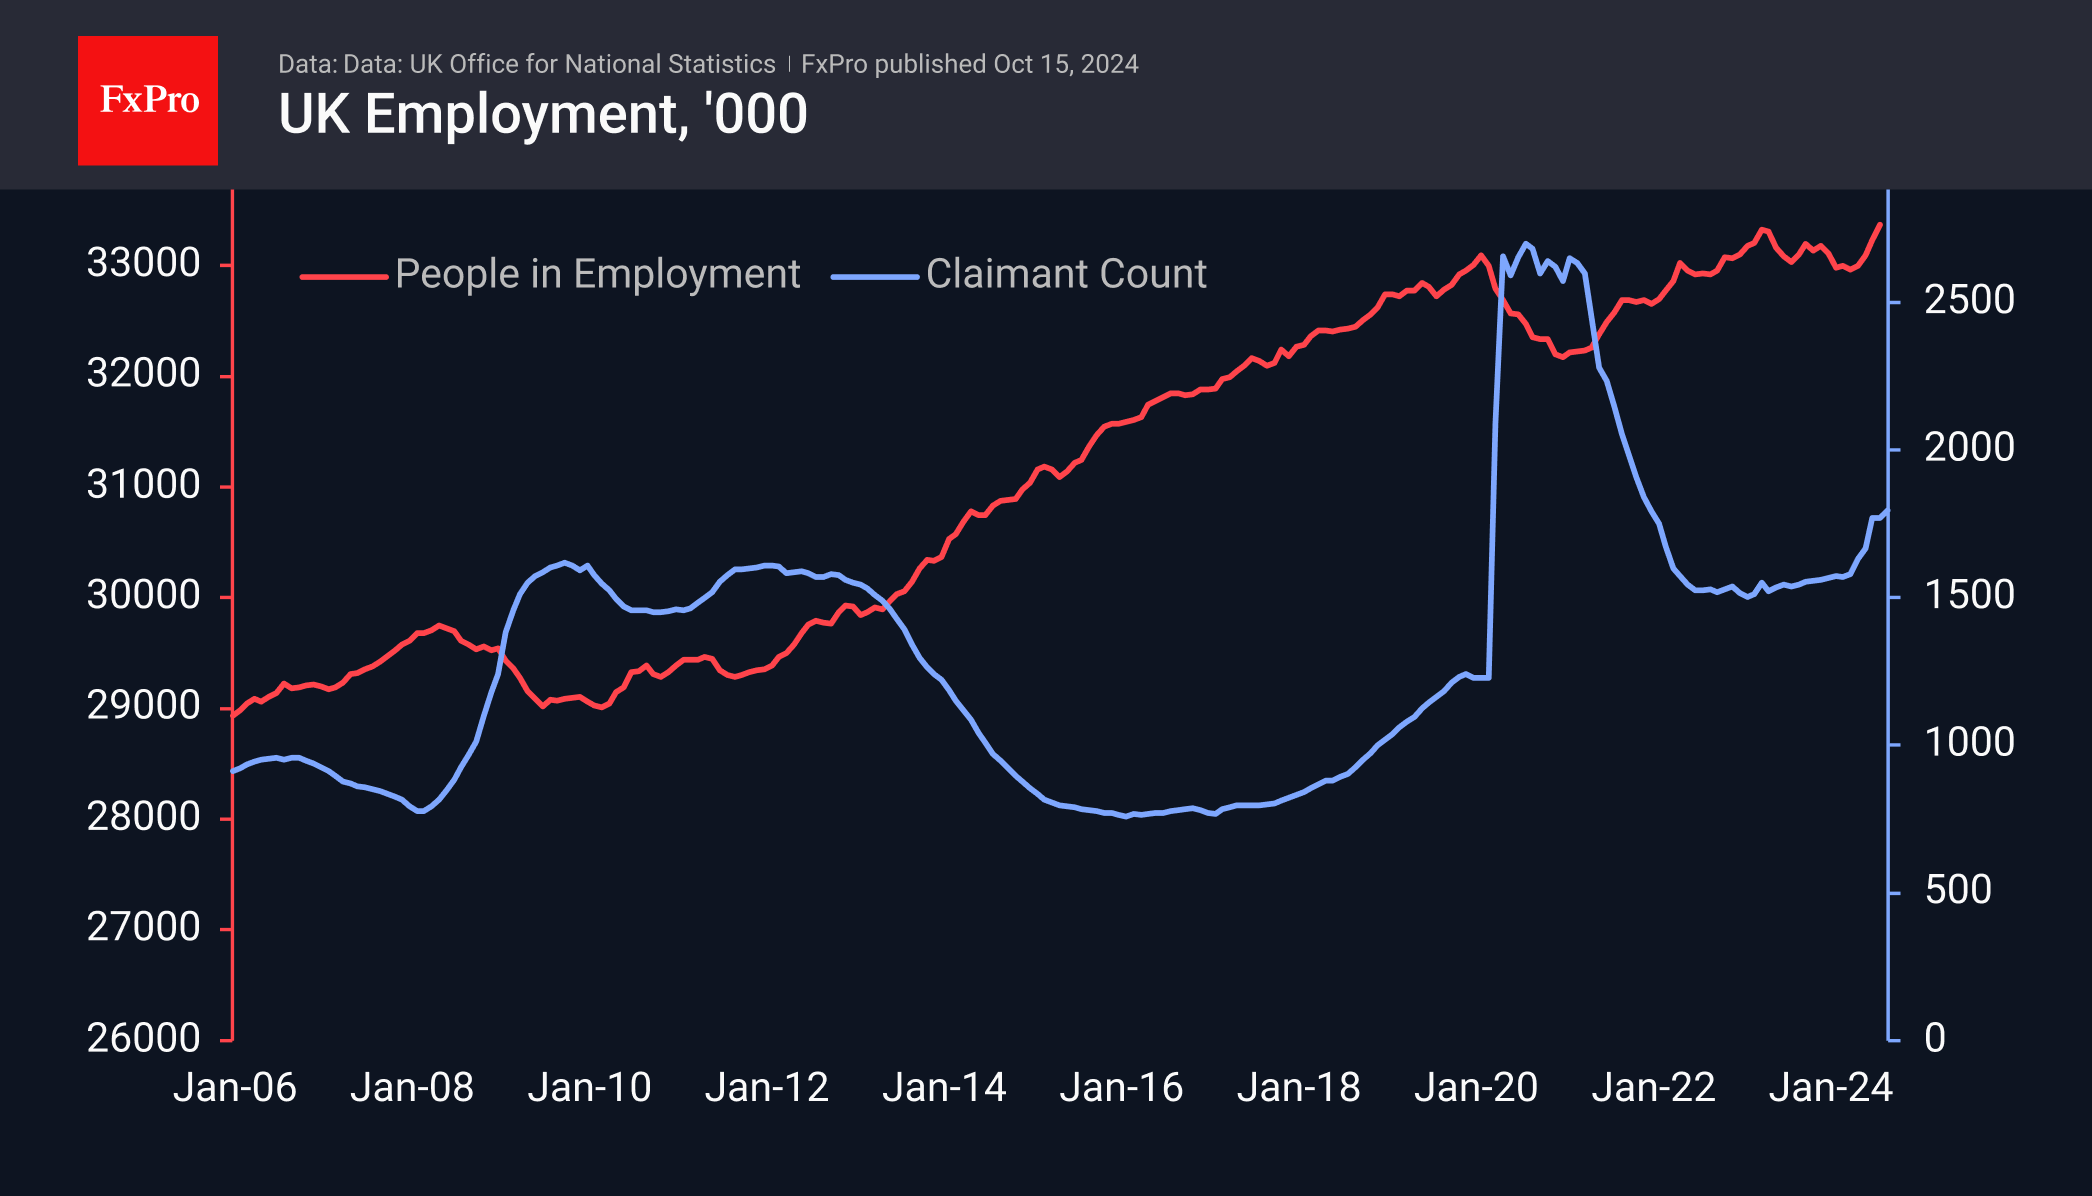
UK payrolled employment falls -15k in Sep, unemployment rate dips to 4% in Aug
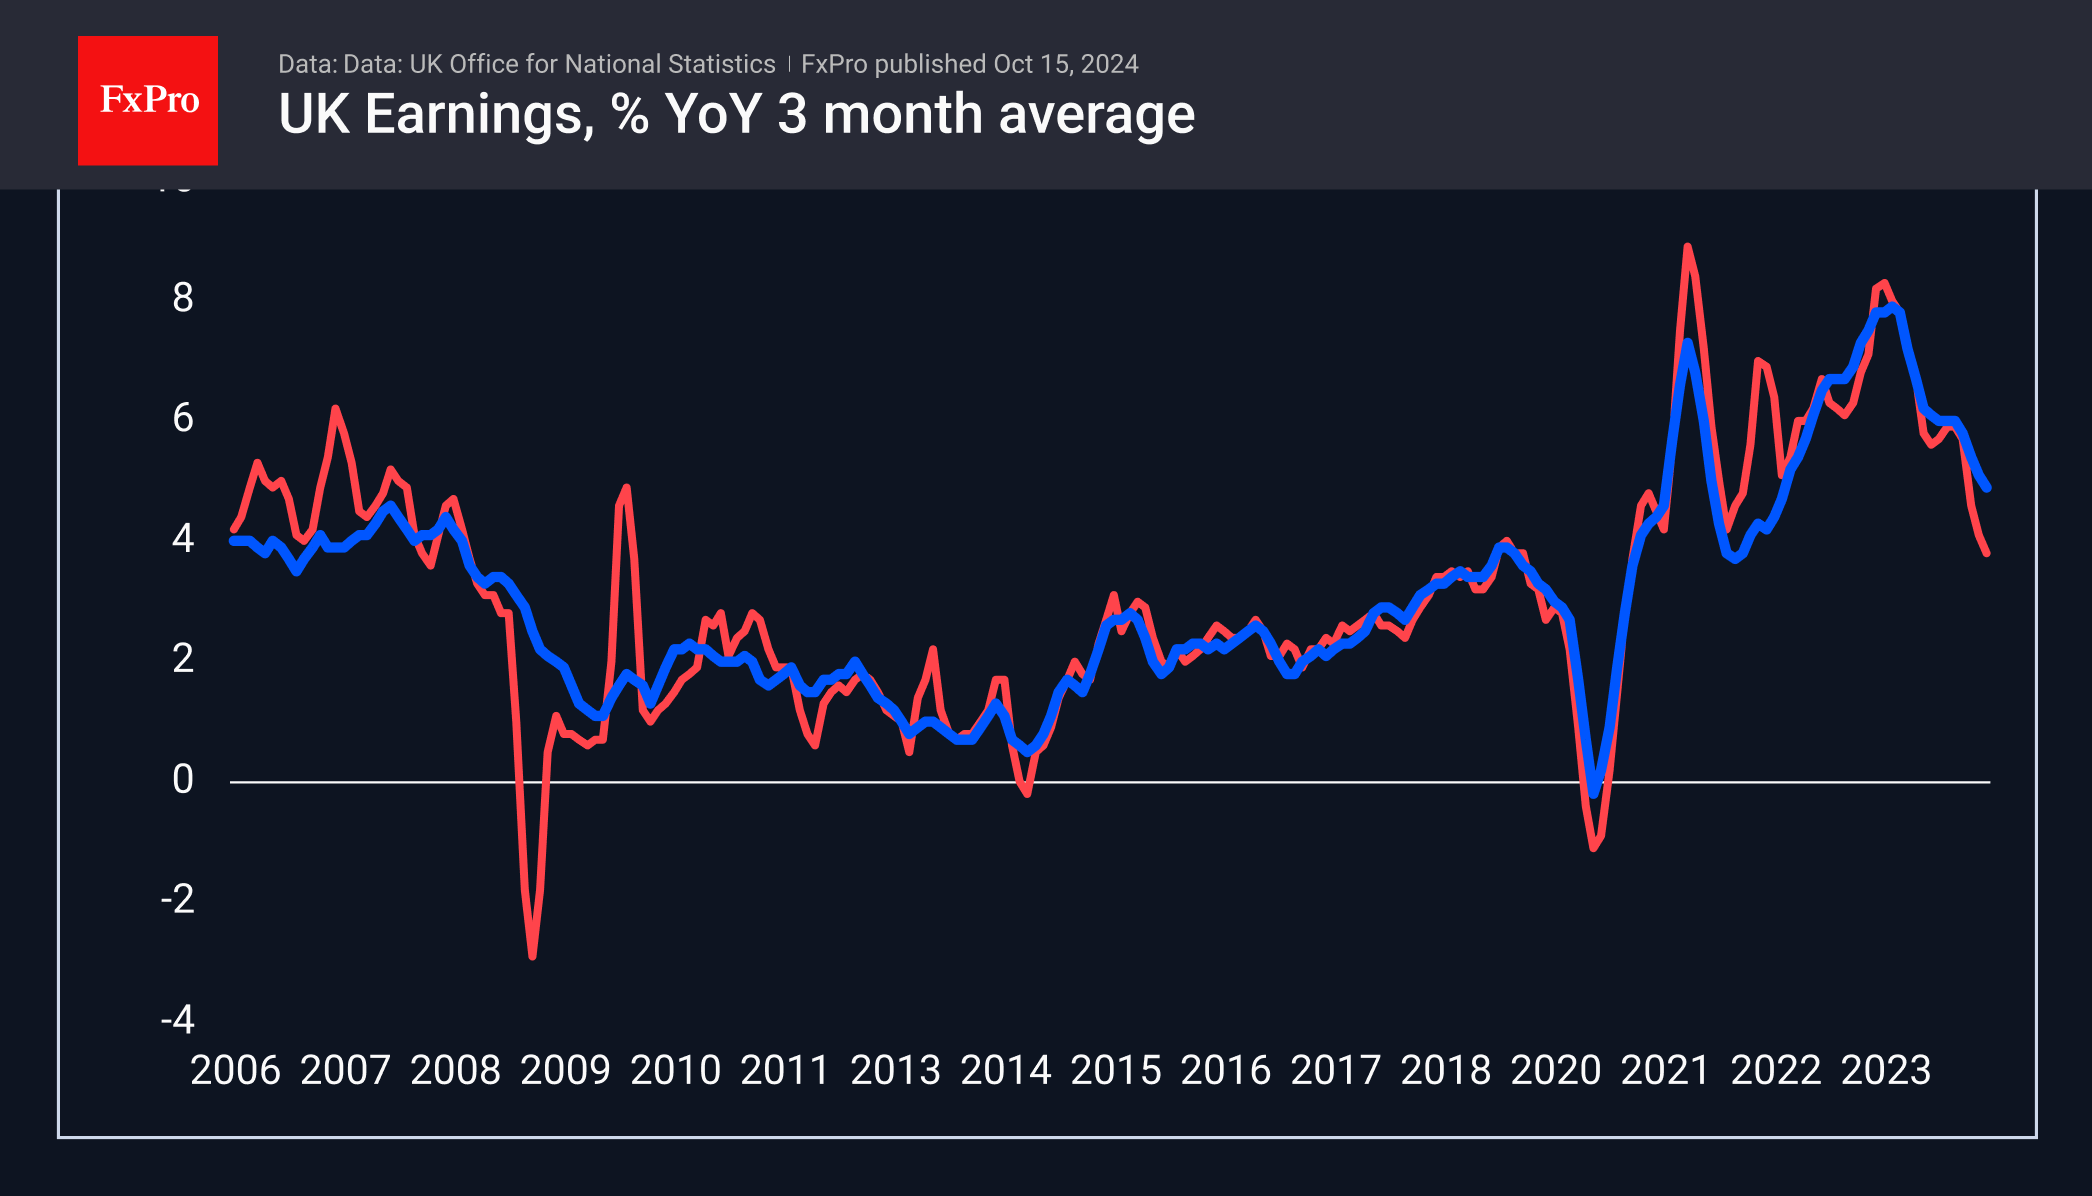
In September, UK payrolled employment decreased -15k or -0.0% mom, but increased by 113k or 0.4% yoy, to 30.3m. Median monthly pay rose 5.3% yoy, down from prior 6.0% yoy, but stays well above June's 3.8% yoy. Claimant count rose 27.9k to 1.797m, above expectation of 20.2k.
In the three months to August, unemployment rate fell from 4.1% to 4.0%, below expectation of 4.0%. Average regular earnings excluding bonuses rose 4.9% yoy, down from prior 5.1% yoy, below expectation of 5.0% yoy. Average regular earnings including bonuses rose 3.8% yoy, down from prior 4.0% yoy, matched expectations.
USD/CAD Mid-Day Outlook
Daily Pivots: (S1) 1.3768; (P) 1.3786; (R1) 1.3816; More...
Intraday bias in USD/CAD remains on the upside as rise from 1.3418 is in progress. Next target is a test on 1.3946/76 key resistance zone. On the downside, 1.3769 minor support will turn intraday bias neutral first. But further rally will be expected as long as 1.3646 resistance turned support holds, in case of retreat.
In the bigger picture, sideway consolidation pattern from 1.3976 (2022 high) might still extend further. While another decline cannot be ruled out, strong support should emerge above 1.2947 resistance turned support to bring rebound. Rise from 1.2005 (2021 low) is still in favor to resume at a later stage.
Canadian CPI down -0.4% mom in Sep, annual rate slows to 1.6% yoy
Canada's CPI fell -0.4% mom in September, much worse than expectation of -0.2% mom. Over the 12-month period, CPI slowed from 2.0% yoy to 1.6% yoy, below expectation of 1.8% yoy. That was the lowest figure since February 2021. The main contributor to headline deceleration was lower year-over-year prices for gasoline in September (-10.7%). CPI ex-gasoline was unchanged at 2.2% yoy.
The core measures showed CPI median unchanged at 2.3% yoy. CPI trimmed unchanged at 2.4% yoy. CPI common rose from 1.9% yoy to 2.1% yoy. All matched expectations.
Fall in Unemployment Supports Pound, But Concerns Grow
The UK unemployment rate fell to 4.0% in August, the lowest since January, and went down from a peak of 4.4% in April and May. The data beat expectations and supported Sterling buying from intraday lows below 1.3040. Employment figures have been gaining momentum in recent months, with 373K more jobs created in July and August than in the previous three months.
However, the situation is not so rosy when looking at the figures in a broader context. Firstly, the ONS publishes its preliminary estimates for September, which show a fall of 15k in the number of people in work. Second, the number of people claiming unemployment benefits rose by 27.9K in September, bringing the total over the past six months to almost 225K. Thirdly, job vacancies fell by 34K in the three months to September, confirming the cooling of the labour market.
The continued slowdown in wage growth is also worrying. They were 3.8% higher in the three months to August than in the same period a year earlier. Excluding bonuses, the increase was 4.9%. This is above the 2.2% inflation rate but builds on a slowing trend that has been in place since the middle of last year.
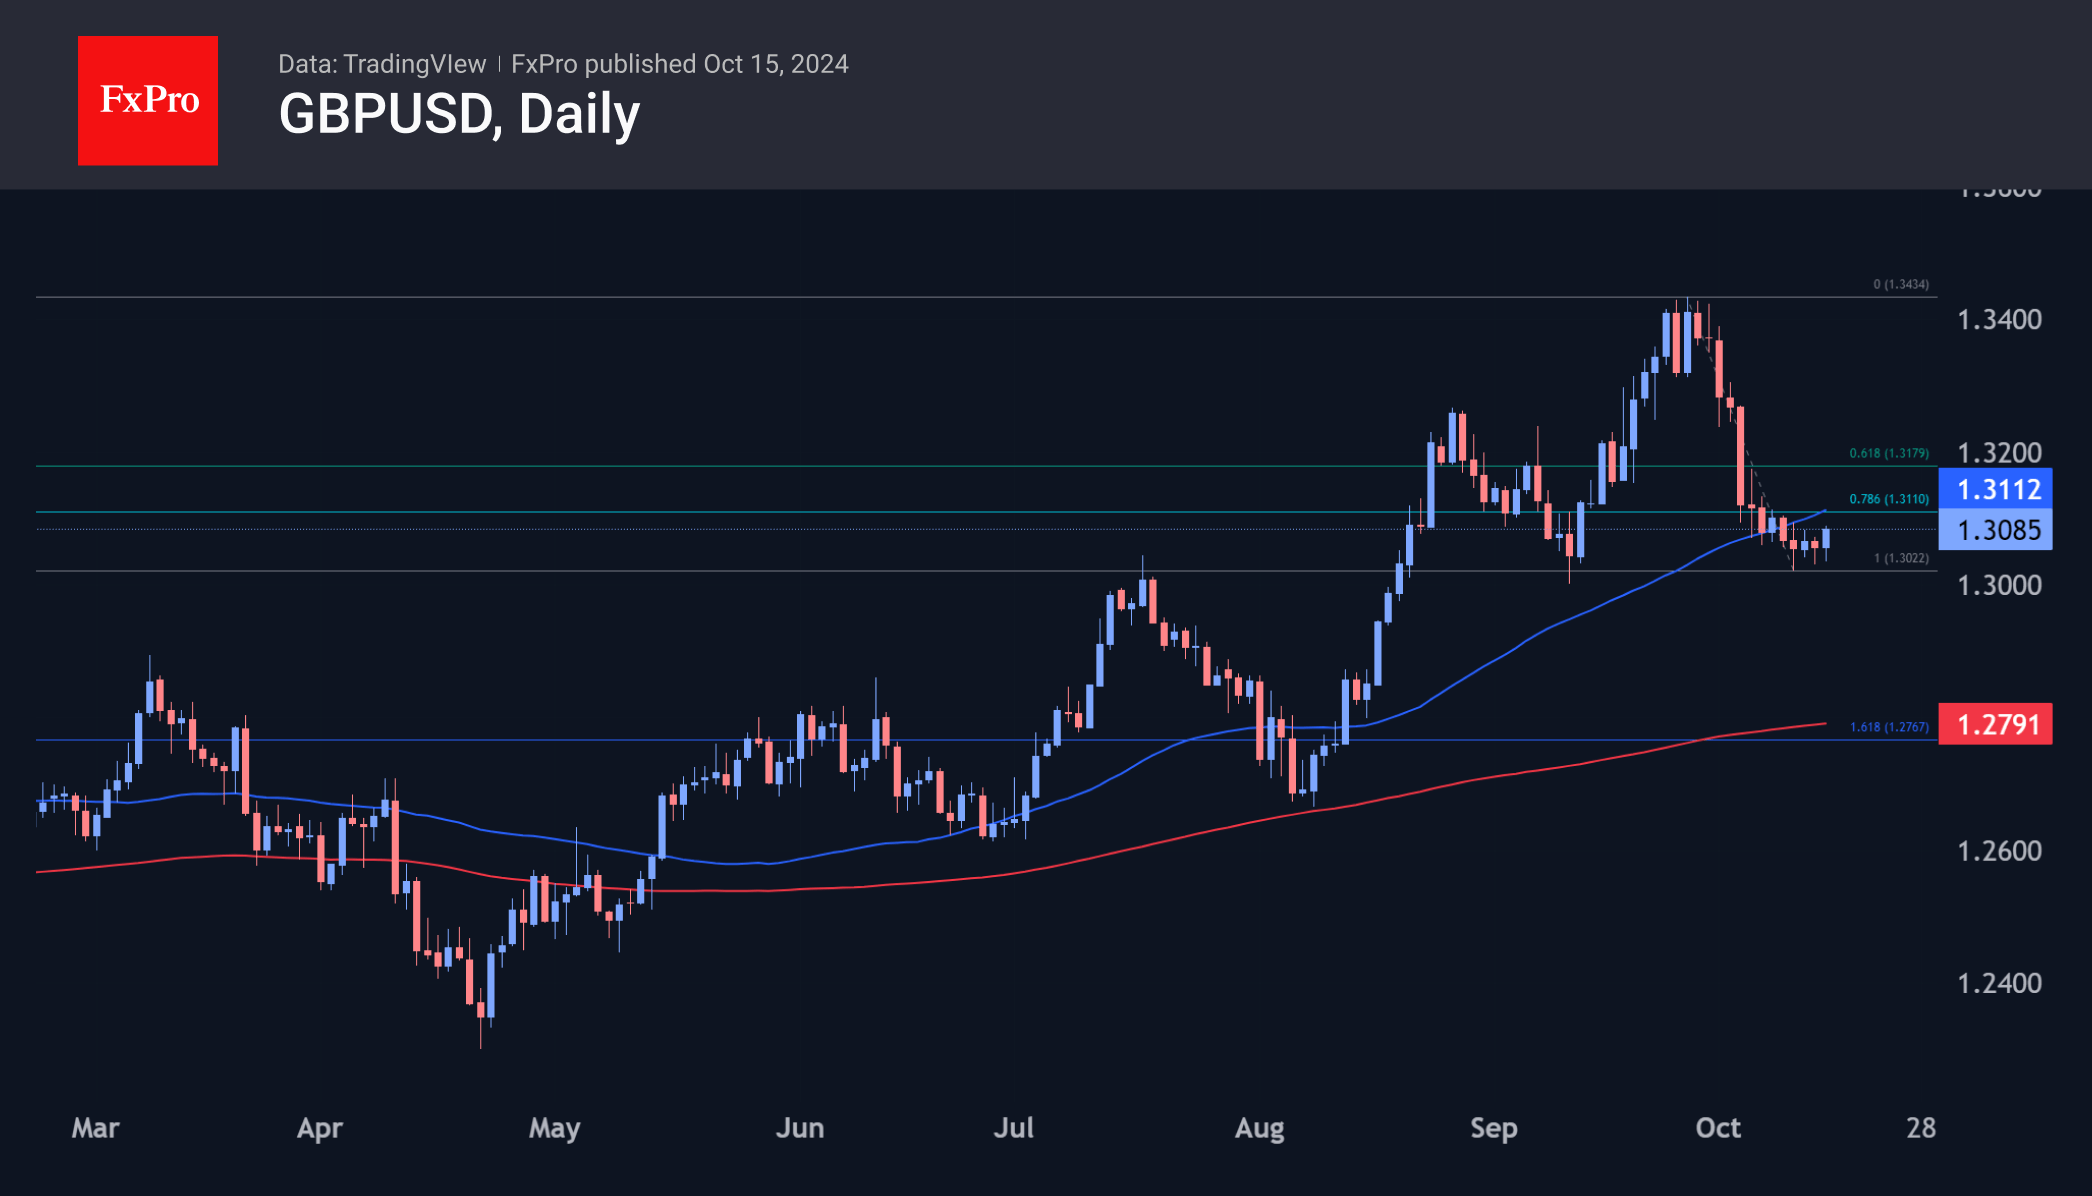
The markets seem to have used the new data to take profits from the previous decline in the GBPUSD. The pair has gained 0.2% since the start of the day and has climbed to the 1.3080 level, last Thursday’s high. Technically, there are no significant obstacles to the upside until the 1.3115 area, which is the 50-day moving average and the area of the previous consolidation in early October.
In a more bullish scenario for the Pound, a full-blown corrective bounce could develop into the 1.3120-1.3180 area, but further gains will require more than a portfolio shake-up—a more global shift in sentiment is needed.
.
Canadian Dollar Can’t Find Its Footing, Can. CPI Next
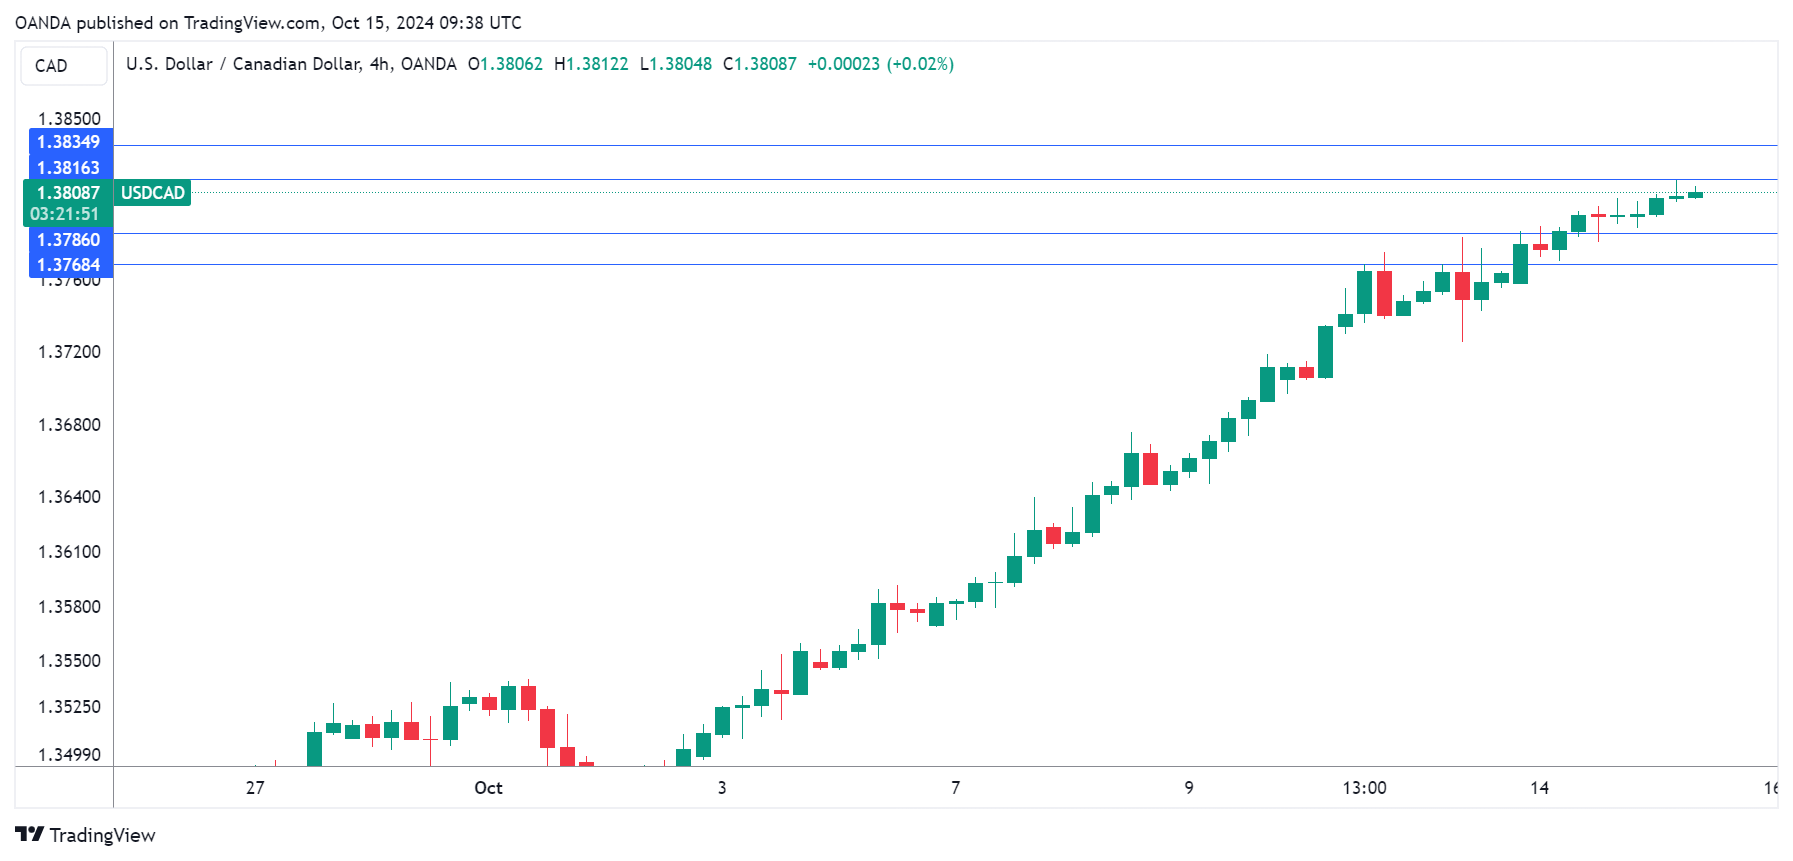
The Canadian dollar has declined against the US dollar for a tenth consecutive trading day and has fallen 2.1% in October. In Tuesday’s session, USD/CAD is trading at 1.3811 at the time of writing, up 0.11%.
Canada’s inflation rate expected to fall below 2%
Is the tough battle against inflation finally over? Inflation has been falling and the August CPI was a milestone as inflation dropped from 2.5% to 2%, the Bank of Canada’s target. This was the lowest level since February 2021.
The downward trend is expected to continue in September, with a market estimate of 1.8%. Two key core measures are expected to remain around 2.4%. Monthly, inflation is projected to ease to -0.1%, compared to 0.1% in August. Gasoline prices have been falling and are expected to push September CPI’s below 2%.
Today’s CPI release is the last key economic report before the Bank of Canada announces its next rate decision on October 23. With inflation under control, the BoC has shifted its primary focus away from inflation to the labor market. The BoC has been aggressive and has lowered rates three times this year, as inflation has fallen and the labour market has weakened.
However, the September employment report was stronger than expected, which supports the case for a modest 25-basis point cut rather than a jumbo 50-bps move in October. The BoC would prefer to trim rates gradually at a 25-bps clip, but if key economic data is softer than expected, the BoC could respond with a 50-bps cut.
USD/CAD Technical
- USD/CAD is putting pressure on resistance at 1.3816. Above, there is resistance at 1.3834
- 1.3786 and 1.3768 are the next support levels
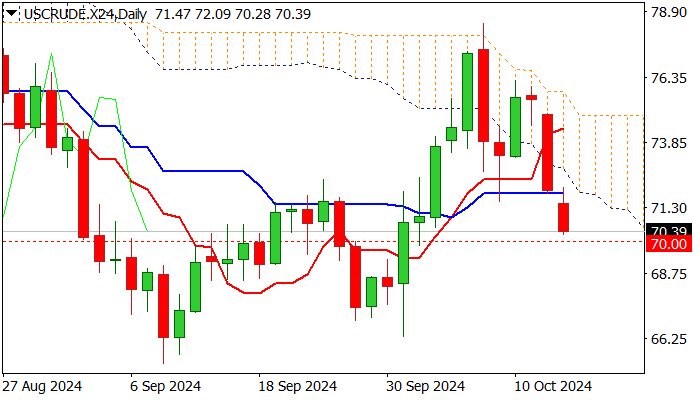
WTI Outlook: Oil Prices Fall Further on Demand Concerns, But Geopolitics Remain Supportive
Oil price extends steep decline into the second consecutive day and hit two week low in early Tuesday, after the price fell nearly 4% on Monday.
Oil was deflated by weaker demand outlook and signals that Israel will not strike Iranian oil infrastructure.
OPEC cut its forecast for global oil demand in 2024, which increased pressure on oil prices, but negative impact is likely to be partially offset by heated geopolitical situation and permanent threats of further escalation.
Oil price fell near psychological $70 support, where bears may face increased headwinds, as 14-d momentum is attempting to reverse north just above the centreline and stochastic is about to probe into negative territory.
Pause at $70 level looks like possible scenario, although near-term bears will remain in play while potential upticks hold below (daily cloud base / Kijun-sen ($71.89) and offer better selling opportunities.
On the other hand, firm break through $70 pivot would signal bearish continuation and expose targets at $66.33 (Oct 1 low) and $65.26 (2024 low posted on Sep 9).
Res: 70.74; 71.89; 72.69; 73.70.
Sup: 70.00; 69.30; 68.37; 66.33.
Natural Gas Price Drops Over 8% Since the Start of the Month
On 26 September, when analysing the XNG/USD natural gas price chart, we noted that:
→ Bulls might be "gathering strength" for a potential attempt to break the psychological level of 3.00.
→ If successful, this would pave the way towards the yearly high around 3.20.
Since then, the price of natural gas:
→ Broke above the 3.00 level on 27 September;
→ Reached 3.20 on 4 October, after which it reversed downward.
Bearish sentiment was driven by:
→ News that Hurricane Helen had minimal impact on natural gas processing facilities along the U.S. Gulf Coast;
→ Adequate gas reserves ensuring sufficient supply;→ Weather forecasts indicating short-term gas demand at the end of September.
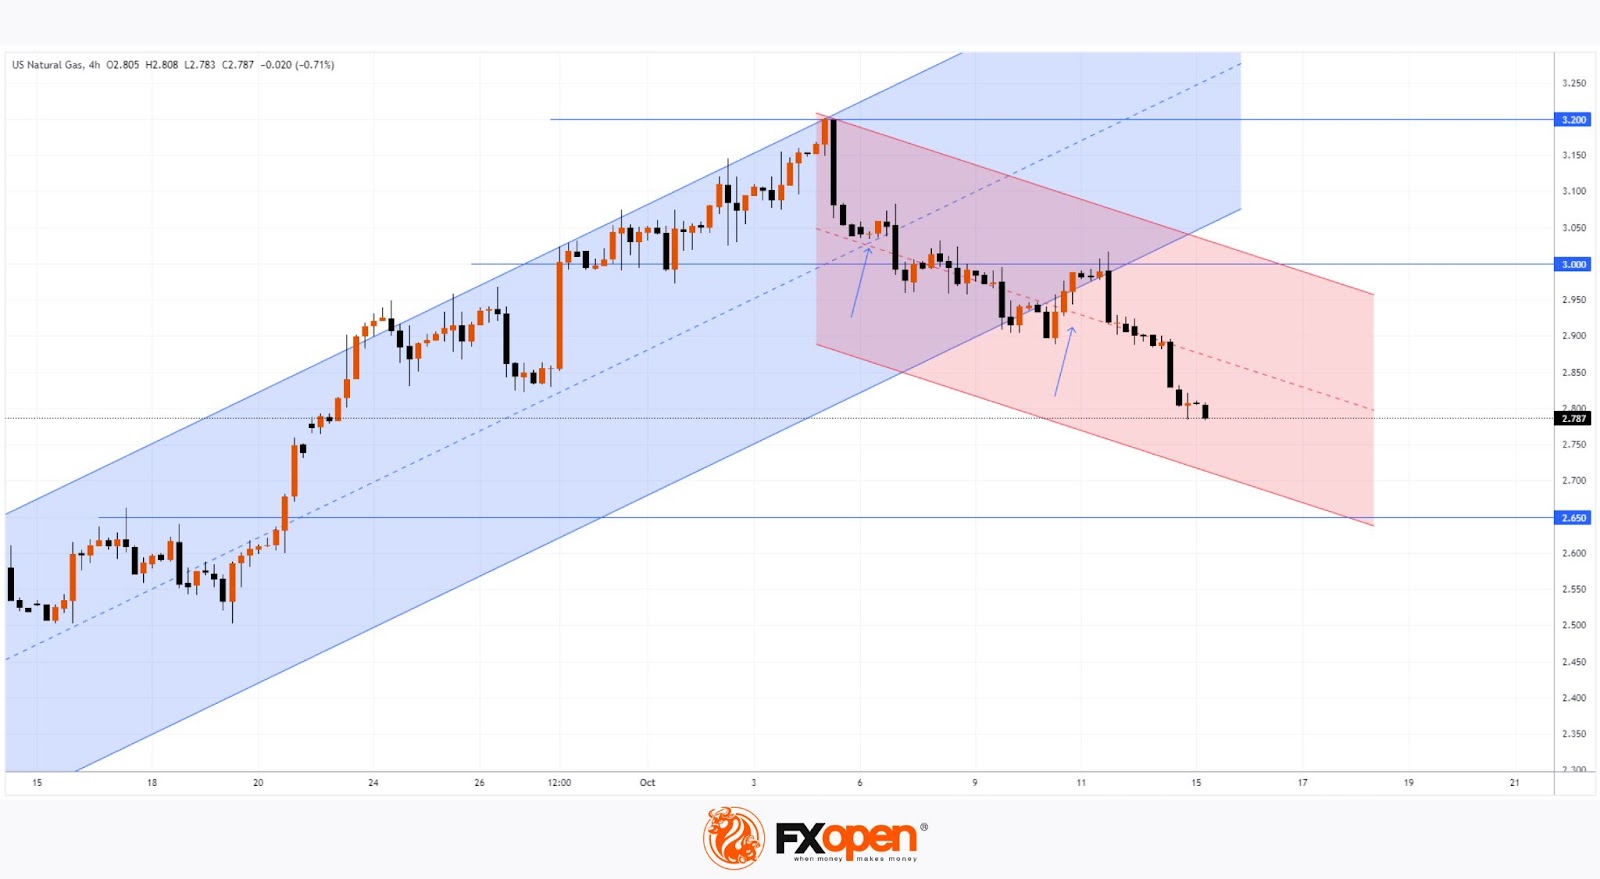
Technical analysis of the XNG/USD chart shows the upward channel (marked in blue) has lost relevance. It’s evident that:
→ The bounce from the median line (shown by the first arrow) was weak;
→ The attempt to re-enter the channel from its lower boundary (as shown by the second arrow) led to a test of the 3.00 psychological level, which acted as resistance.
There are no signs yet of bulls trying to regain control on the XNG/USD chart. If the supply and demand balance remains unchanged, the natural gas price may continue its decline within the red downward channel, possibly towards its lower boundary, reinforced by the former resistance at 2.65.
Start trading commodity CFDs with tight spreads. Open your trading account now or learn more about trading commodity CFDs with FXOpen.
This article represents the opinion of the Companies operating under the FXOpen brand only. It is not to be construed as an offer, solicitation, or recommendation with respect to products and services provided by the Companies operating under the FXOpen brand, nor is it to be considered financial advice.