
Sample Category Title
Pound Falls to 3-Week Low, Markets Expect BoE Cut in November
The British pound continues to lose ground on Monday after a dismal week. In the European session, GBP/USD is trading at 1.3063, down 0.48% on the day and its lowest level since October 12. The pound can’t find its footing against the rejuvenated US dollar and fell 1.9% last week.
Much of the pound’s slide was driven by comments from Bank of England Governor Bailey. On Thursday, Bailey said that the BoE could cut rates more aggressively if inflation continues to fall. The pound reacted with a slide of 1% after the comments as the markets took Bailey’s remarks as a signal that the central bank is ready to ratchet up the pace of rate cuts. The BoE trimmed rates in August for the first time in four years but paused in September. Another rate cut is widely expected at the November meeting.
A day after Bailey’s remarks, the BoE’s Chief Economist Huw Pill sought to dampen the excitement over potential rate cuts. Pill urged caution and called for a gradual easing of policy. Pill added that service inflation and wage growth were “a continued source of concern”.
US nonfarm payrolls blow past estimate
The US labor market remains resilient, as September nonfarm payrolls soared by 254 thousand, up from a revised 159 thousand in August and crushing the market estimate of 140 thousand. This was the strongest job report in six months. The unemployment rate dipped lower to 4.1%, compared to 4.2% in August and below the market estimate of 4.2%. The markets have raised the odds of a 25-basis point cut at the Fed November meeting to 87%, compared to 65% one week ago.
GBP/USD Technical
- GBP/USD is testing support at 1.3072. Below, there is support at 1.3018
1.3123 and 1.3177 are the next resistance lines
Silver (XAGUSD) Buying the Dips at the Blue Box Area
In this technical article we’re going to take a quick look at the Elliott Wave charts of Silver (XAGUSD ) commodity , published in members area of the website. As our members know, Silver has recently given us correction against the September 6th low. The commodity reached our target zone and completed correction right at the Equal Legs ( Blue Box Area) . In further text we’re going to explain the Elliott Wave pattern and trading setup.
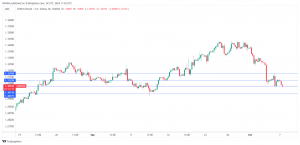
SILVER H1 Update 09.30.2024
The commodity is giving us wave (iv) blue correction. The pull back has incomplete structure at the moment. Consequently, we are looking for another short term low toward the extreme zone ( Blue Box ). However, we don’t recommend selling it. We expect it to attract buyers at the Blue Box zone. The commodity could make either rally towards new highs or a larger corrective bounce in three waves at least. Once the bounce reaches the 50% Fibonacci retracement level against the connector high – x red, we’ll secure our position by moving the stop-loss to breakeven. Break below the marked invalidation level : 30.44 would invalidate the trade.
A quick reminder:
Our charts are designed for simplicity and ease of trading:
Red bearish stamp + blue box = Selling Setup
Green bullish stamp + blue box = Buying Setup
Charts with Black stamps are deemed non-tradable. 🚫
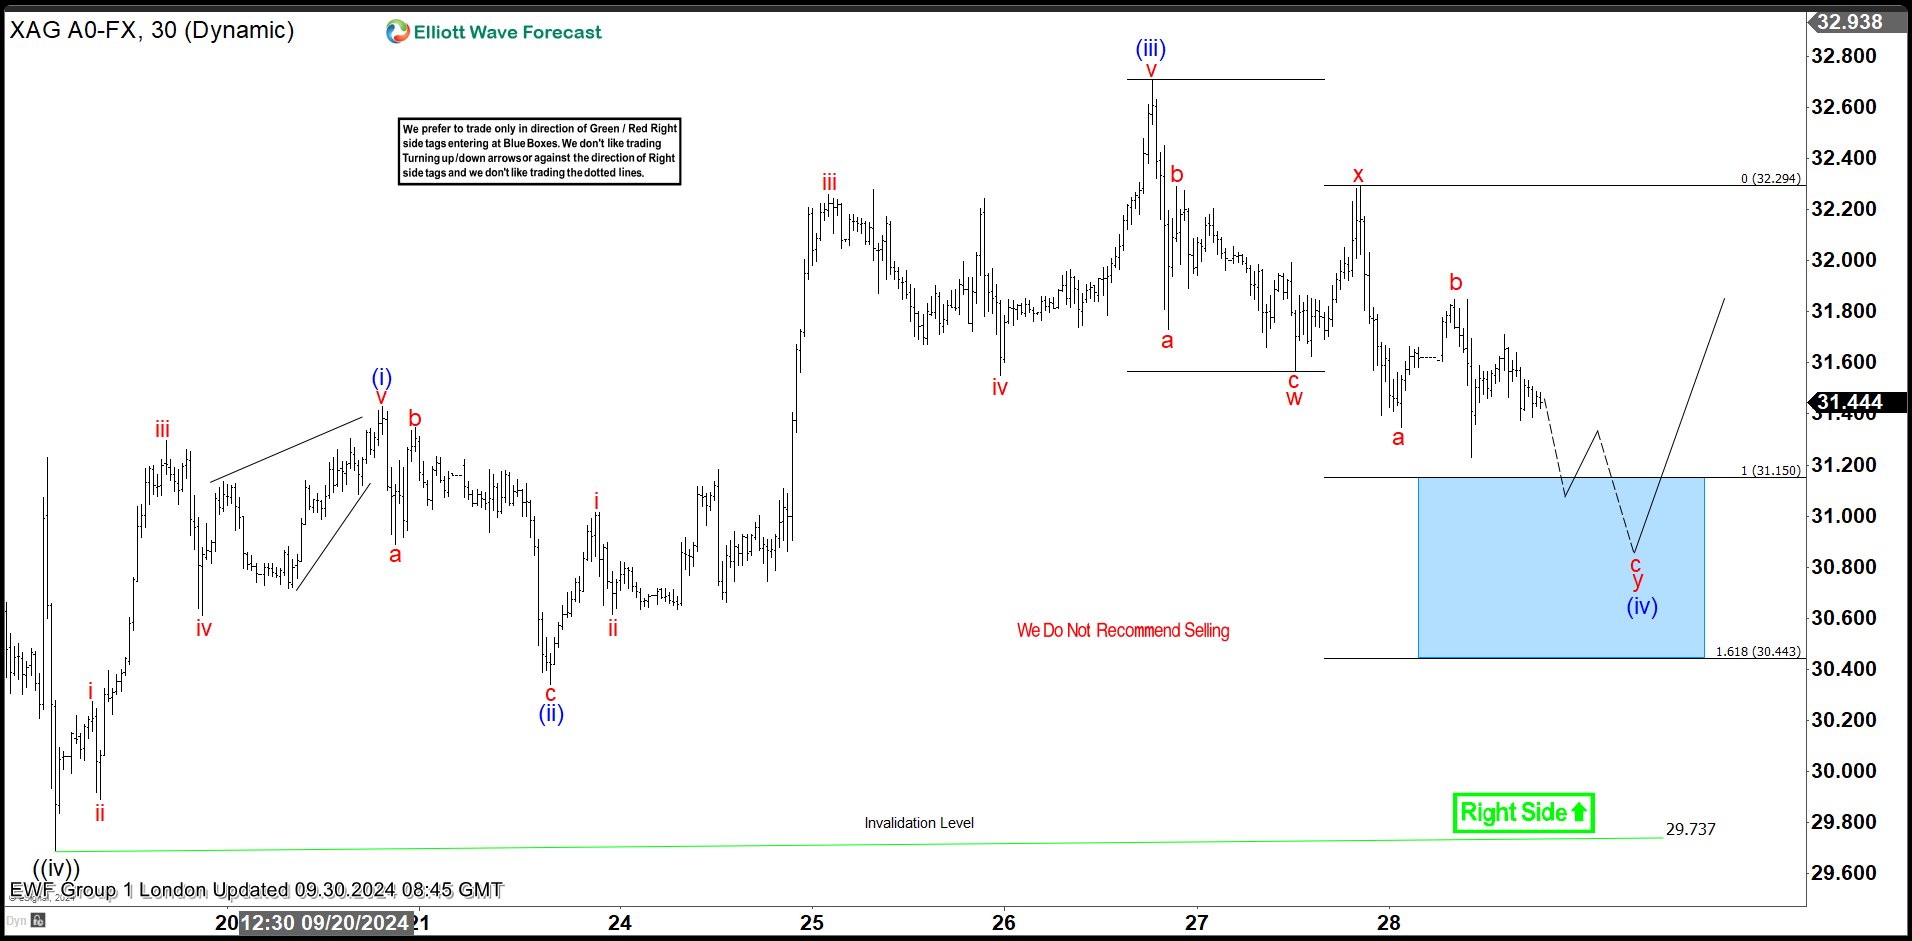 SILVER H1 Update 10.01.2024
The commodity made another leg down and found buyers within the Blue Box area as expected. We got a nice rally from our buying zone, consequently counting 4 red pull back completed at 30.86 low. The bounce has exceeded the 50% Fibonacci retracement level against the connector peak – currently marked as ((x)) black. As a result, traders who entered long positions are now enjoying risk-free profits. With the price holding above the 30.86 low, we believe the next leg up can be in progress. For confirmation on the next leg up, we’re looking for a break above the 3 red peak.
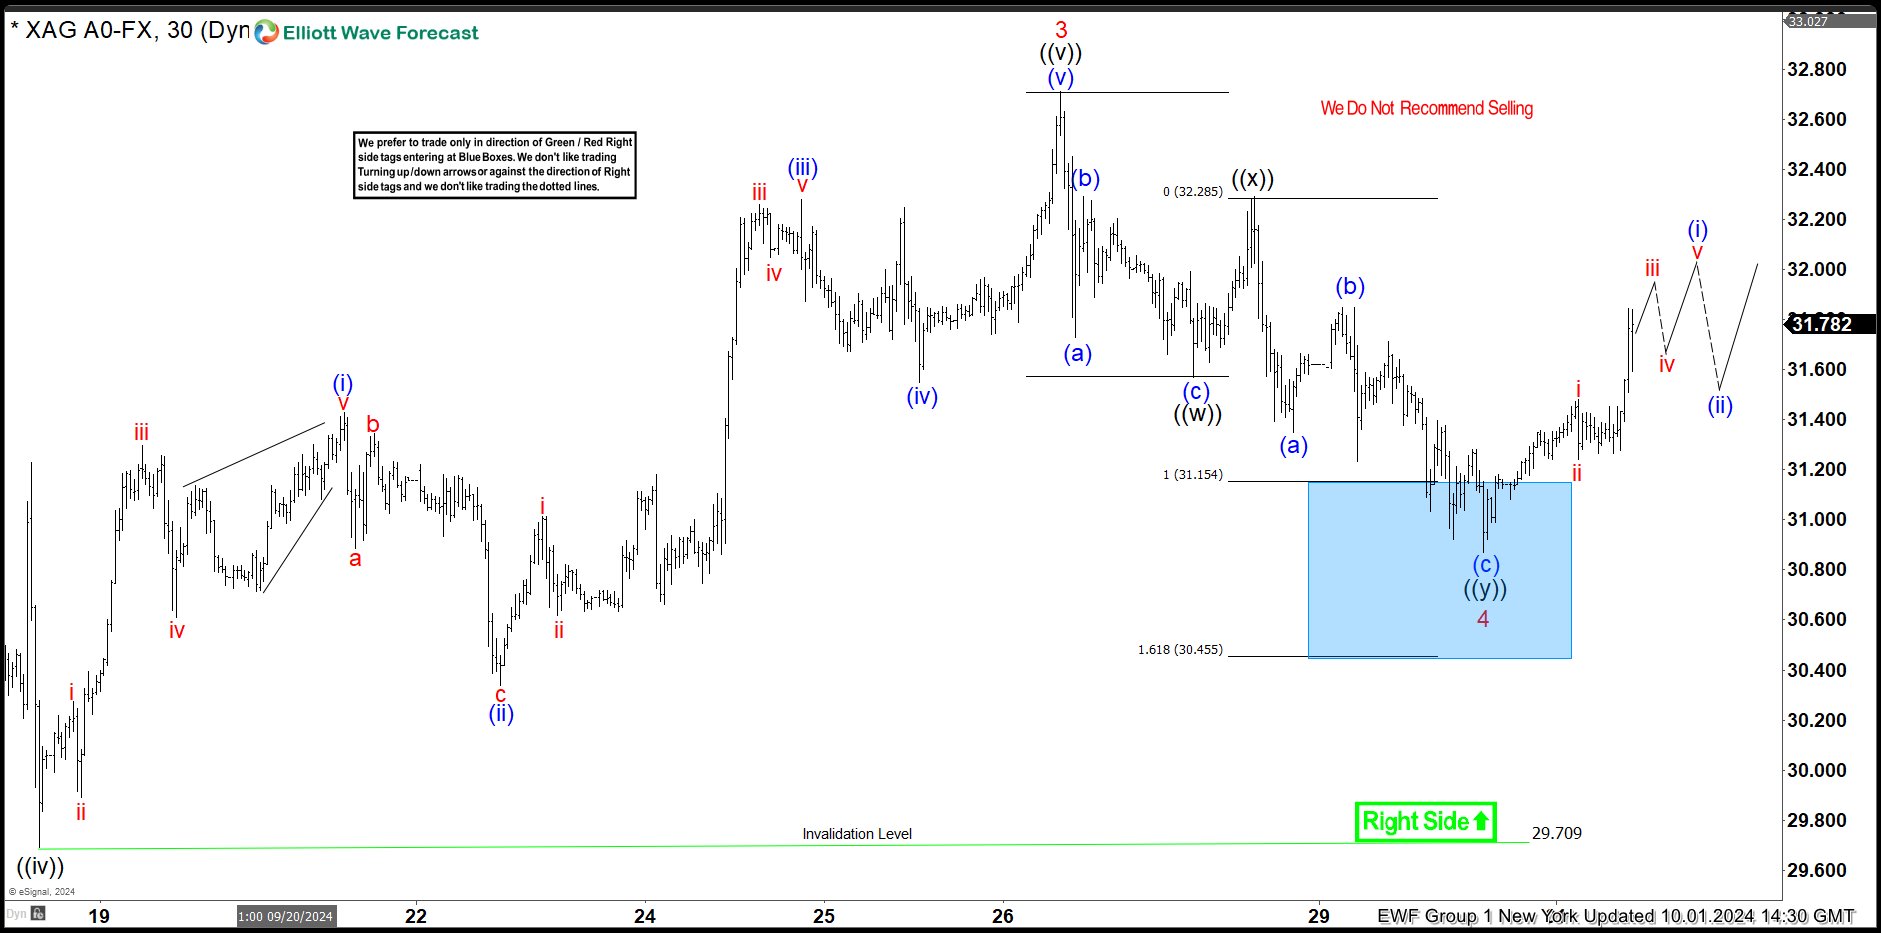
SILVER H1 Update 10.05.2024
Eventually the commodity made break of 3 red peak as we expected. We expect Silver to keep trading higher ideally as far as pivot at 30.86 low holds.
Russell 2000: Soft to No-Landing Supporting Another Bullish Upleg
- Better than expected US non-farm payrolls & unemployment rate for September have revived the soft to non-landing narrative.
- The Citigroup US Economic Surprise Index has improved significantly since August.
- The improvement in US economic growth prospects is likely to benefit the Russell 2000 at least in the medium-term.
Since our last publication, the performance of Russell 2000 was still down by 2.20% as of last Friday, 4 October close but managed to recover from a synchronized risk-off episode that took shape from late July to early August; since its 5 August low, it has rebounded by 11%.
The latest US non-farm payroll print for September has increased significantly from the prior month and surpassed expectations by a wide margin; +254K jobs added versus +140K consensus estimates and above +159K added for August.
In addition, the unemployment rate for September ticked lower to 4.1% from 4.2% in August which thrust the “soft-landing to no-landing” US economic growth narrative back into the limelight.
Last Friday, the Russell 2000 outperformed among the major US stock indices with a daily gain of 1.50% due to its higher sensitivity towards an improvement in economic growth prospects in the US as it comprises small-cap listed companies that derived most of the revenue streams (close to 80% on the aggregate) domestically in the US.
US economic growth prospects have improved
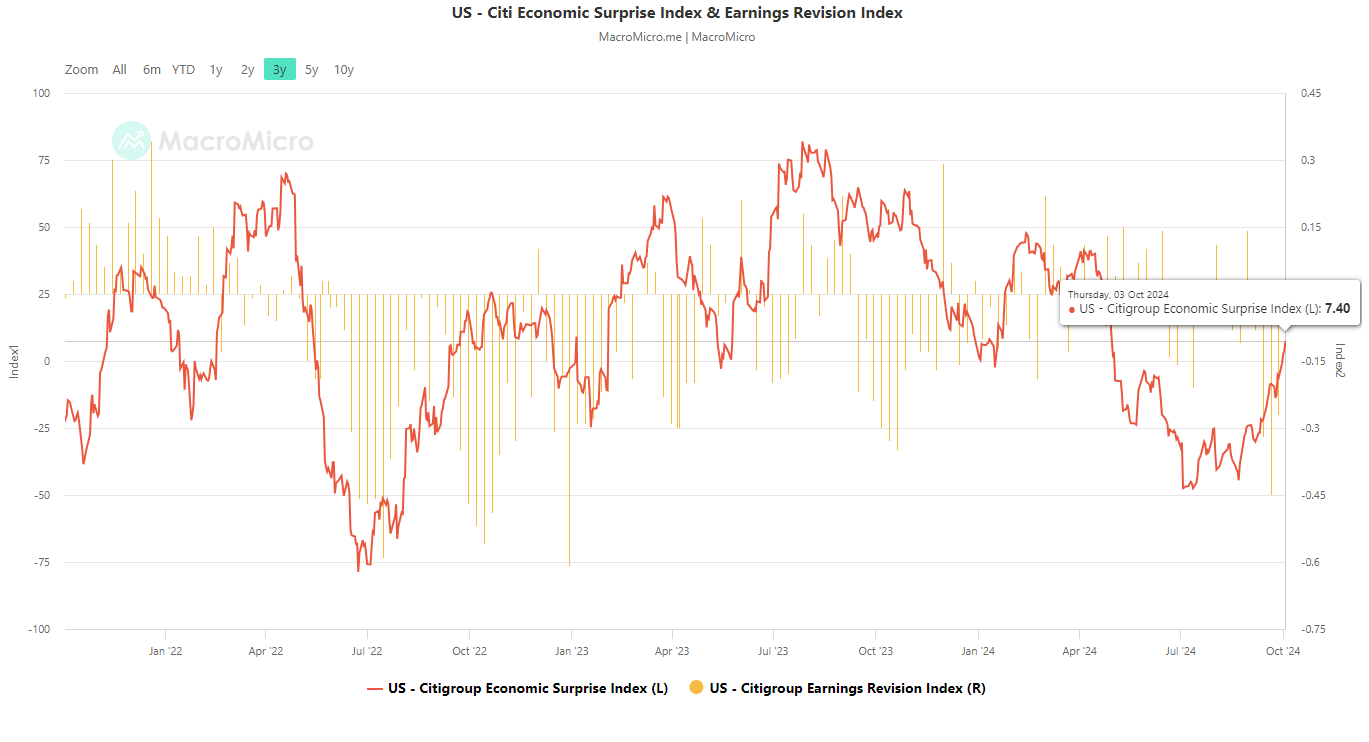
Fig 1: Citigroup US Economic Surprise Index as of 3 Oct 2024 (Source: MacroMicro, click to enlarge chart)
On an accumulated net basis, more key US economic data came in better than expected in the past month where the Citigroup US Economic Surprise Index has improved significantly from a negative print of -44.50 on 22 August to 7.40 as of 3 October; after it hovered below the negative territory since May (see Fig 1).
Hence, the latest positive trend change seen in the Citigroup US Economic Surprise Index is likely to benefit the laggard Russell 2000 as it is still the only major US stock index among the S&P 500, Nasdaq 100, and Dow Jones Industrial Average that has not scaled new fresh all-time high in past three years; it is still 11% below from its current all-time high of 2,458 printed on 8 November 2021 based on last Friday, 4 October closing price.
2,080 key medium-term support to watch on Russell 2000

Fig 2: US Russell 2000 CFD Index major and medium-term trends 7 Oct 2024 (Source: MacroMicro, click to enlarge chart)
In the lens of technical analysis, the two prior corrective decline sequences of 11% and 14% have managed to find support at the 200-day moving average of the US Russell 2000 CFD Index (a proxy of the E-mini Russell 2000 futures) on 19 April and 5 August which suggests that the major uptrend phase since its 27 October 2023 swing low remains intact (see Fig 2).
Secondly, the daily RSI momentum indicator has continued to print a series of “higher lows” since 7 August which suggests that medium-term bullish momentum has resurfaced.
If the 2,080 key medium-term pivotal support holds, the US Russell 2000 CFD Index may resume its impulsive upmove sequence within its major uptrend phase for the next medium-term resistance to come in at 2,350/390.
However, failure to hold at 2,080 with a daily close below it invalidates the bullish tone for a corrective decline to expose the next medium-term support at 1,990, and even the major support of 1,920/1,890 next.
Bitcoin and Ethereum Found Buyers at Key Levels
Market picture
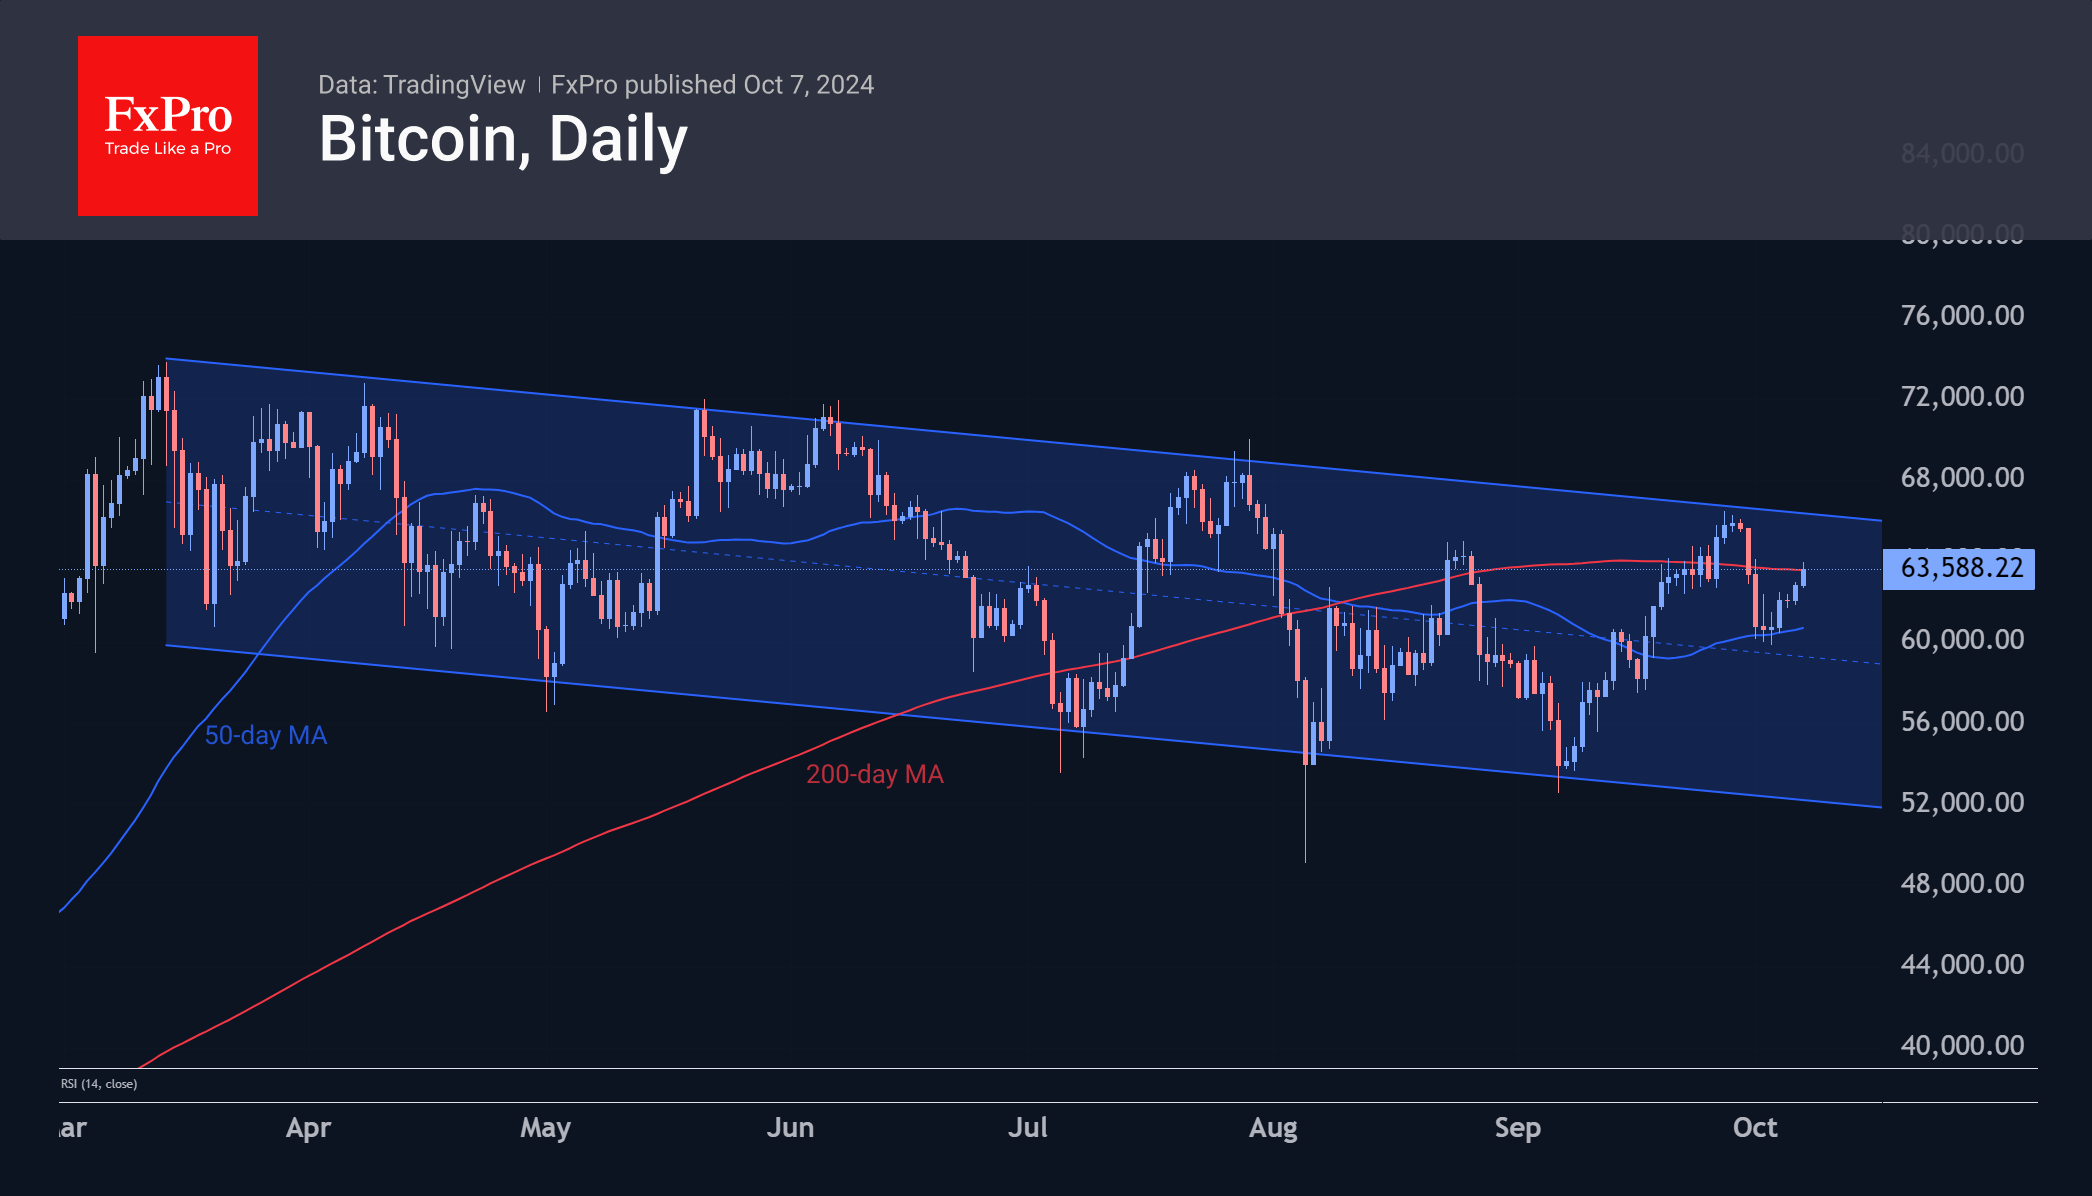
The cryptocurrency market fell at the end of last week. The capitalisation went down 3% in seven days to $2.21 trillion. However, it is worth noting the return of positive sentiment from Thursday, when buyers found Bitcoin attractive at $60K. The cryptocurrency fear and greed index is right in the middle, having risen out of the fear zone.
Last week, bitcoin successfully bounced out of the area where the 50-day moving average and the $60K round level intersect. The cryptocurrency’s 1.5% rise since the start of the day on Monday to $63.5K has brought the price back to test the 200-day moving average. A consolidation above would act as a bullish signal, indicating that the corrective pullback is over and buyers are taking over.
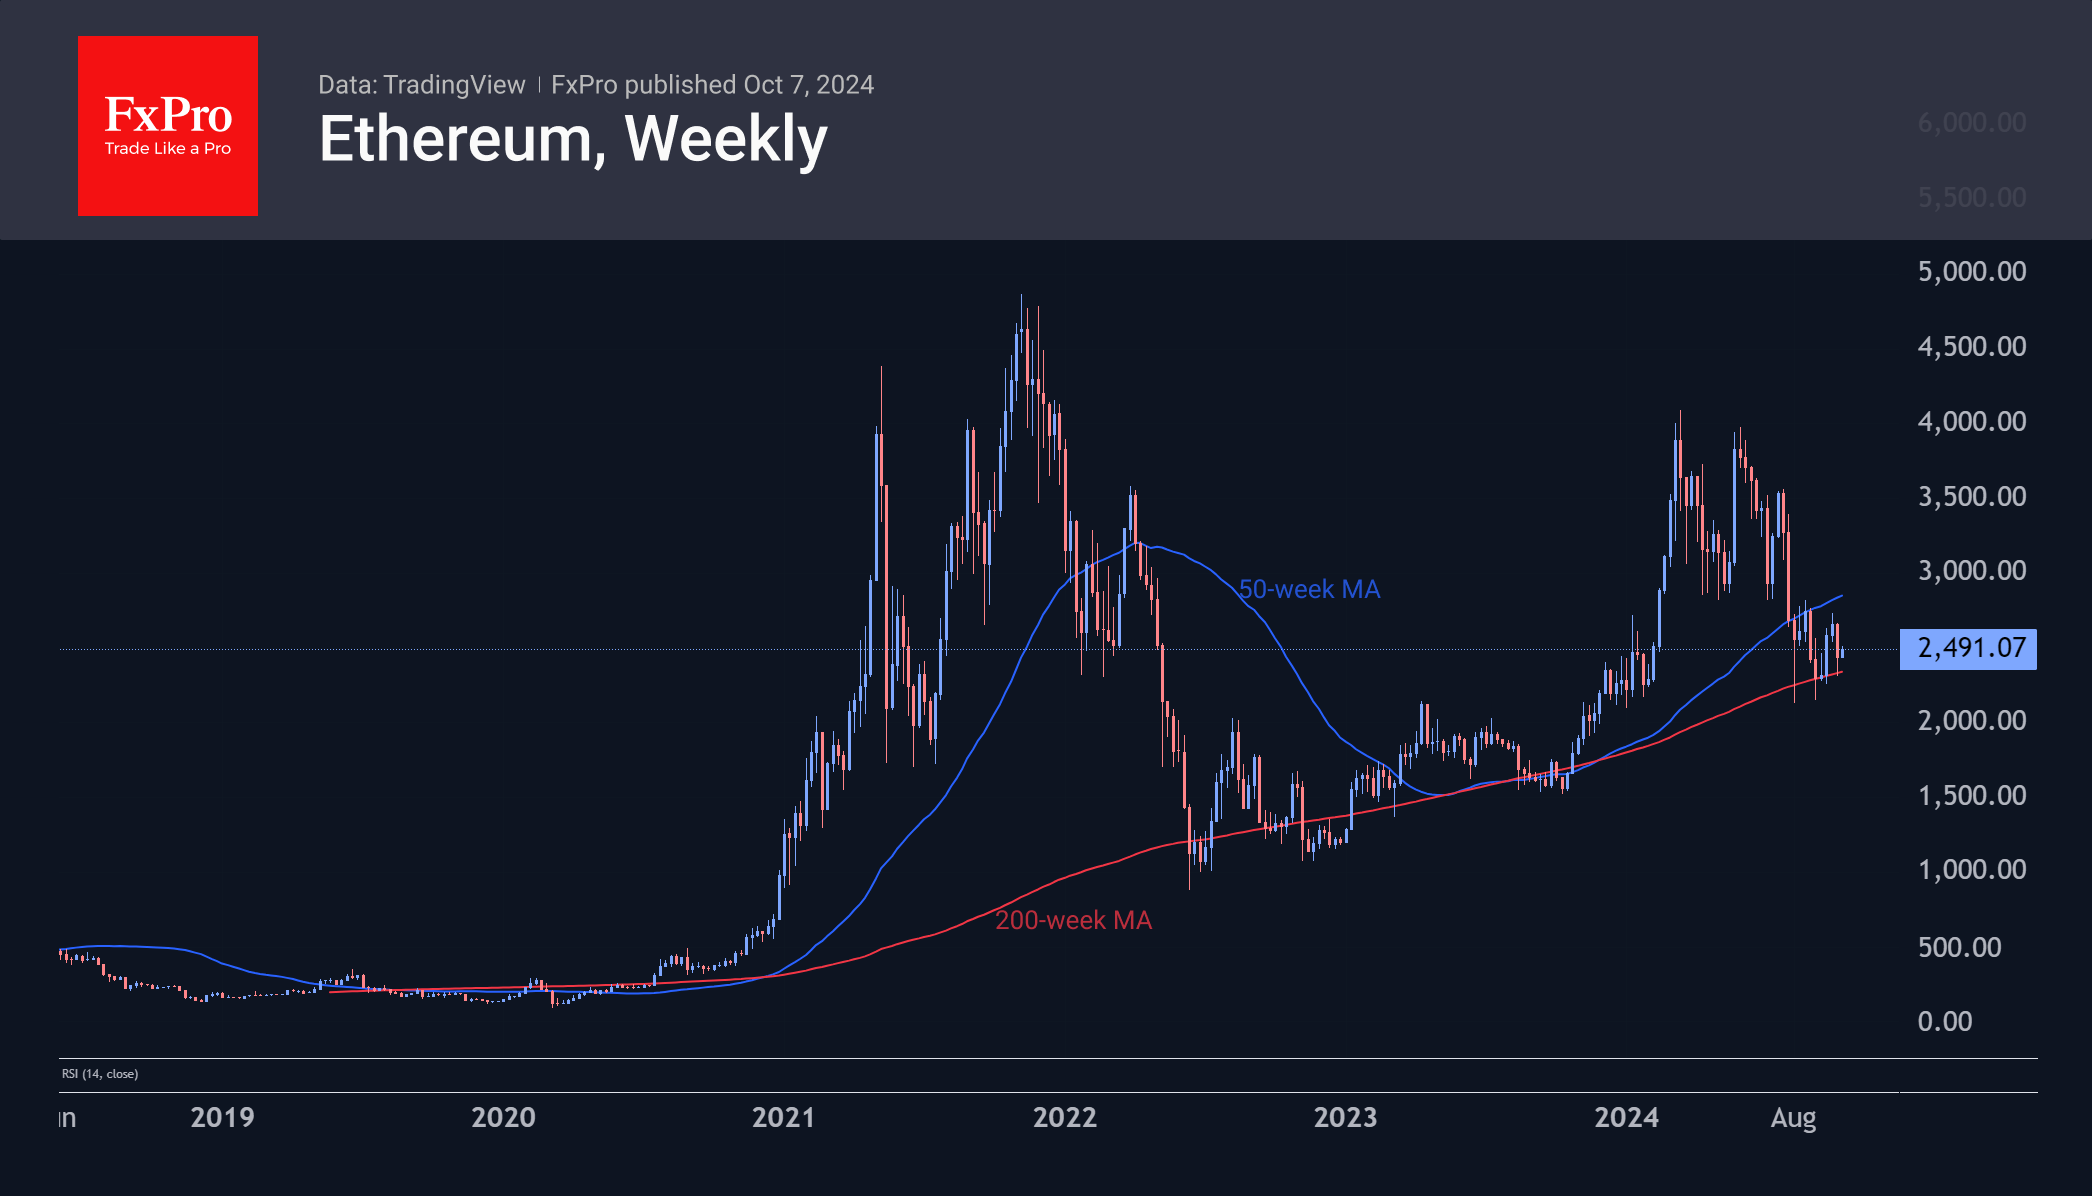
Ethereum is in a weaker position, approaching $2500 from below its 50-day average. Last week, the second-largest cryptocurrency found support at its 200-week moving average, as it has done so many times since mid-2012. That’s a good sign of accumulation by long-term buyers, but it’s sure to disappoint short- and medium-term speculators.
News background
The rise in Ethereum inflation to a two-year high of 0.74% p.a. calls into question the cryptocurrency’s deflationary prospects and its hard money status. This is the conclusion reached by Binance. The shift of network activity to L2 has led to a reduction in the number of transactions on the underlying and a decrease in the rate of coin burn.
According to SoSoValue, outflows from spot bitcoin-ETFs in the US last week totalled $301.5 million after three weeks of inflows. Cumulative inflows since BTC-ETFs were approved in January have fallen to $18.50bn. Ethereum-ETFs saw net outflows of $30.7m last week and have risen to $553.7m since product approval.
Binance continues to surrender its market-leading position. CCData calculated that Binance’s share of total trading volume on the CEX spot and derivatives markets fell to 36.6%, the worst since September 2020.
On 9 October, a new documentary will reveal the identity of Bitcoin creator Satoshi Nakamoto, who is hiding under a pseudonym. Politico admitted that the disclosure of Satoshi’s identity could shock the financial markets and affect the US presidential election.
Eurozone retail sales rise 0.2% mom in Aug, EU up 0.3% mom
Eurozone retail sales volume rose 0.2% mom in August, matched expectations. The increase was driven by a 0.2% rise in food, drinks, and tobacco sales, a 0.3% boost in non-food products (excluding automotive fuel), and a 1.1% jump in sales of automotive fuel from specialised stores.
In the wider EU, retail sales grew by 0.3% month-on-month. Luxembourg led the gains with a 5.3% increase in total retail trade volume, followed by Cyprus at 2.2% and Romania at 1.6%. On the downside, Denmark saw the steepest drop at -1.5%, while Slovakia, Bulgaria, and Croatia also posted declines in retail trade volume.
Eurozone Sentix rises to -13.8, expectations jump on ECB cut and China stimulus
Eurozone Sentix Investor Confidence edged up in October, rising from -15.4 to -13.8, slightly better than the forecast of -13.9. Current Situation Index saw its fourth consecutive decline, down from -22.5 to -23.3, its lowest level since December 2023. Expectations Index improved notably from -8.0 to -3.8.
Sentix remarked, "The downward economic trend has been halted for the time being," as Eurozone economy attempts to "find its way out of recession/stagnation". Investors are finding renewed optimism, not only due to ECB’s recent rate cuts but also the stimulus measures coming out of China.
The Sentix central bank theme barometer remains supportive, although it has pulled back from the higher levels seen last month. This more moderate outlook is tied to expectations that inflation declines will slow.
News of the Week (October 7—October 11): NZDUSD Market Overview
Major movement ahead in NZDUSD—time to prepare!
The NZDUSD pair, often referred to as the "Kiwi," represents the exchange rate between the New Zealand Dollar and the US Dollar. The New Zealand Dollar is influenced by various factors, including domestic economic data, commodity prices (especially dairy, as New Zealand is a major exporter), and monetary policy decisions by the Reserve Bank of New Zealand. On the other hand, the US Dollar is affected by US economic data such as employment figures, GDP growth, inflation reports, and interest rate decisions by the Federal Reserve.
New Zealand Interest Rate Decision, Oct 9, 3:00 (GMT+2)
The Reserve Bank of New Zealand is predicted to cut interest rates from 5.25% to 5.0%. If this forecast is true, it will likely weaken the New Zealand dollar, as lower interest rates will make the currency less attractive to investors, and the NZDUSD pair may decline. If the decision turns out to be better than expected, such as keeping the current rate, it will mean that the RBNZ sees the economy as stronger, which could lead to a rise in the NZDUSD pair.
However, if the RBNZ cuts the rate sharply by 0.5%, it could signal more economic problems, which would lead to a fall in the New Zealand dollar and a further decline in the NZDUSD.
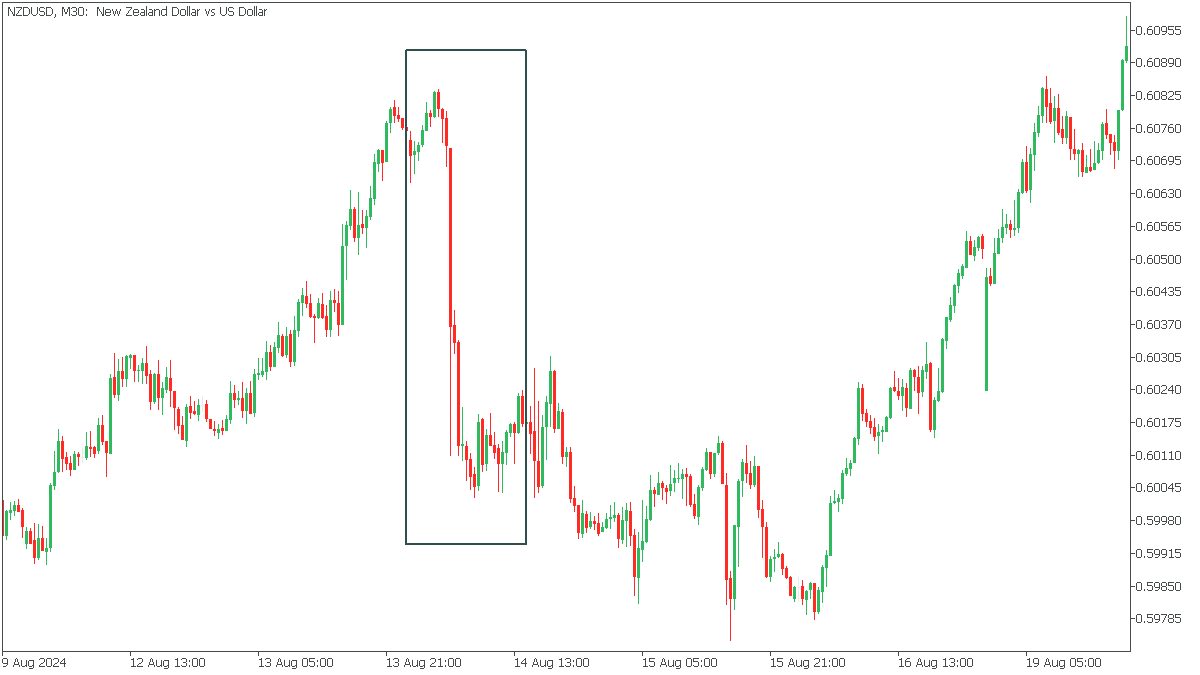
The last time the RBNZ cut the rate was on August 14, 2024, which was unexpected and caused the NZDUSD to fall hard!
US Consumer Price Index (CPI) MoM, Oct 10, 14:30 (GMT+2)
The September US Consumer Price Index (CPI) is forecast to slow down to 0.1%, compared to the previous reading of 0.2%. If the CPI meets this forecast, inflation will weaken, potentially reducing the likelihood of additional interest rate hikes by the Federal Reserve. This could weaken the US Dollar, leading to a rise in the NZDUSD pair.
However, if the inflation data is weaker than forecast, it could indicate a softer stance from the Fed, weakening the US Dollar and pushing the NZDUSD pair higher.
Conversely, if the CPI is stronger than expected, indicating rising inflation, this could lead to expectations of further Fed policy tightening and a longer continuation of the current rate, which could lead to a decline in the NZDUSD.
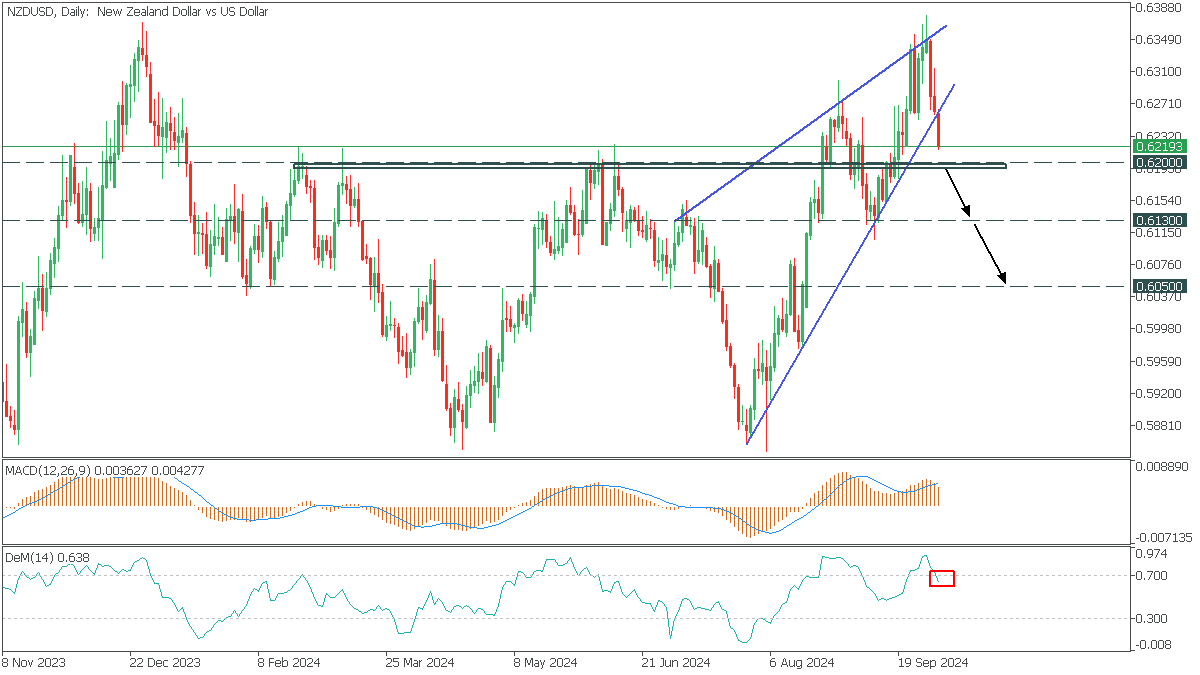
In the Daily timeframe, NZDUSD formed a rising channel pattern. The price broke the lower trend line, with the MACD signal line rising above the histogram and DeMarker coming out of the overbought zone.
NZDUSD can be expected to fall further on a breakdown below the support at 0.6200 with targets of 0.6130 and 0.6050.
EUR/USD Analysis: The Exchange Rate Falls Below 1.100
As shown in today's EUR/USD chart, the euro has dropped below the 1.100 level against the US dollar. This decline is partly due to Friday's strong US jobs report, which revealed:
→ the largest job growth in six months,
→ a decrease in the unemployment rate,
→ solid wage growth.
These factors suggest a resilient US economy and increase the likelihood of a "soft landing" following the inflation surge.
Technical analysis of the EUR/USD chart:
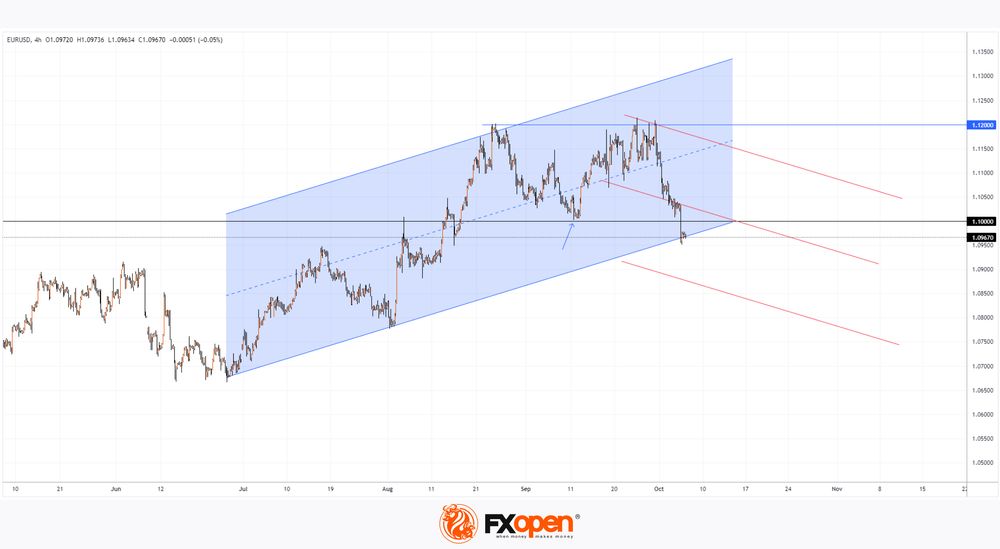
→ Since July, price movements have formed an ascending channel (shown in blue), but it now faces the immediate threat of a bearish breakout after sellers prevented the price from rising above 1.12.
→ The psychological level of 1.10 could shift from support (indicated by an arrow) to resistance.
Note that Friday's decline was rapid, and it’s possible that the downward momentum could continue into this week.
On the other hand, bulls still have a chance to regain control at the lower boundary of the channel (which could trigger a rebound). If they fail to do so, traders should be prepared for the emergence of a potential downward channel on the EUR/USD chart (its possible outline is shown by red lines).
Trade over 50 forex markets 24 hours a day with FXOpen. Take advantage of low commissions, deep liquidity, and spreads from 0.0 pips. Open your FXOpen account now or learn more about trading forex with FXOpen.
This article represents the opinion of the Companies operating under the FXOpen brand only. It is not to be construed as an offer, solicitation, or recommendation with respect to products and services provided by the Companies operating under the FXOpen brand, nor is it to be considered financial advice.
Dollar in Recovery Mode, Ahead of US CPI Data
This week could be very interesting, especially after last week’s volatility in the currency markets. The US dollar saw strong gains following speculation and comments from the Fed indicating they are not in a hurry to cut rates. On Friday, the Non-Farm Payrolls report came in very strong, adding to the reasons why the Fed may not cut as much as firstly thought. This week, the focus will be on inflation data, with some expecting inflation to start picking up again, particularly due to the Fed's dovish policy actions. Crude oil, one of the key indicators for inflation, has recently bottomed and turned higher as well, suggesting that inflation could be stickier around current levels, rather than heading straight toward 2%.
In terms of wave counts, the sharp move in the Dollar Index looks impulsive, indicating we could see another push higher in this current leg. More upside is expected after any retracement, with a key support zone around 101.50 to 101.80.
https://www.youtube.com/watch?v=z2A7Dwj1Yds
BoJ upgrades economic outlook for two regions, cautions on wage pressures for small firms
In its latest Regional Economic Report, BoC indicated that all nine regions in the country are "recovering moderately, picking up, or picking up moderately". Also, BoJ upgraded its economic assessments for the Hokuriku and Tokai regions, reflecting stronger local conditions.
In a separate release summarizing discussions among branch managers, BoJ noted that many business leaders increasingly believe wages need to continue rising into next year. This reflects growing wage pressure, which has been a key driver of consumption. Younger workers, in particular, have seen "fairly big pay hikes", boosting their spending power and supporting the broader economy.
However, the central bank cautioned that smaller and medium-sized businesses are struggling to generate sufficient profits to sustain wage hikes. BoJ emphasized that this situation "required vigilance."