Sample Category Title
SNB Decision: Conservative 25bps cut or aggressive 50bps?
SNB is set to announce its rate decision today, and the financial markets are rife with speculation. A significant gap has emerged between market expectations and those of economists regarding the magnitude of the rate cut. While a majority of economists are forecasting a 25 bps cut, market pricing suggests a nearly even split between the likelihood of a 25 bps cut and a more aggressive 50 bps reduction.
Several compelling arguments support the case for SNB to "front-load" its policy easing with a larger cut. First and foremost is the sharp decline in inflation. Last month, inflation dropped to 1.1%, well below the SNB's estimate of 1.5% for Q3, and far below the upper limit of its 0-2% target range. The government projects inflation to drop further to just 0.7% next year, suggesting that inflationary pressures are diminishing faster than anticipated. This may compel SNB to act decisively to counter deflationary risks.
Additionally, weak economic performance in the Eurozone, compounded by the strength of the Swiss Franc, is placing considerable strain on Swiss industries. The poor performance of Eurozone purchasing managers’ indices adds weight to the argument for a 50 bps cut to support economic activity in Switzerland.
However, SNB faces constraints. With policy rate currently at 1.25%, there is limited room for rate cuts before reaching zero. Some economists argue that SNB should hold back some policy measures for future flexibility.
According to a Bloomberg survey, only one out of 32 economists expects a 50 bps cut, while two predict no change. The remaining 29 economists anticipate a 25 bps reduction to bring the rate to 1.00%. Similarly, a Reuters poll found that 30 out of 32 economists expect a 25 bps cut, with one forecasting a 50 bps reduction and another expecting rates to hold steady. Looking ahead to the end of the year, opinions are split: 16 economists believe the rate will be at 1.00%, 15 predict it will drop to 0.75%, and one expects it to remain at 1.25%.
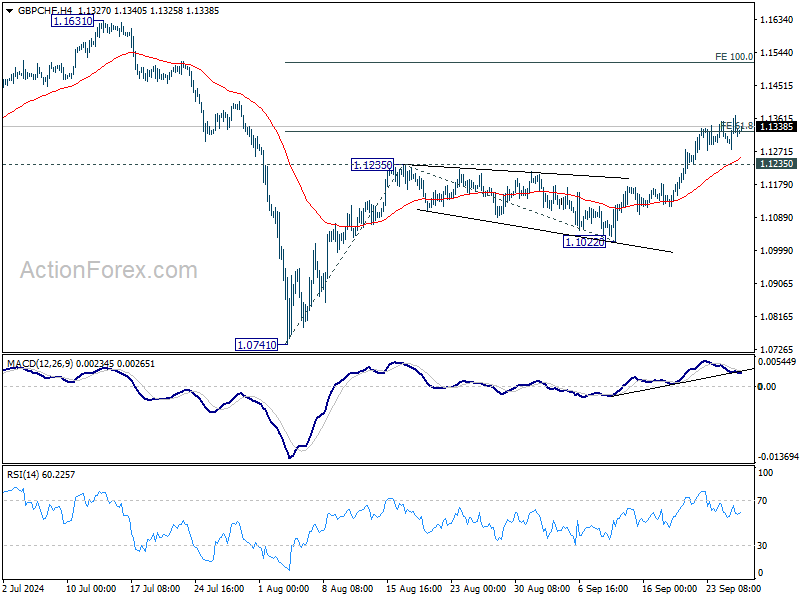
Technically, GBP/CHF's rally stalled after hitting 61.8% projection of 1.0741 to 1.1235 from 1.1022 at 1.1327. But further is expected as long as 1.1235 resistance turned support holds. Sustained trading above 1.1327 will pave the way to 100% projection at 1.1516 next.
BoJ minutes show divided views on rate hike timing
Minutes from BoJ's July meeting reveal a split among policymakers on the pace of future rate hikes. While BOJ raised its short-term interest rate to 0.25% by a 7-2 vote, differing opinions emerged on how quickly further increases should occur.
One member argued that if price trends follow the bank’s outlook, it would be “necessary” to proceed with further tightening. Another suggested that with inflation projected to reach its target by H2 of fiscal 2025, the policy rate should gradually rise toward the neutral rate, estimated at around 1%. This member cautioned against rapid rate increases and favored a “timely and gradual” approach to avoid shocks to the economy.
However, some members expressed concerns about the risks of moving too quickly. One warned that monetary policy normalization should not be an end in itself and urged caution in monitoring the risks tied to policy shifts. Another highlighted that inflation expectations were "not being anchored at 2 percent", suggesting the need to avoid excessive market speculation about future rate hikes.
The minutes also reflect "high uncertainties regarding the level of the neutral interest rate" about Japan’s neutral interest rate, given the long period without rate hikes. One member noted the difficulty of setting policy based on estimates of the neutral rate, calling for flexibility in adjusting policy based on evolving economic conditions.
GBP/USD Advances Toward 1.3500: Can Uptrend Continue?
Key Highlights
- GBP/USD started a fresh increase above the 1.3250 resistance.
- A key bullish trend line is forming with support at 1.3360 on the 4-hour chart.
- Gold price could continue to rise toward $2,700 or even $2,750.
- Bitcoin is consolidating gains above the $62,500 level.
GBP/USD Technical Analysis
The British Pound formed a base above 1.3200 against the US Dollar. GBP/USD started a fresh increase above the 1.3250 resistance zone.
Looking at the 4-hour chart, the pair climbed above the 1.3350 and 1.3400 levels. It even settled well above the 100 simple moving average (red, 4-hour) and the 200 simple moving average (green, 4-hour).
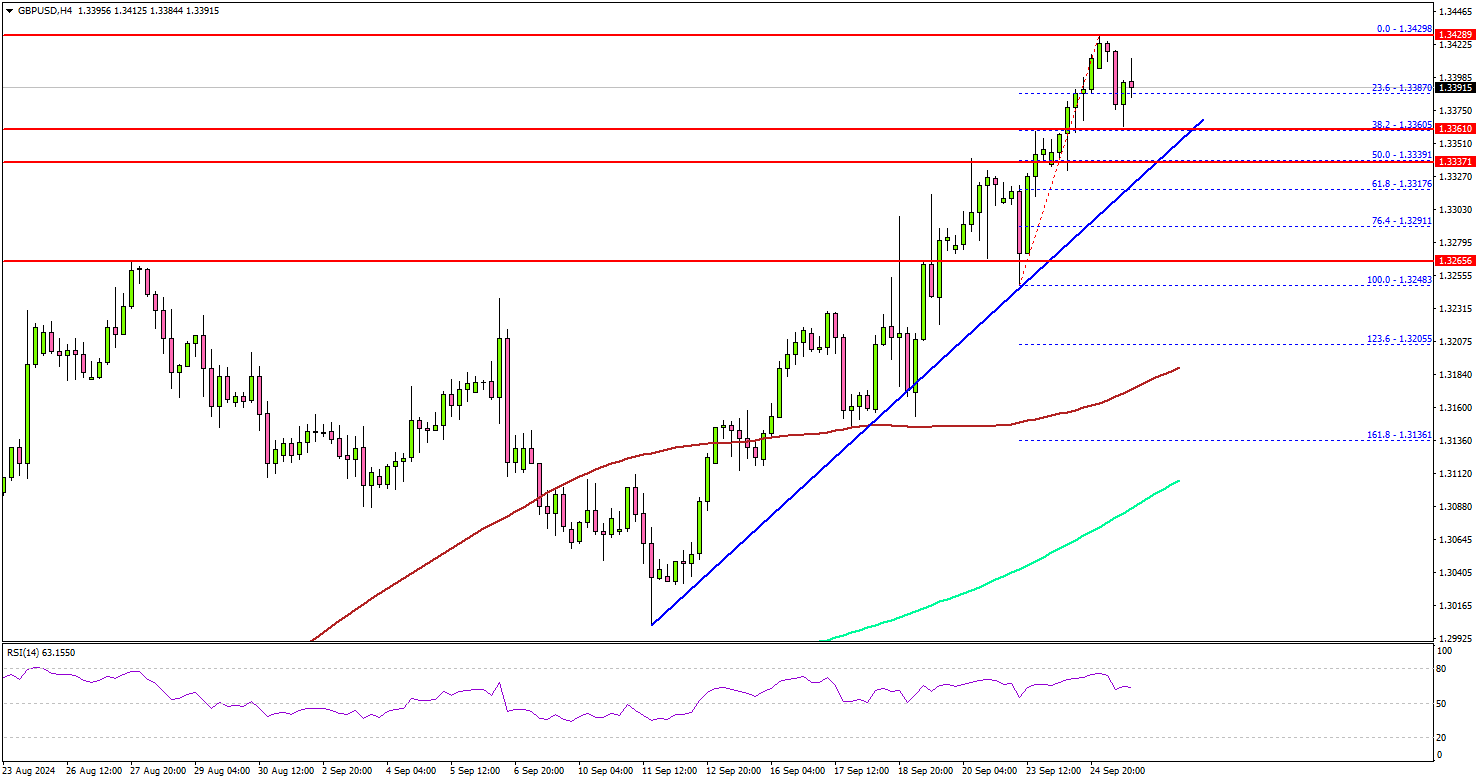
The pair even tested the 1.3430 level before a minor pullback. On the downside, immediate support sits near the 1.3360 level. There is also a key bullish trend line forming with support at 1.3360 on the same chart, below which the pair might test 1.3280.
The next key support sits near the 1.3200 level and the 100 simple moving average (red, 4-hour). Any more losses could send the pair toward the 1.3120 support zone.
On the upside, the pair could face hurdles near the 1.3430 zone. A clear move above the 1.3430 zone might set the pace for a move toward 1.3500. Any more gains might call for a test of the 1.3550 zone.
Looking at Bitcoin, the bulls are still in action, and they might soon aim for a move above the $64,500 resistance zone.
Upcoming Economic Events:
- US Gross Domestic Product for Q2 2024 (Preliminary) – Forecast 3% versus previous 3%.
- Federal Reserve Chair Jerome Powell’s speech.
Fed’s Kugler backs more rate cuts as focus shifts to employment
Fed Governor Adriana Kugler expressed "strong" support for last week's 50bps rate cut, signaling her inclination toward "additional cuts" in the federal funds rate.
In her speech overnight, Kugler emphasized that while the focus remains on bringing inflation down to the 2% target, attention should now begin to "shift attention to the maximum-employment side" Fed's dual mandate.
The labor market "remains resilient," she noted, but stressed that FOMC must now carefully balance its objectives. Fed should aim to maintain progress on disinflation while avoiding "unnecessary pain and weakness" in the broader economy.
AUDJPY: Bearish Short Term Sentiment
The AUDUSD pair slightly declined after hitting a new yearly high of 0.6900 during Wednesday’s US session. However, the overall outlook remains positive due to the Reserve Bank of Australia (RBA) indicating that interest rates will stay steady through the year-end. The Australian Dollar is also benefiting from China’s recent stimulus measures aimed at boosting household spending and the real estate market. Meanwhile, the US Dollar has weakened, with the Dollar Index (DXY) dropping to 100.20, its lowest level in over a year, as markets expect the Federal Reserve to cut rates again in November. If AUD/USD breaks above 0.6910, it could push towards the next target of 0.7000.
AUDJPY – D1 Timeframe
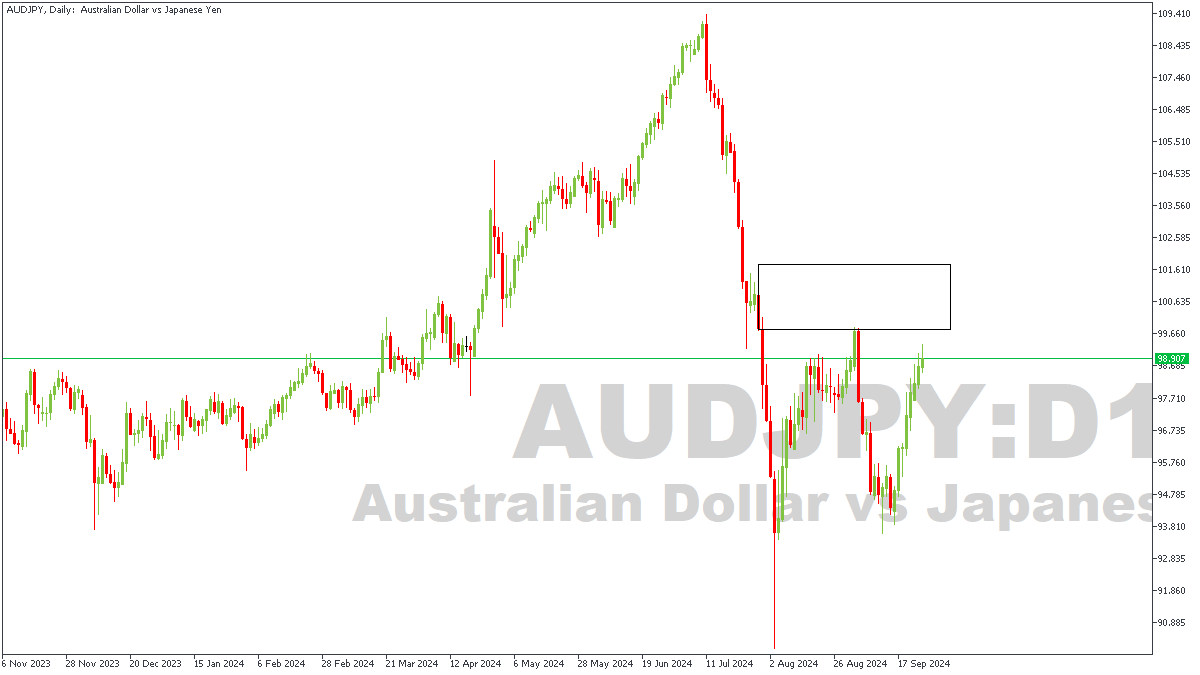
The Daily timeframe of AUDJPY shows price currently retracing into the supply zone, after undergoing a major rejection at the supply zone initially. From the daily timeframe, the short high before the rejection serves as a shoulder for a possible head-and-shoulder pattern; or a SBR pattern, if you will.
AUDJPY – H4 Timeframe
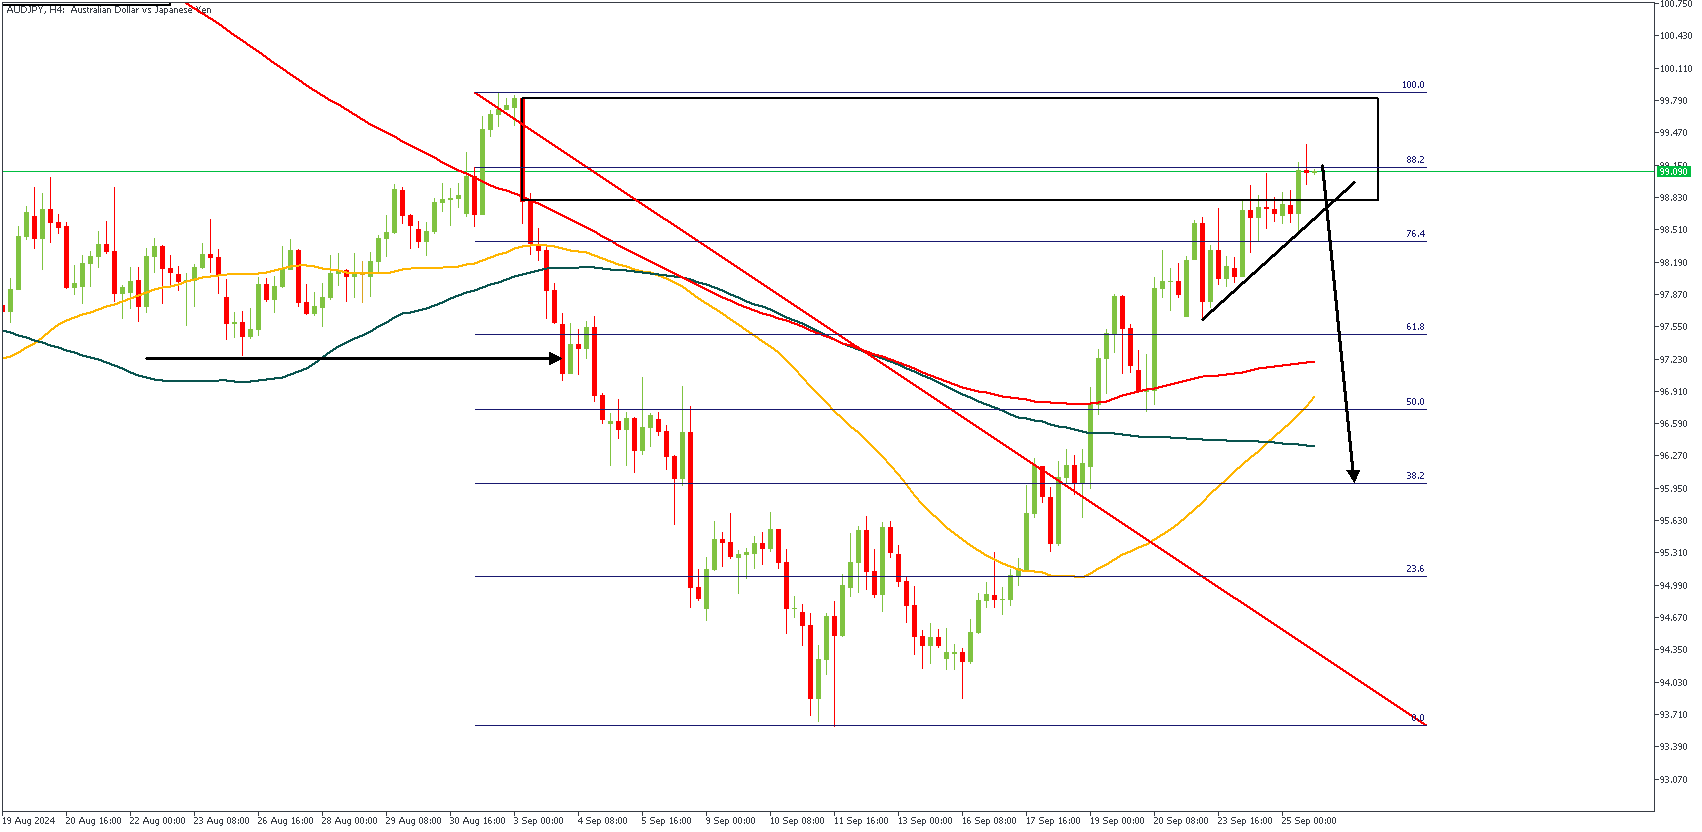
On the 4-hours timeframe of AUDJPY, we can see price currently trading above a trendline support whilst within the supply zone. The break below the trendline support will provide the necessary confirmation of the bearish sentiment since the 88% of the Fibonacci retracement is also within the current vicinity of the price action, serving as confluence for entry.
Analyst’s Expectations:
- Direction: Bearish
- Target: 95.950
- Invalidation: 99.970
CADJPY Wave Analysis
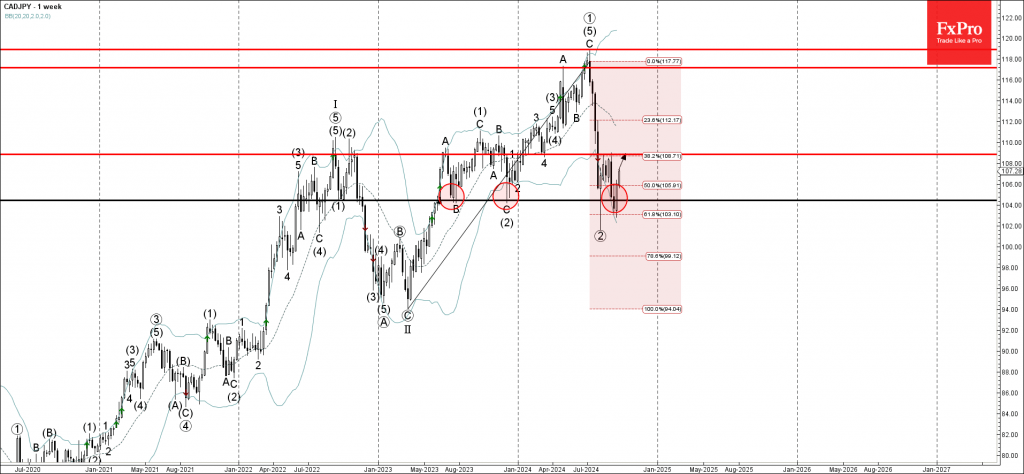
- CADJPY reversed from support area
- Likely to rise to resistance level 108.85
CADJPY currency pair earlier reversed up with the weekly Bullish Engulfing from the support area located between the pivotal resistance level 104.50 (which has been reversing the pair from the middle of August, and the lower weekly Bollinger Band.
This support area was further strengthened by the 61.8% Fibonacci correction of the upward impulse from the start of 2023.
Given the clear weekly uptrend and the continued Canadian dollar bullishness seen across the FX markets, CADJPY currency pair can be expected to rise further to the next resistance level 108.85.
EURUSD Wave Analysis
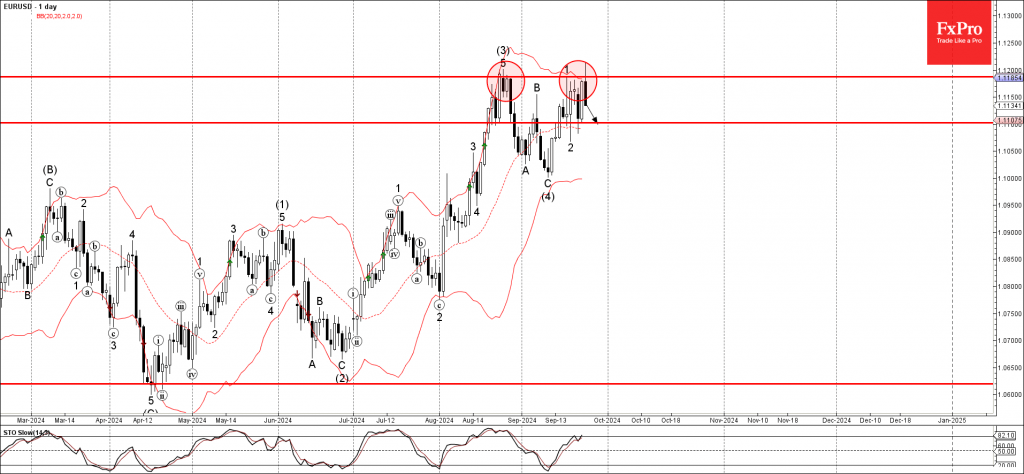
- EURUSD reversed from resistance area
- Likely to fall to support level 1.1100
EURUSD currency pair recently reversed down from the resistance area between the pivotal resistance level 1.1185 (which has been reversing the pair from August, stopped earlier impulse waves 5 and 1) and the upper daily Bollinger Band.
The downward reversal from this resistance area is likely to form the daily Japanese candlesticks reversal pattern Dark Cloud Cover – if the pair closes today near the current levels.
Given the strength of the resistance level 1.1185, bearish divergence on the daily Stochastic and the moderate US bullishness seen today, EURUSD can be expected to fall further to the next support level 1.1100.
Soft-Landing, or No Soft-Landing, That is the Question: Part V
Part V: The FOMC, Blue Chip or the New Framework: Predicting the Fed Funds Rate
Summary
- This installment presents a new framework to predict the level of the fed funds rate two quarters out.
- We compare our framework’s fed funds forecast with the FOMC and Blue Chip forecasts to decide who is more accurate at predicting the near-term fed funds rate.
- The framework effectively predicted the turning points in the fed funds rate in the simulation analysis.
- The FOMC started providing the SEP in 2012; therefore, we employ the 2012-2024 period to identify whose fed funds rate predictions are the most accurate.
- Blue Chip has a higher perfect forecast accuracy rate (67%) than the FOMC (58%).
- The FOMC’s average forecast error is slightly lower (21 bps) than the Blue Chip consensus average error (29 bps).
- Both the FOMC's SEP and the Blue Chip consensus missed the 2019 rate cuts.
- With the September rate cut in the books and high expectations of more rate cuts in the remaining meetings of 2024, both the FOMC and the Blue Chip forecasts suffer a lower average forecast accuracy and a higher average forecast error.
- Given the historical accuracy of our approach, we believe our framework would be helpful for decision makers to improve their forecast accuracy.
- We also propose that instead of following the traditional approach of forecasting the near-term fed funds rate, forecasters should consider predicting policy pivots in addition to the fed funds rate.
Why Is Accurately Predicting the Near-Term Fed Funds Rate Important?
This installment presents a new framework to predict the two-quarters-out level of the fed funds rate. We compare our framework’s fed funds forecast with the FOMC and Blue Chip's forecasts to examine who is more accurate at predicting the near-term fed funds rate.
Former Chairman of the Federal Reserve Ben Bernanke stated that central bankers utilize forecasts in policymaking and as policy communication tools.1 Researchers suggested that the FOMC forecasts may influence private sector forecasts.2 For example, the FOMC employs its fed funds forecast (along with its other forecasts) to communicate the near-term policy stance. In the short run, significant changes in the forecast would send undesirable signals and raise questions about the accuracy of the fed funds forecast. Therefore, in our view, accurately predicting the near-term path of the fed funds rate is vital for effective policymaking as well as policy communications.
A New Framework To Predict Two-Quarters-Out Fed Funds Rate
We present a new approach to predict the fed funds rate two quarters out (up to four FOMC meetings ahead). Part III of the series presented four-quarters-out probabilities of the three growth scenarios of soft-landing, stagflation and recession. We employ those probabilities as predictors and use the fed funds rate as our target variable. Given the volatile nature of the economy during the post-pandemic era, a one-year-out prediction for the fed funds rate would likely have lower accuracy, as the rapidly changing nature of potential risks would dictate a faster response from the FOMC, all else equal. Following Clarida et al. (1999), we include a lag of fed funds rates as a right-hand-side variable to capture the current policy stance.3 Clarida et al. (1999) suggested that the current level of the fed funds rate would help to determine its next phase. We utilize a quarterly dataset for the 1988-2024:Q2 period for our analysis.
Figure 1 shows the actual versus the forecasted fed funds rate. The framework effectively predicted the turning points in the fed funds rate during the 1988-2024:Q2 period. An observation from our analysis is that, in recent years, the projected fed funds rate peaked in Q4-2023 and maintained the peak in Q1-2024, which is consistent with the probabilities of the three growth scenarios. As stated in Part III, all three probabilities were elevated, but the soft-landing probability was higher than the probabilities of stagflation and recession. Moreover, the last three quarters (Q4-2023:Q2-2024) noted an upward trend in the soft-landing probability while the other two growth scenario probabilities were tending downward. Our framework estimated the fed funds rate to be 5.33% in Q2-2024. As this was a decline to last quarter's estimate of 5.40%, our framework suggested a rate cut would occur. In other words, the framework suggested that the easing cycle would start in the next two quarters.
Figure 1
Source: Federal Reserve Board and Wells Fargo Economics
Who’s Most Accurate at Predicting the Fed Funds Rates: The FOMC, Blue Chip or the New Framework?
The FOMC and Blue Chip consensus also forecast the fed funds rate, and that gives us an opportunity to compare our framework-based fed funds rate with those predictions. The FOMC started providing the SEP in 2012; therefore, we employ the 2012-2024 period to identify whose fed funds rate predictions are the most accurate. Additionally, the SEP provides year-end forecasts—the June 2024 SEP suggested that the fed funds rate will be at 5.25% (upper bound) by the end of 2024. To construct a six-months-out fed funds forecast for the FOMC, we utilize the June SEP forecast as a proxy for the year-end.
By the same token, we utilize Blue Chip consensus’ June forecast for the year-end. The June Blue Chip consensus suggests that the target fed funds rate would end 2024 at 5.00%. Table 1 shows the actual fed funds rate, the forecasts based on the new framework, the FOMC projections and the forecasts from the Blue Chip consensus. For example, the actual fed funds rate for 2015 year-end was 0.50%, the FOMC’s projection was 0.75% (June 2015 SEP), the Blue Chip consensus forecasted 0.50% (June 2015) and the new framework predicted 0.37%.
We readily acknowledge that both the FOMC and Blue Chip fed funds forecasts are actual real-time and the framework’s projections are simulated real-time. Therefore, in the first phase, we compare the FOMC and Blue Chip forecasts to determine which is more accurate. The next phase involves analyzing our framework’s projections to determine whether our approach would help decision makers improve their forecast accuracy.
Table 1
Source: Federal Reserve Board, Blue Chip Financial and Wells Fargo Economics
Although there are 13 year-end fed funds rate forecasts in the 2012-2024 period, we do not know the actual 2024-year end fed funds rate at present, so we thereby have 12 observations. As seen in Table 2, the Blue Chip consensus has a perfect forecast (when the actual fed funds rate equals the Blue Chip forecast in Table 1) accuracy rate of 67% (eight out of 12 years). The FOMC’s perfect forecast accuracy rate is only 58% (seven out of 12 years). The FOMC’s average forecast error (actual minus forecast; we employ absolute values to account for the under/over forecast) is slightly lower at 21 bps than the Blue Chip average error (29 bps). The smallest absolute change in the federal funds rate during the 2012-2024 period was 25 bps. The FOMC's error was 4 bps lower than this, while Blue Chip's error was 4 bps higher.
Both the FOMC’s SEP and the Blue Chip consensus missed the 2019 rate cuts. The June 2019 SEP predicted the federal funds rate would be 2.50% (no rate cut) at 2019 year-end, and Blue Chip predicted the same in June 2019. Both forecasts also predicted more rate hikes in the second half of 2022 but missed the magnitude of the tightening cycle: the actual 2022 year-end fed funds rate was 4.50%, but the June 2022 SEP predicted 3.50% and the June 2022 Blue Chip consensus predicted 2.50%. A similar conclusion is noted for 2023-year end—both forecasts were unable to accurately predict the year-end fed funds rate.
For 2024, the June SEP suggested 5.25% as the year-end rate, while the June Blue Chip predicted 5.00%. However, during its September meeting, the FOMC cut rates by 50 bps, bringing the upper bound of the target fed funds rate to 5.00%. Given financial market participants' high expectations (including our own forecast) of more rate cuts at the November and December FOMC meetings (the fed funds may end 2024 at 4.50%), a repeat of 2022 and 2023 is more likely than not, and both the FOMC and Blue Chip consensus are likely to miss the 2024-year end fed funds rate target. Therefore, assuming the fed funds rate is at 4.50% by the end of 2024, both the FOMC and the Blue Chip consensus would experience a lower forecast accuracy than the present level. Particularly, the FOMC’s directional accuracy would drop to 54% from 58% and the Blue Chip consensus directional accuracy would be 62% (67% at present). The FOMC’s average forecast error would uptick to 25 bps (21 bps at present) and the Blue Chip consensus average error would be 31 bps (29 bps at present).
Our framework’s six-months-out fed funds forecast differs in two major ways from the FOMC's SEP and the Blue Chip consensus: (a) our framework’s forecasts are simulated, not real time and (b) the framework’s prediction may not exactly match with the actual numbers, as the regression predicts a continuous variable (i.e., one that can take any value in the range). The FOMC, on the other hand, changes the fed funds rate by a minimum amount of 25 bps (at least in the post-1990 era). However, we believe the toolkit would be helpful for decision makers to shed light on the potential pace and duration of a policy stance.
For example, as seen in Table 1, the FOMC raised the fed funds rate in December 2015, which was the first rate hike in the post-Great Recession era. All three forecasts were able to predict the rate hike. However, the FOMC forecasted two rate hikes (assuming a 25 bps rate hike each time), and its 2015 year-end forecast was 0.75%. Although the June Blue Chip consensus forecasted one rate hike (0.50% as the 2015 year-end forecast), the May consensus suggested 1.00% as the 2015 year-end rate (three rate hikes in the second half of 2015). Our framework, on the other hand, never suggested more than one rate hike in 2015, and the highest prediction value was 0.43% (Q4-2015). Another observation we want to share is for the 2019 period. The December 2018 rate hike (which brought the fed funds rate to 2.50%) concluded the rate hike cycle of the post-Great Recession era, and the July 2019 rate cut started the rate cut cycle, where the fed funds rate ended 2019 at 1.75%. However, the June 2019 SEP forecasted the fed funds rate would be 2.50% for 2019 year-end (no rate cut), as did the June Blue Chip consensus. Our framework showed a declining trend in the fed funds rate during the first half of 2019 (our forecast peaked at 2.45% for Q4-2018 and then dropped to 2.38% by Q2-2019). In hindsight, the declining trend in the forecasted fed funds rate may have cautioned decision makers about an upcoming potential rate cut.
Recently, our framework's projected fed funds rate peaked in Q4-2023 and maintained that level in Q1-2024, which is consistent with the probabilities of the three growth scenarios. That is, the last three quarters (Q4-2023:Q2-2024) noted an upward trend in the soft-landing probability while the other two growth scenario probabilities were trending downward. The Q2-2024 estimated fed funds rate is 5.33% (a decline compared to the last quarter prediction of 5.40%), which suggested a rate cut would be in the picture. Therefore, we believe, given the historical accuracy of our toolkit, our framework would help decision makers improve their forecast accuracy.
Table 2
Source: Federal Reserve Board, Blue Chip Financial and Wells Fargo Economics
Prediction Accuracy Is Crucial for Effective Policymaking and Policy Communications
Bernanke (2024) reviewed the forecasting performance of seven central banks including the Federal Reserve, the Bank of England and the ECB. The accuracy of the central bankers’ forecasts (particularly the one-year-out inflation forecasts) declined significantly in the post-pandemic era. Moreover, Bernanke (2024) outlined some of the recommendations to design effective policy decisions and policy communications, placing emphasis on accurately identifying and quantifying risks to the outlook.
This series proposed a new framework that would help decision makers effectively quantify potential risks to the economic outlook by moving away from the traditional approach of just forecasting recession probability and/or the GDP growth rate for the near future. We suggest characterizing the growth outlook into three different regimes of soft-landing, stagflation and recession. Moreover, one-year-out probabilities of those three scenarios would shed light on the potential economic risks in the near future.
We also propose that instead of following the traditional approach of forecasting the near-term fed funds rate, an effective toolkit should predict policy pivots in addition to the fed funds forecast. By predicting a policy pivot, decision makers would be able to identify the potential duration of a policy stance. The fed funds forecast would complement the pivot prediction by identifying the appropriate pace of the policy cycle.
We are planning to regularly update our toolkit to gauge the potential duration and pace of the current easing cycle, and we’ll publish those results for the foreseeable future. In addition, we are planning to expand applications of the three growth probabilities to predict changes in different sectors of the economic and financial world.
Endnotes
1 – Bernanke, Ben. "Forecasting for Monetary Policy Making and Communication at the Bank of England: A Review." Bank of England. April 12, 2024.
2 – Hubert, Paul. (2014). "FOMC Forecasts as a Focal Point for Private Expectations." Journal of Money, Credit and Banking, Vol 46, No 7.
3 – Clarida, R., Gali, J., and Gertler, M. (1999). "The Science of Monetary Policy: A New Keynesian Perspective." Journal of Economic Literature, Vol XXXVII (December), pp 1661-1707.
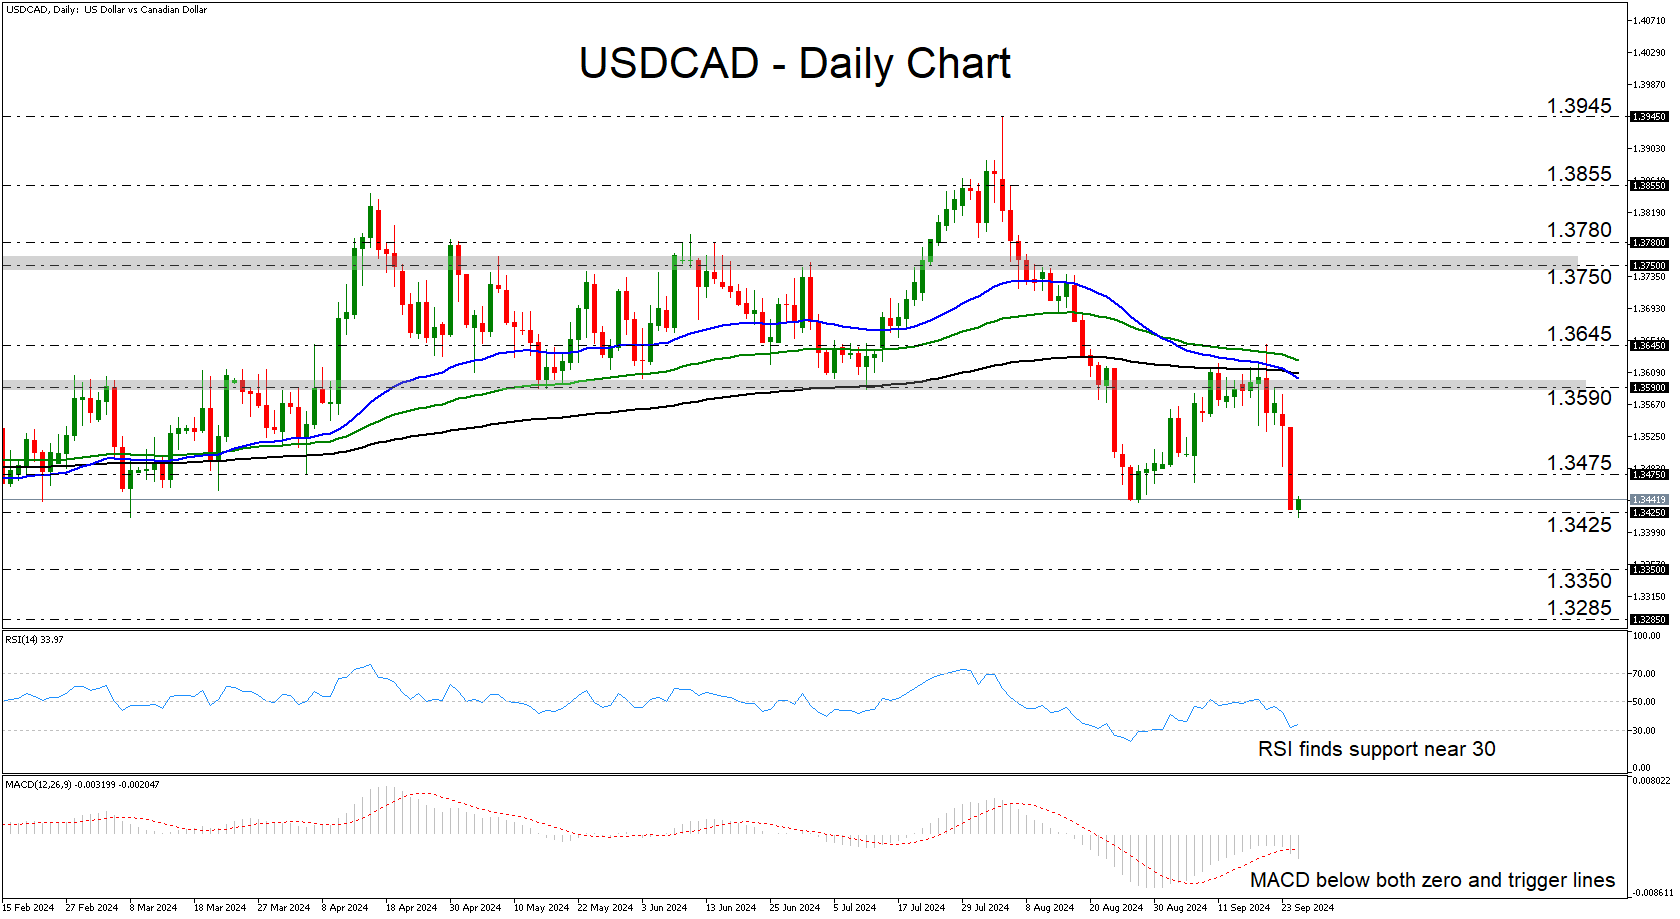
USDCAD Tumbles and Hits Support Near 1.3425
- USDCAD falls sharply, accelerating prevailing retreat
- Both the RSI and the MACD detect bearish momentum
- A break below 1.3425 could extend the fall towards 1.3350
- For the outlook to brighten, a rebound above 1.3645 may be needed
USDCAD fell sharply on Tuesday, extending the retreat that started on Thursday after the pair hit resistance at 1.3645, slightly above the lower bound of the sideways range that contained most of the price action between April and August.
Yesterday’s tumble was paused today near the 1.3425 support, which stopped the pair from falling further back in February and March, but with no signs of a bullish reversal, the likelihood of the bears staying in the driver’s seat remains high.
Both the RSI and the MACD are detecting strong downside momentum. The former is well below 50, near its 30 line, though it has rebounded from near 30. The MCAD is below both its zero and trigger lines, pointing down. The RSI’s rebound implies that a minor rebound may be on the cards before the next leg south.
If so, the bears may be tempted to recharge from near the 1.3475 level and push the action below 1.3425, This could pave the way towards the 1.3350 zone, marked by the low of January 31, the break of which could allow extensions towards the low of January 5, at around 1.3285.
For the outlook to start changing to bullish, USDCAD may need to recover all the way up to the 1.3645 area. A break higher will confirm a higher high and may encourage advances towards the 1.3750 zone, which acted as the upper boundary of the aforementioned sideways range.
To sum up, USDCAD fell sharply yesterday, and although it paused near a key support zone, the technical picture suggests that the bears may stay in control for a while longer.