Sample Category Title
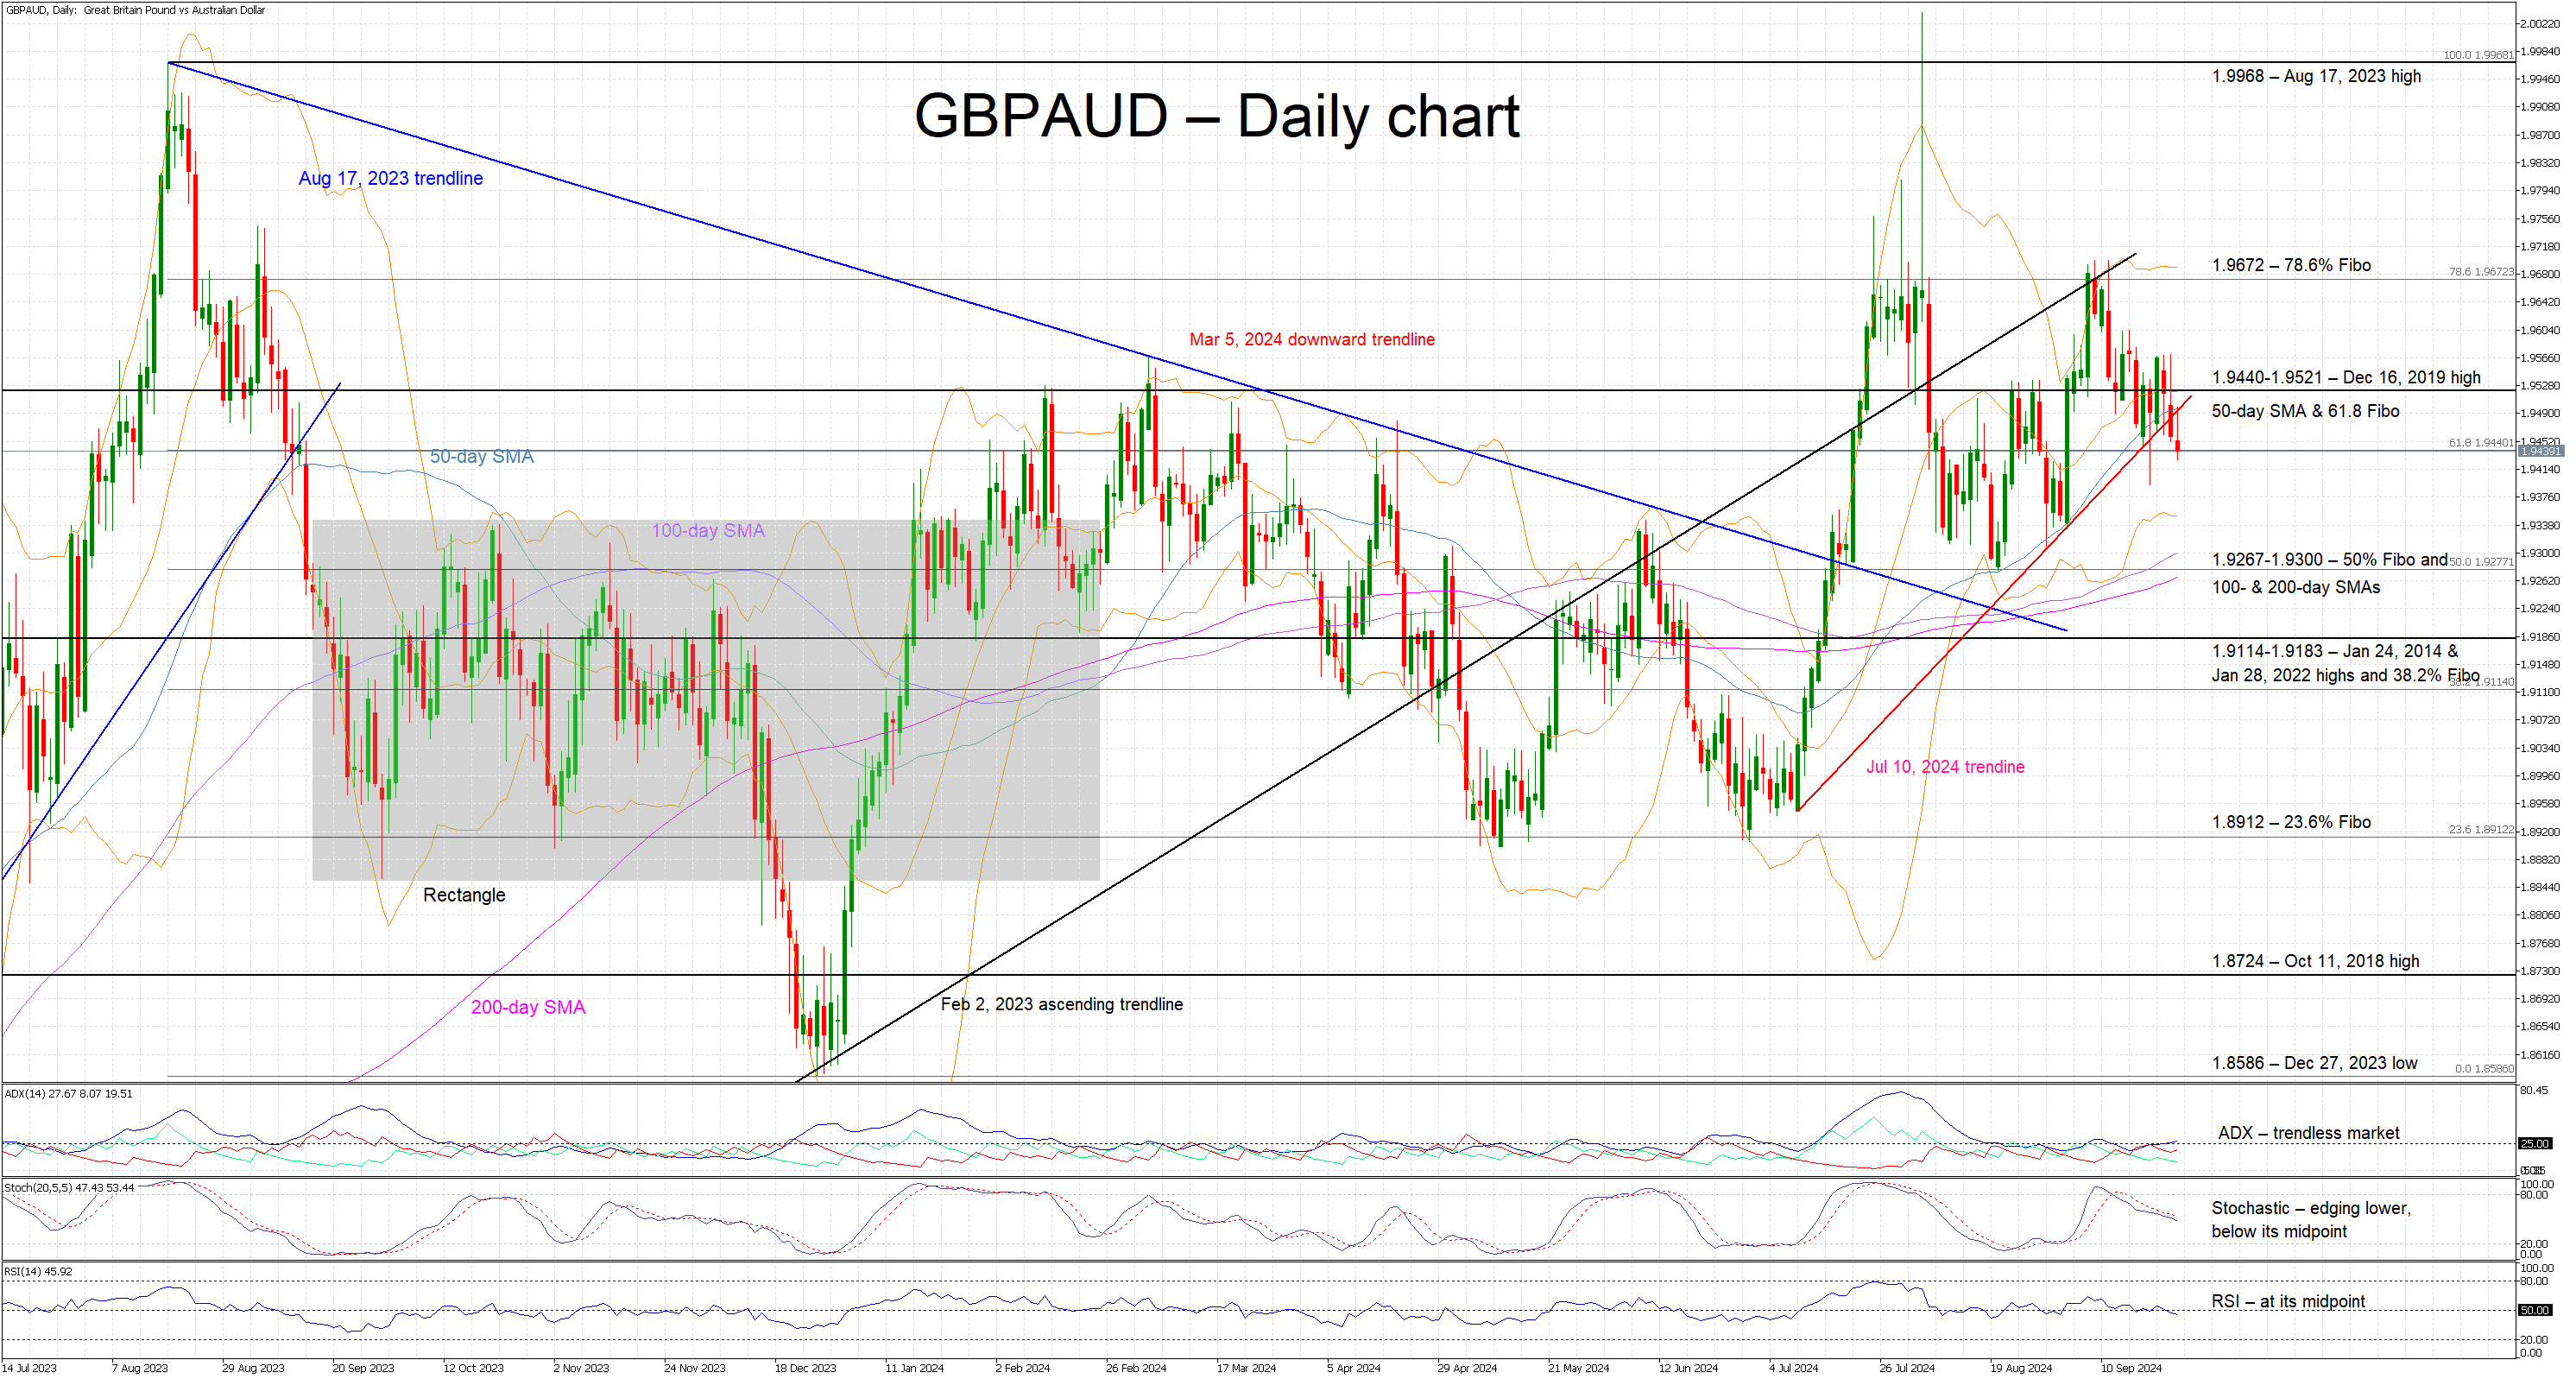
GBPAUD Correction Might Have Legs
- GBPAUD in the red again today
- Both BoE and RBA have refrained from cutting rates
- Momentum indicators are inconclusive at this stage
GBPAUD is trading slightly lower today, within the busy 1.9440-1.9521 area, and close to the recent peak of 1.9699. GBPAUD has managed to break below both the July 10, 2024 trendline and the 50-day simple moving average (SMA), but a stronger correction is needed to validate this move. Interestingly, these two currencies are among the strongest ones in the FX space in September, as their respective central banks have refrained from following the Fed into cutting rates.
In the meantime, momentum indicators are mostly mixed. More specifically, the Average Directional Movement Index (ADX) is tentatively trying to climb to its midpoint and signal the presence of a weak bearish trend in GBPAUD. Similarly, the RSI continues to aimlessly hover around its midpoint. Additionally, the stochastic oscillator is edging lower, a tad below its midpoint, but appears unable to stage a protracted correction.
Should the bulls remain confident, they could try to lead GBPAUD above the busy 1.9440-1.9521 area that is populated by the December 16, 2019 high, the 50-day SMA and the 61.8% Fibonacci retracement of the August 17, 2023-December 27, 2023 downtrend. If successful, they could then have a go at overcoming the 78.6% Fibonacci retracement at 1.9672 and record a higher high.
On the flip side, the bears would welcome a series of red candles and a successful break below the 1.9440-1.9521 area. They could then come up against the busy 1.9267-1.9300 area, which is defined by the 50% Fibonacci retracement and the 100- and 200-day SMAs. A move below this region could reverse the recent bullish momentum and allow the bears to test the support set by the 1.9114-1.9183 area.
To conclude, GBPAUD is edging lower but some key support levels have to be broken for the bears to regain the upper hand.
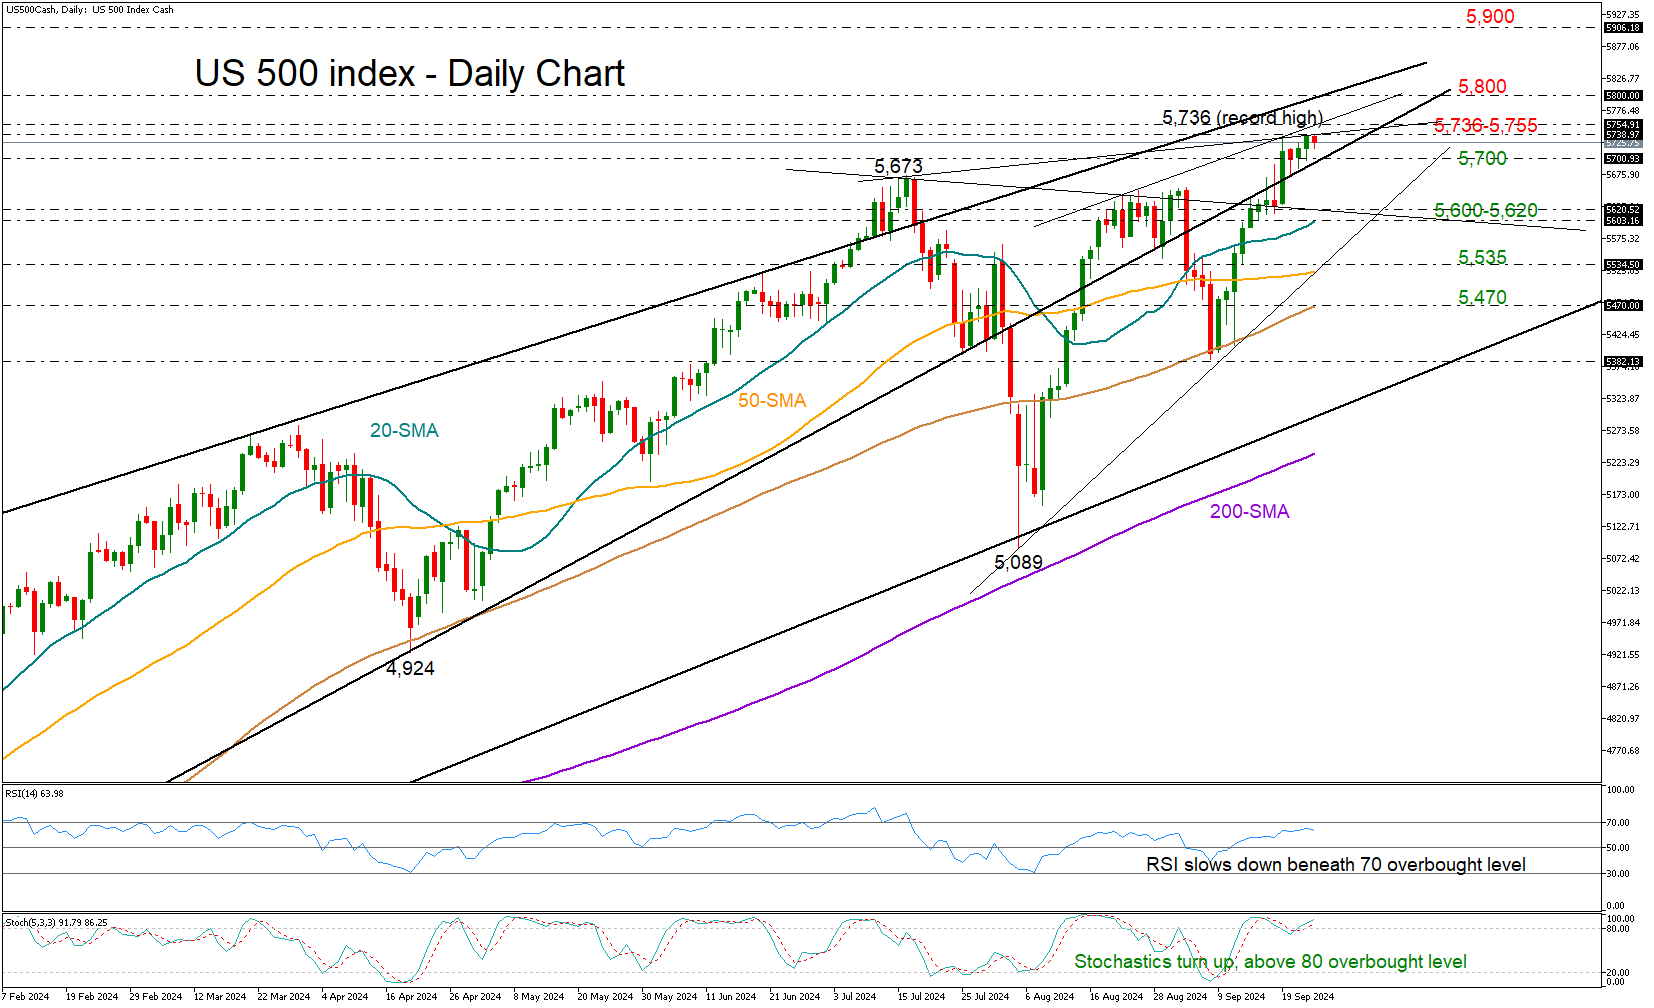
Another Record for the US 500 Index
- US 500 stock index hits another all-time high
- Technical signals mixed; more buying awaited above 5,750
The US 500 stock index restarted its positive trend on Tuesday, inching up to a record high of 5,736 after keeping its foot on the rising almost one-year-old constraining line at 5,674.
Mixed technical signals are observed, with the RSI slightly below its 70 overbought level and the stochastic oscillator returning to the overbought region with a positive slope, indicating the possibility of additional momentum.
In the four-hour chart, the index seems to be forming an ascending triangle at the top of the uptrend, which is usually considered a signal of bullish continuation. Once the price crosses above its all-time high of 5,736 and the resistance line from August at 5,755, the next destination could be the 5,800 psychological mark, where the crucial resistance line that connects the highs from July 2023 is placed. Should the 5,900 mark give way too, the door will open for the 6,000 round level.
In the opposite case that the price closes below 5,700, there is potential for a sharp decline towards the falling constraining line near 5,620 and 20-day simple moving average (SMA) at 5,600. Falling lower, the price could seek shelter around the tentative support trendline and the 50-day SMA at 5,535 or near the 100-day SMA at 5,470.
Summing up, the US 500 index could further stretch its upward pattern in uncharted territory, with the confirmation signal likely coming above 5,755.
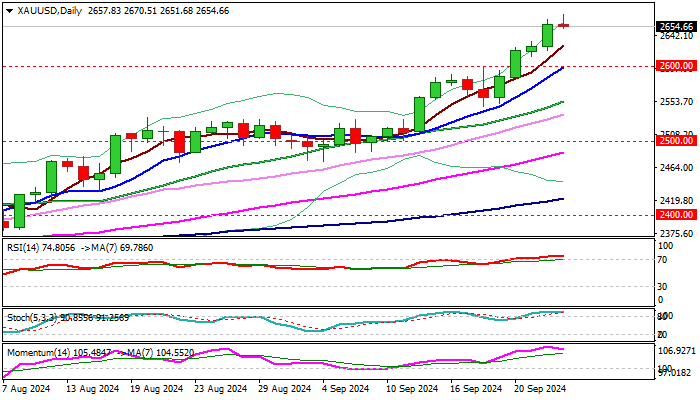
Gold Outlook: Bulls Take a Breather, Dips Likely to Be Shallow and Find Ground Above Key 2,600 Support
Gold edged lower from new record high ($2670) early Wednesday, taking a breather after advancing 1.10% on Tuesday, lifted by weaker dollar on expectations that the Fed may continue with stronger rate cuts.
People’s Bank of China decision to cut rates, prompted Chinese investors into safe haven, adding support to metal’s price.
Strongly overbought daily studies and fading bullish momentum, generate initial signal of pullback, with similar picture seen on 4-hr chart however, overall strong bullish structure and supportive fundamentals point to mild correction before bulls regain traction for attack at initial target at $2675 (Fibo 238.2% projection of the upleg from $2286) and psychological $2700 barrier.
Dips were so far contained above initial supports at $2650/45, guarding $2637 (55HMA) and $2623 (hourly higher base).
Potential deeper pullback should find ground above key near-term support at $2600 (psychological / 10DMA) to keep larger bulls in play.
Res: 2670; 2675; 2700; 2714.
Sup: 2650; 2645; 2637; 2623.
Crypto Market Tests One-Month High
Market Picture
The crypto market rose 1.2% in 24 hours to $2.25 trillion, approaching the highs set exactly one month ago. New highs could attract more buyers and signal a break in the multi-month downtrend. The sentiment index rose to 59, the highest since late July, which looks like the optimal range for further gains. It is far from extreme greed, which signals overbought conditions, and fear-selling is behind us.
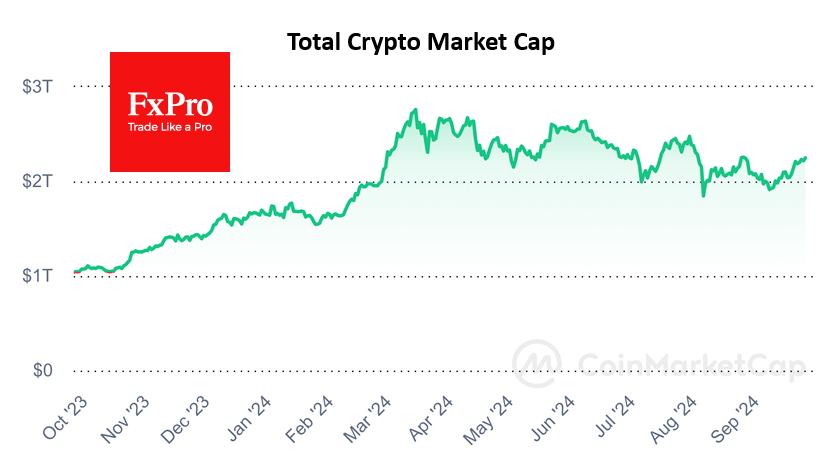
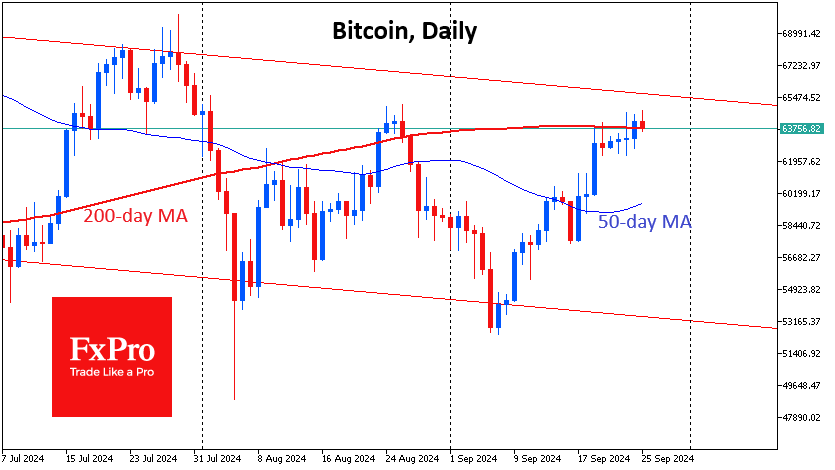
Bitcoin hit a new monthly high of $64.7K early on Wednesday but has since pulled back around $1000 – a common pattern of late. The first cryptocurrency has been struggling to find equilibrium near the highs of late last month and near the 200-day moving average. It will take new data and momentum to tip the price out of equilibrium. There is a risk that short-term gains in risk appetite on policy easing in the US and China will fade.
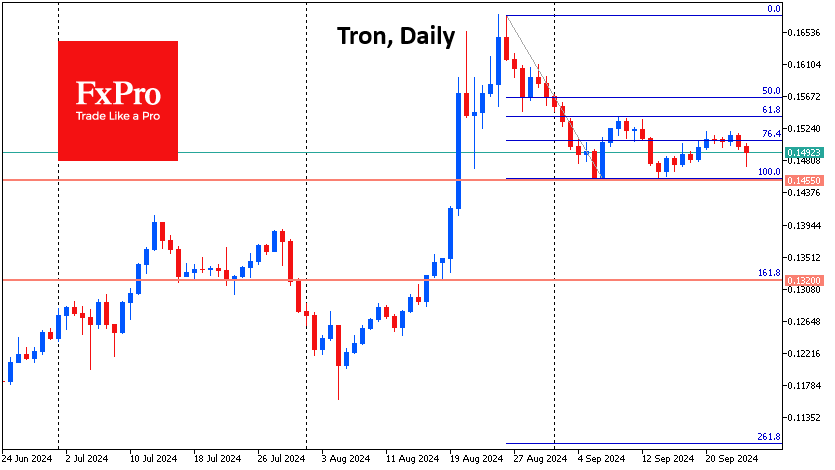
Tron is giving up positions for the second day in what so far looks like new bearish momentum after a corrective bounce. The focus will be on how the coin behaves on the decline from the current $0.15 to $0.1450. An update of the local lows will take the main scenario down to $0.132. The ability to stay above it will potentially open the way for an update of the highs at $0.168.
News Background
According to 10x Research, Bitcoin could hit new all-time highs in October thanks to Fed rate cuts and upcoming payments to creditors of bankrupt crypto exchange FTX.
Ethereum has grown almost twice as fast as Bitcoin since the Fed’s rate cut on 18 September. Following the monetary easing in the US, funding rates for ETH-based perpetual futures turned positive, according to CoinGlass data, reflecting increased demand for leveraged long positions.
According to QCP Capital, interest in the Ethereum options market has shifted from puts to calls. The implied volatility of ETH contracts exceeds that of Bitcoin by 9%, suggesting improved sentiment and potentially greater price movement.
Play Solana has opened pre-orders for the PSG1 blockchain-enabled handheld gaming console. The PSG1 supports Solana blockchain-based games and has a built-in hardware wallet.
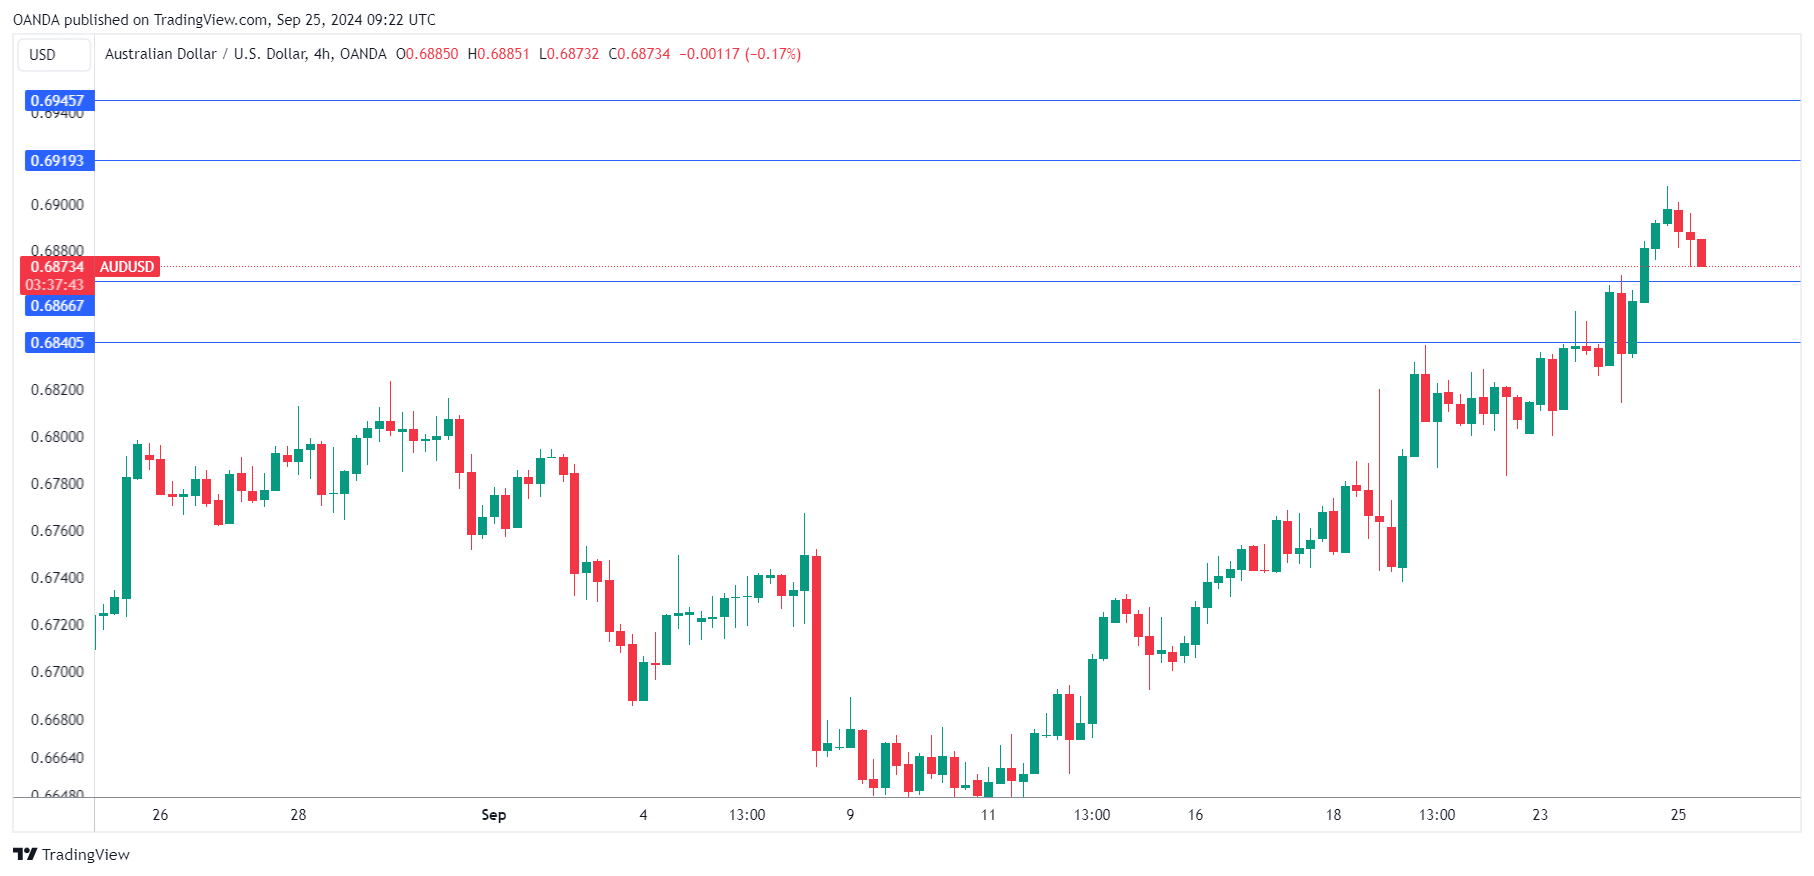
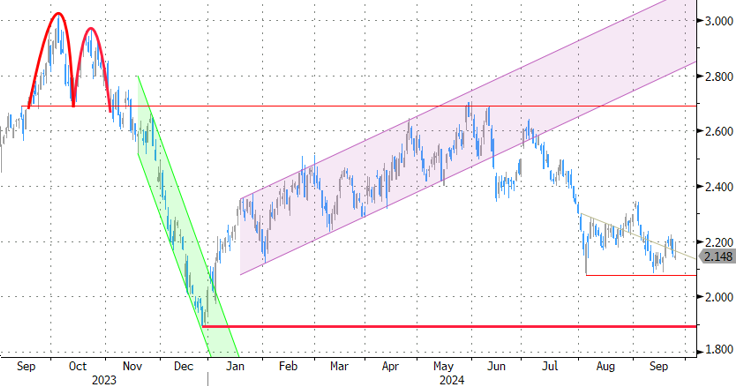
Australia’s Inflation Falls to 3-Year Low, Aussie Dips Lower
The Australian dollar has edged lower on Wednesday, after surging 1.1% since the start of the week. In the European session, AUD/USD is trading at 0.6879, down 0.18%. Earlier, the Australian dollar rose above the 0.69 level for the first time since February 2023.
Australia’s CPI drops to 2.7%
Australia released August CPI on Wednesday, a day after the Reserve Bank of Australia held the cash rate at 4.35%. Headline CPI rose 2.7% y/y, down sharply from 3.5% in July. This was very close to the market estimate of 2.8% and the Australian dollar’s reaction to the release was muted. The decline was driven by a sharp drop in electricity and fuel prices.
The markets may not have been impressed but the inflation reading was the lowest since August 2021 and the first time since then that inflation has fallen to the RBA’s target range of 2%-3%. Significantly, core CPI also fell within the target range, easing from 3.7% to 3.0%.
In an odd twist, the inflation report came a day after the RBA meeting, with the rate statement noting that inflation remains too high. Governor Bullock reiterated in her press conference that there would be no rate cuts in the “near term”, but if inflation continues on its downward path, the central bank will be under strong pressure to reconsider.
The US Conference Board consumer confidence index is usually not a market-mover but a very soft reading on Tuesday sent the US dollar sharply lower against most of the major currencies. The index slipped to 98.7 in September, down sharply from a revised 105.6 in August and below the market estimate of 103.8.The Australian dollar, which showed little movement after the RBA decision, climbed after the consumer confidence release and closed on Tuesday up 0.86%.
AUD/USD Technical
- AUD/USD is putting pressure on support at 0.6866. Close by, there is support at 0.6840
- There is resistance at 0.6919 and 0.6945
BoE’s Greene warns of higher neutral Rate, supports measured easing approach
BoE MPC member Megan Greene emphasized the need for a "gradual approach" to easing monetary policy in her speech today. She highlighted that her recent vote to hold the Bank Rate at 5% in September, following a 25bpps cut in August, aligns with this stance.
Greene outlined three key economic scenarios influencing inflation and policy decisions.
In the first scenario, global shocks fade, allowing inflation pressures to ease with "less restrictive" policy. In the second, some "economic slack" is needed to bring inflation back to the target sustainably. In the third, structural changes affecting wage and price-setting could require monetary policy to remain "tighter for longer".
Greene sees the second scenario as the most likely, where slack in the economy will be needed to tame inflation. However, she warned that there is a "higher risk" of the third scenario playing out, suggesting that the neutral interest rate could be higher than previously thought, meaning that current policy may not be as restrictive as anticipated. Greene noted, "I believe the risks to activity are to the upside," which could require maintaining higher rates for longer.
She will monitor data to confirm whether the third scenario risk is decreasing and the second is becoming more likely. Until then, "steady-as-she goes approach to monetary policy easing is appropriate," she added.
Market Analysis: AUD/USD Rallies Toward 0.7000, NZD/USD Follows Suit
AUD/USD surged above the 0.6800 and 0.6850 levels. NZD/USD is also rising and might aim for more gains above 0.6300.
Important Takeaways for AUD USD and NZD USD Analysis Today
- The Aussie Dollar rallied after forming a base above the 0.6750 level against the US Dollar.
- There is a key bullish trend line forming with support at 0.6860 on the hourly chart of AUD/USD at FXOpen.
- NZD/USD is consolidating gains from the 0.6350 zone.
- There is a major bullish trend line forming with support at 0.6280 on the hourly chart of NZD/USD at FXOpen.
AUD/USD Technical Analysis
On the hourly chart of AUD/USD at FXOpen, the pair started a fresh increase from the 0.6750 support. The Aussie Dollar was able to clear the 0.6800 resistance to move into a positive zone against the US Dollar.
There was a close above the 0.6850 resistance and the 50-hour simple moving average. Finally, the pair tested the 0.6900 zone. A high was formed near 0.6908 and the pair recently saw a minor pullback.
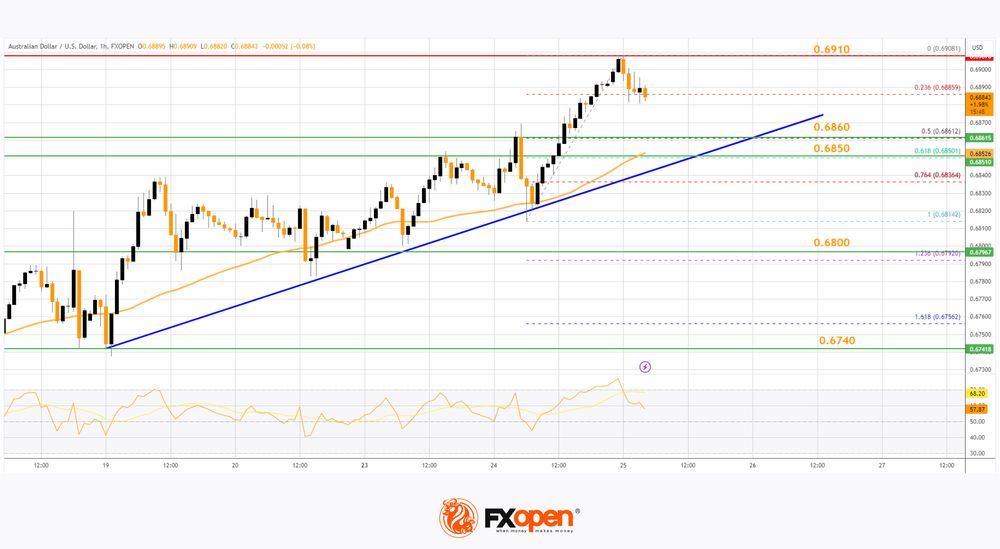
There was a move below the 0.6900 level. The pair declined below the 23.6% Fib retracement level of the upward move from the 0.6814 swing low to the 0.6908 high. On the downside, initial support is near a key bullish trend line at 0.6860.
The next major support is near the 61.8% Fib retracement level of the upward move from the 0.6814 swing low to the 0.6908 high at 0.6850 and the 50-hour simple moving average.
If there is a downside break below the 0.6850 support, the pair could extend its decline toward the 0.6800 level. Any more losses might signal a move toward 0.6740.
On the upside, the AUD/USD chart indicates that the pair is now facing resistance near 0.6910. The first major resistance might be 0.6925. An upside break above the 0.6925 resistance might send the pair further higher.
The next major resistance is near the 0.6980 level. Any more gains could clear the path for a move toward the 0.7000 resistance zone.
NZD/USD Technical Analysis
On the hourly chart of NZD/USD on FXOpen, the pair started a steady increase from the 0.6180 zone. The New Zealand Dollar broke the 0.6265 resistance to start the recent increase against the US Dollar.
The pair settled above 0.6280 and the 50-hour simple moving average. It tested the 0.6355 zone and is currently correcting gains. The pair corrected lower below the 0.6340 level. The NZD/USD chart suggests that the RSI is now approaching 60.
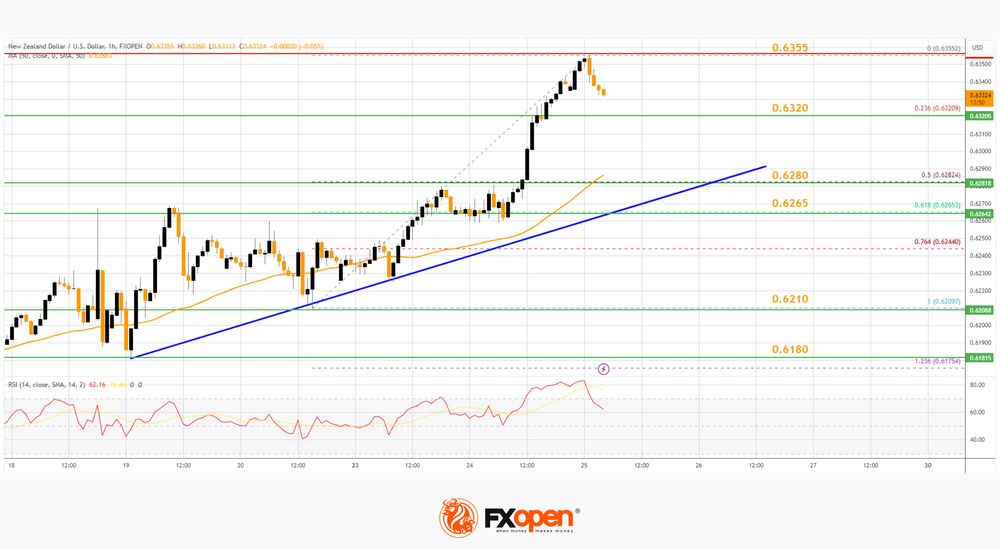
On the downside, immediate support is near the 23.6% Fib retracement level of the upward wave from the 0.6209 swing low to the 0.6355 high at 0.6320.
The first key support is near a trend line at 0.6280 and the 50% Fib retracement level of the upward wave from the 0.6209 swing low to the 0.6355 high. It is close to the 50-hour simple moving average. The next major support is near the 0.6265 level.
If there is a downside break below the 0.6265 support, the pair might slide toward the 0.6210 support. Any more losses could lead NZD/USD in a bearish zone to 0.6180.
On the upside, the pair might struggle near 0.6355. The next major resistance is near the 0.6380 level. A clear move above the 0.6380 level might even push the pair toward the 0.6440 level. Any more gains might clear the path for a move toward the 0.6500 resistance zone in the coming days.
Trade over 50 forex markets 24 hours a day with FXOpen. Take advantage of low commissions, deep liquidity, and spreads from 0.0 pips. Open your FXOpen account now or learn more about trading forex with FXOpen.
This article represents the opinion of the Companies operating under the FXOpen brand only. It is not to be construed as an offer, solicitation, or recommendation with respect to products and services provided by the Companies operating under the FXOpen brand, nor is it to be considered financial advice.
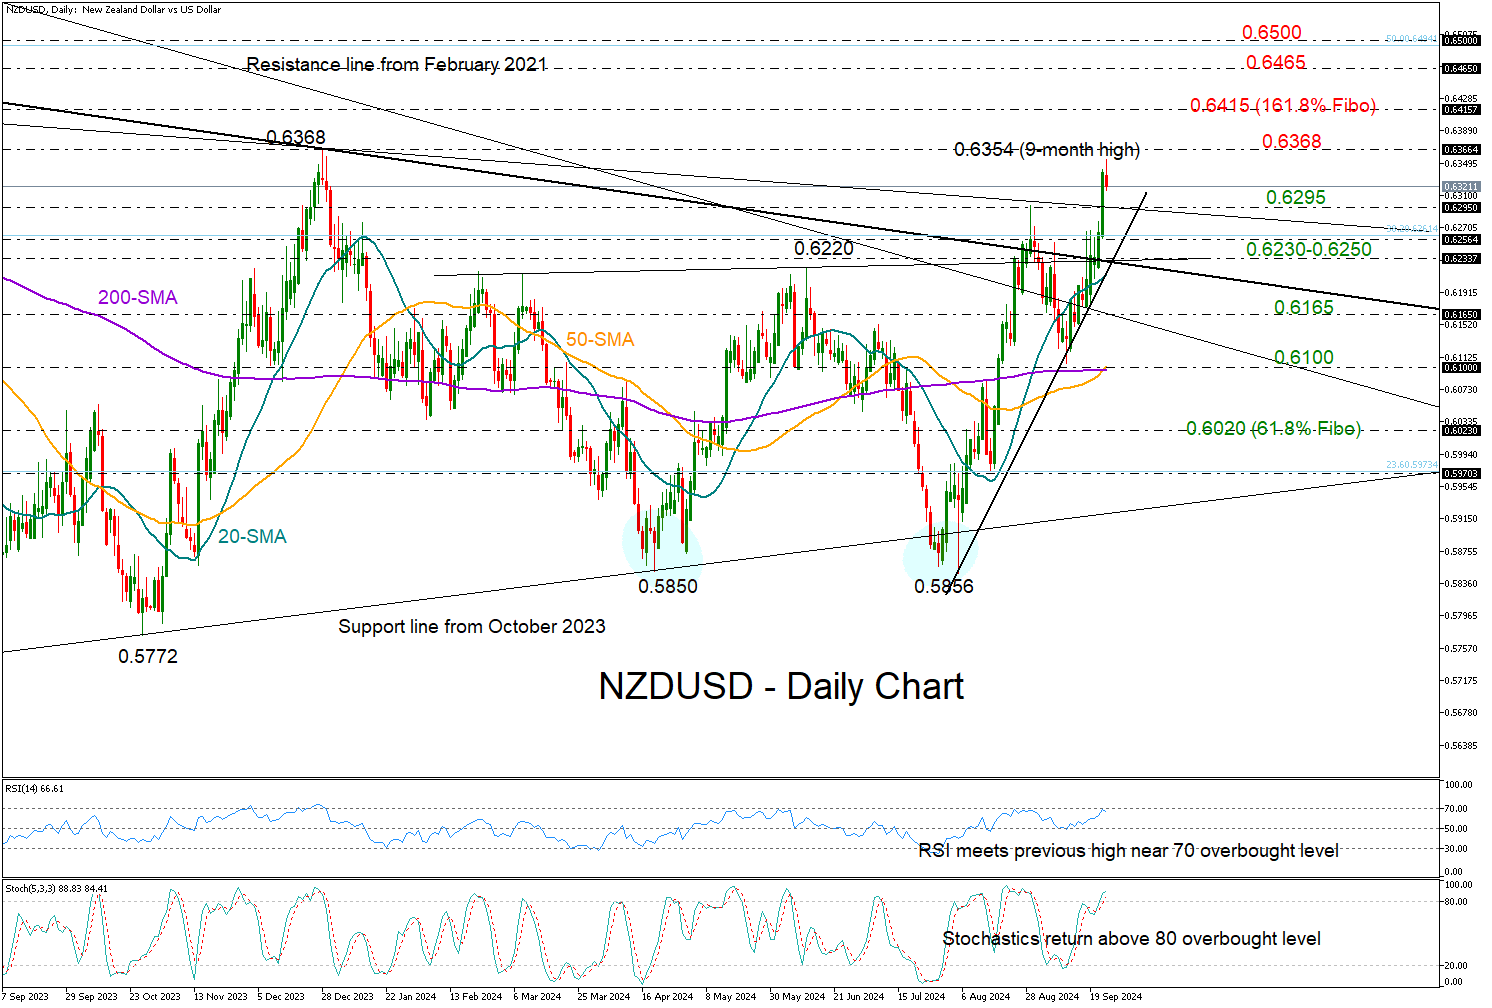
NZDUSD Puts Life Back to Short-Term Uptrend
- NZDUSD marks new higher high for 2024
- Positive momentum might soften; eyes on 0.6368
NZDUSD stretched its exciting rally to a new nine-month high of 0.6354 on Wednesday before experiencing mild losses.
The pair surpassed August’s bar with a bang, shifting the spotlight to the December 2023 peak of 0.6368. Given the strengthening overbought signals coming from the RSI and the stochastic oscillator, the rally could soon calm down.
A decisive close above 0.6368 could stage a new bull wave towards the 161.8% Fibonacci extension of the latest downfall at 0.6415. The 0.6465 zone posed some limitations during December 2022-February 2023. Hence, a step above it might be necessary for a continuation towards the 0.6500-0.6536 resistance formed by the 50% Fibonacci retracement of the 2021-2022 downtrend and the 2023 top.
On the downside, the broken resistance line from July 2023 could act as support around the August peak of 0.6297. If there are more declines, expect congestion near 0.6250 and then around the important area of 0.6230. In the event that the latter also collapses, there is a strong chance of a rapid fall to 0.6165. Even lower, the door could open for the 50- and 200-day simple moving averages (SMAs) seen near 0.6100.
In conclusion, NZDUSD might face weaker upward pressure in the coming sessions as it sails in overbought territory. To attract new buyers, the market requires a clear close above 0.6368.
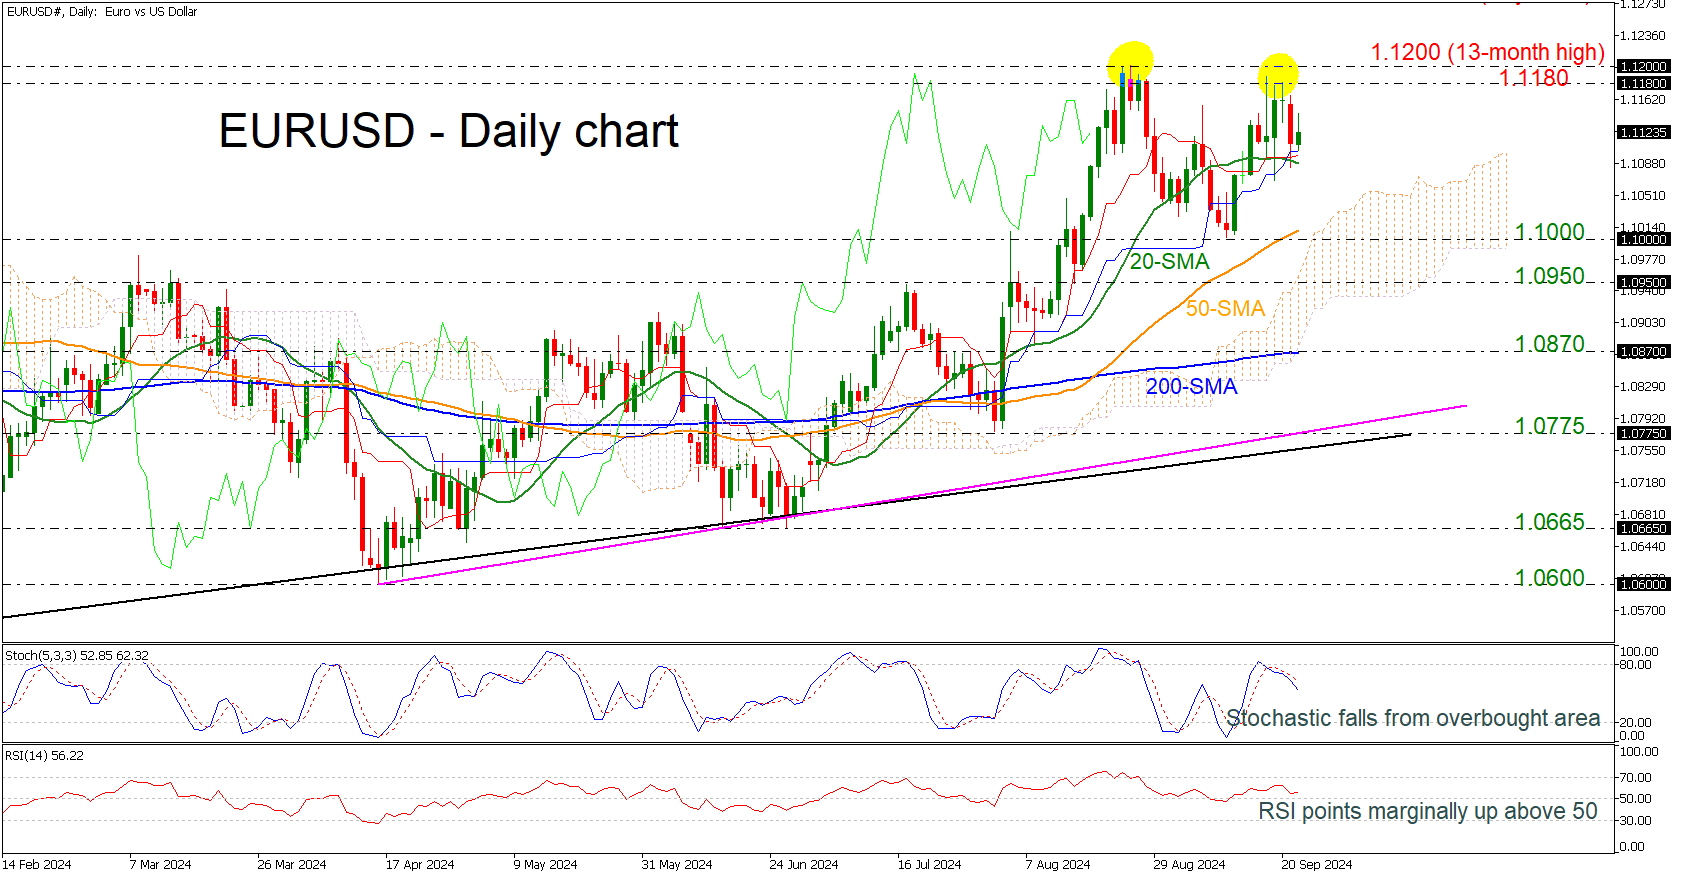
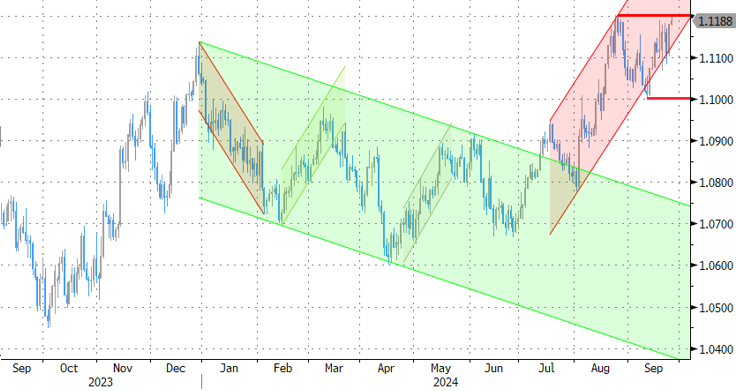
EURUSD Retests 1.1200 Critical Level
- Will EURUSD break the double bottom to the upside?
- Strong support at 1.1100
- Stochastic and RSI look quite positive
EURUSD is continuing the upside rally near the 13-month high of 1.1200, remaining well above the 20-day simple moving average (SMA). A successful break to the upside of the double top pattern could confirm the upside tendency.
Technically, the stochastic oscillator posted a bullish crossover within its %K and %D lines slightly beneath the 80 line, while the RSI is moving horizontally despite that is still standing above the neutral threshold of 50.
If the market manages to pick up speed the July 2023 peak of 1.1275 could offer nearby resistance ahead of the 1.1390 barrier, taken from the high in February 2022.
Should prices decline, immediate support could be found from the 20-day SMA at 1.1100 before tumbling to the 50-day SMA at 1.1017. Slightly lower, the 1.1000 round number, which holds within the Ichimoku cloud may halt bearish actions.
In a nutshell, EURUSD has been in a neutral phase over the last five weeks and needs a boost above 1.1200 to confirm the positive momentum.
China-Sparked Asian Bull Run Continues This Morning
Markets
China’s stimulus announcement impacted all corners of the market. Hopes for a revival of the 2nd largest economy lifted commodity prices. Oil & iron prices both added around 2%. Equities rose with Europe’s EuroStoxx50 adding 1.1%. Wall Street had to digest an unexpected and sharp drop in the Richmond manufacturing index & US consumer confidence first before ending up with new record highs in both the DJI and S&P500. The Conference Board indicator dropped from 105.6 to 98.7, nearing the 2024 lows again. The current assessment deteriorated significantly, tanking 10 points to the weakest level since 2021. The expectations component eased to 81.7, from 86.3. The data releases called off the intraday rise of US yields. Gains of as much as 6 bps (10-yr) made way for net daily losses varying between -0.8 (30-yr) and -4.9 (2-yr) bps with a successful $69bn 2-yr bond auction additionally weighing on front-end yields. European rates fell in a similar curve shift. Both the swap and German 2-yr rate dropped to new YtD lows. Currency markets moves were guided by risk-on as well. JPY and USD lagged G10 peers. The trade-weighted dollar index finished below the previous YtD closing levels (100.46). EUR/USD shrugged off Monday PMI losses and closed at the highest level since end-August (1.118). AUD, NZD, SEK and NOK all printed decent gains. Sterling caught a breather against the euro after a stellar run on Monday but extended gains against the USD (GBP/USD +1.34).
The China-sparked Asian bull run continues this morning with the CSI300 adding another 2%. The PBOC lowered the rate of its 1-yr lending facility by the most since 2016 (-30 bps to 2%), kickstarting the implementation of the measures announced on Tuesday. China’s yuan gapped higher to USD/CNY 7.016. We doubt whether it’ll suffice for European and US markets this time around though. The empty eco calendar won’t interrupt today’s technically inspired trading session. We’re eyeballing the front end of the yield curve in particular. Money markets ramp up easing bets, especially for the ECB. While we don’t agree with growing market conviction of an October cut (+60%), it’ll be difficult to turn the tide for now without influential policymakers such as Lagarde weighing in on the debate. EUR/USD is close to the 1.1202 resistance. A break higher probably requires additional USD weakness and would pave the way for a return to the 2023 high of 1.1276.
News & Views
In its updated 2024 World Oil Outlook through 2050, OPEC sees an ongoing need for more energy as economies grow, populations expand and urbanization levels increase. OPEC states that ‘Global energy demand in this year’s WOO is set to expand by 24% in the period to 2050, driven by significant expansion in the non-OECD region. The Outlook sees the need for an expansion in all energy sources, with the exception of coal. For oil alone, we see demand reaching over 120 million barrels a day by 2050, with the potential for it to be higher. There is no peak oil demand on the horizon’. OPEC holds a different view compared to many other forecasters like the IEA which see oil demand peaking much earlier. OPEC expects oil and gas to still make up for over 50% of the energy mix in 2025. To meet demand OPEC raised the number of needed investments to $17.4 bn by 2050.
The National bank of Hungary after a pause last month cut its policy rate again by 25 bps to 6.5%. Inflation in August (3.4%) declined back in the MNB tolerance band of 3% +/- 1%, even as this was mainly due to lower fuel prices and base effects. Disinflation in market services was rather slow. MNB expects inflation to fall further in September, but to rise again to 4.0% by the end of the year. Core inflation might return to 5% end 2024. Disinflation should nonetheless continue in Q1 2025. MNB sees inflation averaging between 3.5% and 3.9% this year, 2.7%-3.5% in 2025 and 2.5%-3.5% in 2026. Growth for this and next year was downwardly revised (1.0%-1.8% & 2.7%-3.7%). 2026 was upwardly revised to 3.5%-4.5%. Vice governor Virag said the MNB will consider small cuts as well as the option to hold at each of the remaining monthly meetings this year, which can be seen as a slightly more dovish stance compared to last month (one or two rate cuts this year). The Hungarian 2-y swap yield declined 4.5 bps to 5.52%. The forint whipsawed at the time of the press conference, but in the end closed marginally stronger near EUR/HFU 394.3.
Graphs
GE 10y yield
The ECB cut policy rates by 25 bps in June and in September. Stubborn inflation (core, services) make follow-up moves less evident. We expect the central bank to stick with the quarterly reduction pace. Disappointing US and unconvincing-to-outright-weak EMU activity data dragged the long end of the curve down. The move accelerated during the early August market meltdown.
US 10y yield
The Fed kicked off its easing cycle with a 50 bps move. It is headed towards a neutral stance now that inflation and employment risks are in balance. Conservative SEP unemployment forecasts risk being caught up by reality and with it the dot plot (50 bps more cuts in 2024). We hold our call for two more 50 bps cuts this year. Pressure on the front of the curve and weakening eco data keeps the long end in the defensive for now as well.
EUR/USD
EUR/USD moved above the 1.09 resistance area as the dollar lost interest rate support at stealth pace. US recession risks and bets on fast and large rate cuts trumped traditional safe haven flows into USD. An ailing euro(pean economy) only briefly offset some of the general USD weakness. EUR/USD’s dollar-driven ascent is nearing resistance around 1.12 again.
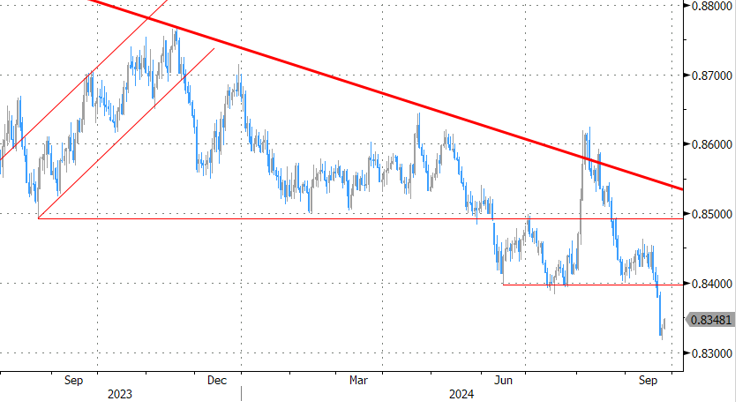
EUR/GBP
The BoE delivered a hawkish cut in August. Policy restrictiveness will be further unwound gradually on a pace determined by a broad range of data. The strategy similar to the ECB’s balances out EUR/GBP in a monetary perspective. But the economic picture is increasingly diverging to the benefit of sterling. EUR/GBP succumbed to horrible European September PMI’s. Support at 0.84 broke and brings the 2022 low (0.8203) on the radar.