Sample Category Title
Fed Cuts Rates by an Oversized 50 Basis Points
The Federal Reserve Open Market Committee (FOMC) cut the target range for the federal funds rate by 50 basis points (bps), to 4.75% to 5.00% and announced it would continue its balance sheet runoff.
The Fed noted that it "has gained greater confidence that inflation is moving sustainably toward 2 percent", and "judges that the risks to achieving its employment and inflation goals are roughly in balance."
On the future path of policy, the statement repeated that "the Committee will continue to monitor the implications of incoming information for the economic outlook. The Committee would be prepared to adjust the stance of monetary policy as appropriate if risks emerge that could impede the attainment of the Committee's goals."
The Fed's Summary of Economic Projections was updated from June:
- The median projection for real GDP growth was largely unchanged at 2.0% in 2024, 2.0% in 2025, 2.0% in 2026, and 1.8% over the long run.
- The median unemployment rate forecast was raised to 4.4% in 2024, 4.4% in 2025, 4.3% in 2026, and 4.2% over the long run (from 4.0%, 4.2%, 4.1%, and 4.2%), respectively.
- On inflation, the median estimate for core PCE was lowered to 2.6% in 2024, 2.2% in 2025, and 2.0% in 2026 (from 2.8%, 2.3%, and 2.0%).
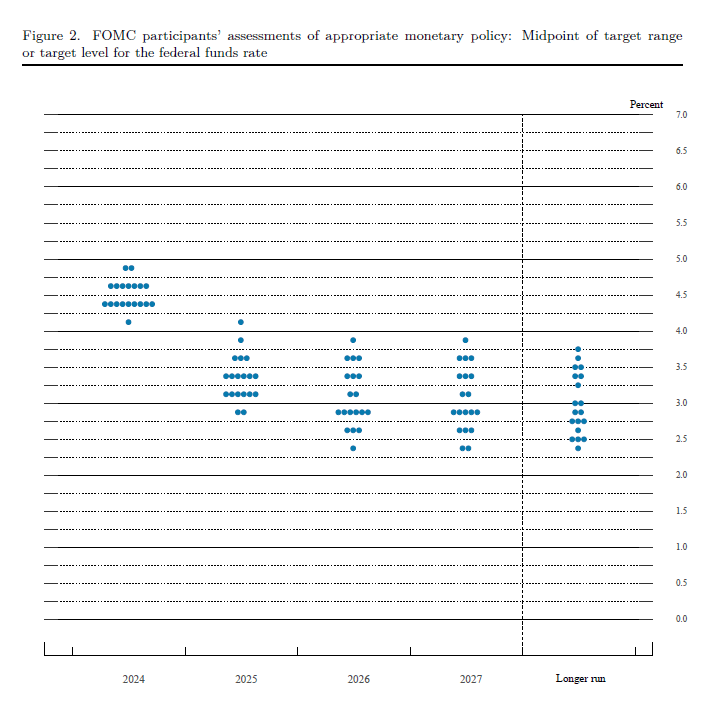
- The median projection for the fed funds rate was also lowered to 4.4% in 2024, 3.4% in 2025, 2.9% in 2026, and the long-run neutral rate was assumed to be 2.9% (from 5.1%, 4.1%, 3.1%, and 2.8%).
One FOMC member voted against the decision. Michelle W. Bowman preferred to cut the funds rate by a quarter point. That is the first dissent by a Fed governor since 2005.
Key Implications
Today was one of the most uncertain Fed decisions in recent memory. The central bank could have easily gone either way with this one. But given that it elected to go for an oversized 50 bps cut, it's clear that the Fed has gained sufficient confidence that inflation is headed to 2%. It can now focus on the slowing job market, where the unemployment rate has been steadily rising.
Looking at the updated Fed member forecast, the "dots", the median expectation is for only 50 bps in further cuts expected this year. This could be another 50 in November, or it could imply that the Fed will move to a slower path now that it has come out of the gates quickly, with a quarter point cut at each of the remaining meetings this year. From our point of view, the Fed's current policy stance is still roughly 200 bps above where it needs to be given the state of the economy. This implies that, no matter the specific pace, investors should expect the Fed to keep cutting through the rest of this year and next.
Fed cuts interest rate by 50bps, only Bowman dissents
Fed cuts federal funds rate by 50 bps to 4.75-5.00% today. While the decision was not unanimous, only Fed Governor Michelle Bowman dissented and voted for a 25bps cut.
Fed acknowledged that job gains have "slowed" while unemployment rate has "moved up". At the same time, inflation has made "further progress" towards 2% target. In considering further adjustments, Fed will "carefully assess incoming data, the evolving outlook, and the balance of risks".
In the new median economic projections, interest rate will fall to 4.4% by the end of 2024 (versus prior 5.1%, implying 50bps more rate cut), 3.4% by the end of 2025 (versus prior 4.1%), and then 2.9% by the end of 2026 (versus prior 3.1%). That is Fed is seeing a much faster rate cut this year, but the same pace in 2025. The longer run rate was revised slightly up from 2.8% to 2.9%. 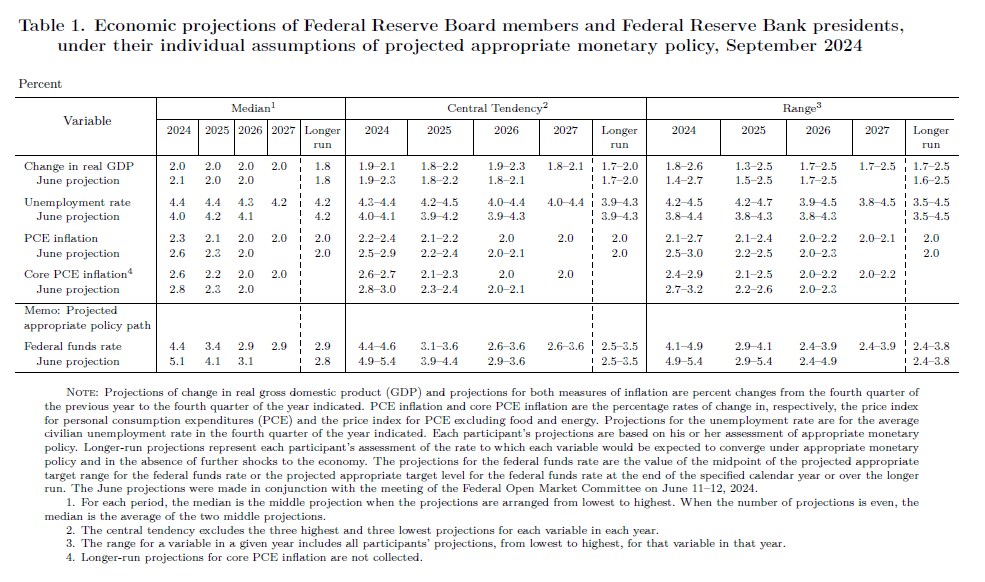 In the new dot plot, 9 members penciled in fed funds rate to be at 4.50-4.75 or above by the end of the year. 10 members see interesting rates at 4.25-4.50% and below. So it's a pretty tight split. November FOMC meeting would be live.
(FED) Federal Reserve Issues FOMC Statement
Recent indicators suggest that economic activity has continued to expand at a solid pace. Job gains have slowed, and the unemployment rate has moved up but remains low. Inflation has made further progress toward the Committee's 2 percent objective but remains somewhat elevated.
The Committee seeks to achieve maximum employment and inflation at the rate of 2 percent over the longer run. The Committee has gained greater confidence that inflation is moving sustainably toward 2 percent, and judges that the risks to achieving its employment and inflation goals are roughly in balance. The economic outlook is uncertain, and the Committee is attentive to the risks to both sides of its dual mandate.
In light of the progress on inflation and the balance of risks, the Committee decided to lower the target range for the federal funds rate by 1/2 percentage point to 4-3/4 to 5 percent. In considering additional adjustments to the target range for the federal funds rate, the Committee will carefully assess incoming data, the evolving outlook, and the balance of risks. The Committee will continue reducing its holdings of Treasury securities and agency debt and agency mortgage‑backed securities. The Committee is strongly committed to supporting maximum employment and returning inflation to its 2 percent objective.
In assessing the appropriate stance of monetary policy, the Committee will continue to monitor the implications of incoming information for the economic outlook. The Committee would be prepared to adjust the stance of monetary policy as appropriate if risks emerge that could impede the attainment of the Committee's goals. The Committee's assessments will take into account a wide range of information, including readings on labor market conditions, inflation pressures and inflation expectations, and financial and international developments.
Voting for the monetary policy action were Jerome H. Powell, Chair; John C. Williams, Vice Chair; Thomas I. Barkin; Michael S. Barr; Raphael W. Bostic; Lisa D. Cook; Mary C. Daly; Beth M. Hammack; Philip N. Jefferson; Adriana D. Kugler; and Christopher J. Waller. Voting against this action was Michelle W. Bowman, who preferred to lower the target range for the federal funds rate by 1/4 percentage point at this meeting.
AUDUSD Rallies from the Extreme Within a Corrective Structure
Hello traders. Welcome to another trading blog where we discuss chart setups that Elliottwave-Forecast members traded. In today’s blog, the spotlight will be on AUDUSD as the pair recently reacted as expected from an extreme area thus providing profitable trade ideas for members.
Since the low of October 2022, AUDUSD has rallied and faltered multiple times. The pair has been in a range between the high of February 2023 and the low of October 2022. However, even within a range, traders can spot opportunities in the shorter time frames. As for the Aussie, the pair completed the supercycle degree wave (I) in March 2020. Since the end of wave (I), the pair has rallied sharply with an impulse sequence that ended in February 2021. Since then, it has been in a corrective cycle that we have identified as a double three structure. We update the detailed weekly and daily charts every weekend, or sometimes within the week, for members to understand the long-term path.
Our long-term forecast sees the rally from the October 2022 low as a connector that could lead to the extension of the larger bearish corrective sequence from February 2021. Meanwhile, the last setup on AUDUSD was along the path of the connector—upside. Within the 30-month range, we expected the pair to hit at least 0.6955. With this in mind, we shared a bullish bias with members on the H4 and H1 charts. Let’s look at the latest setup on this pair.
AUDUSD Elliott Wave Analysis. 09/09/2024 Update
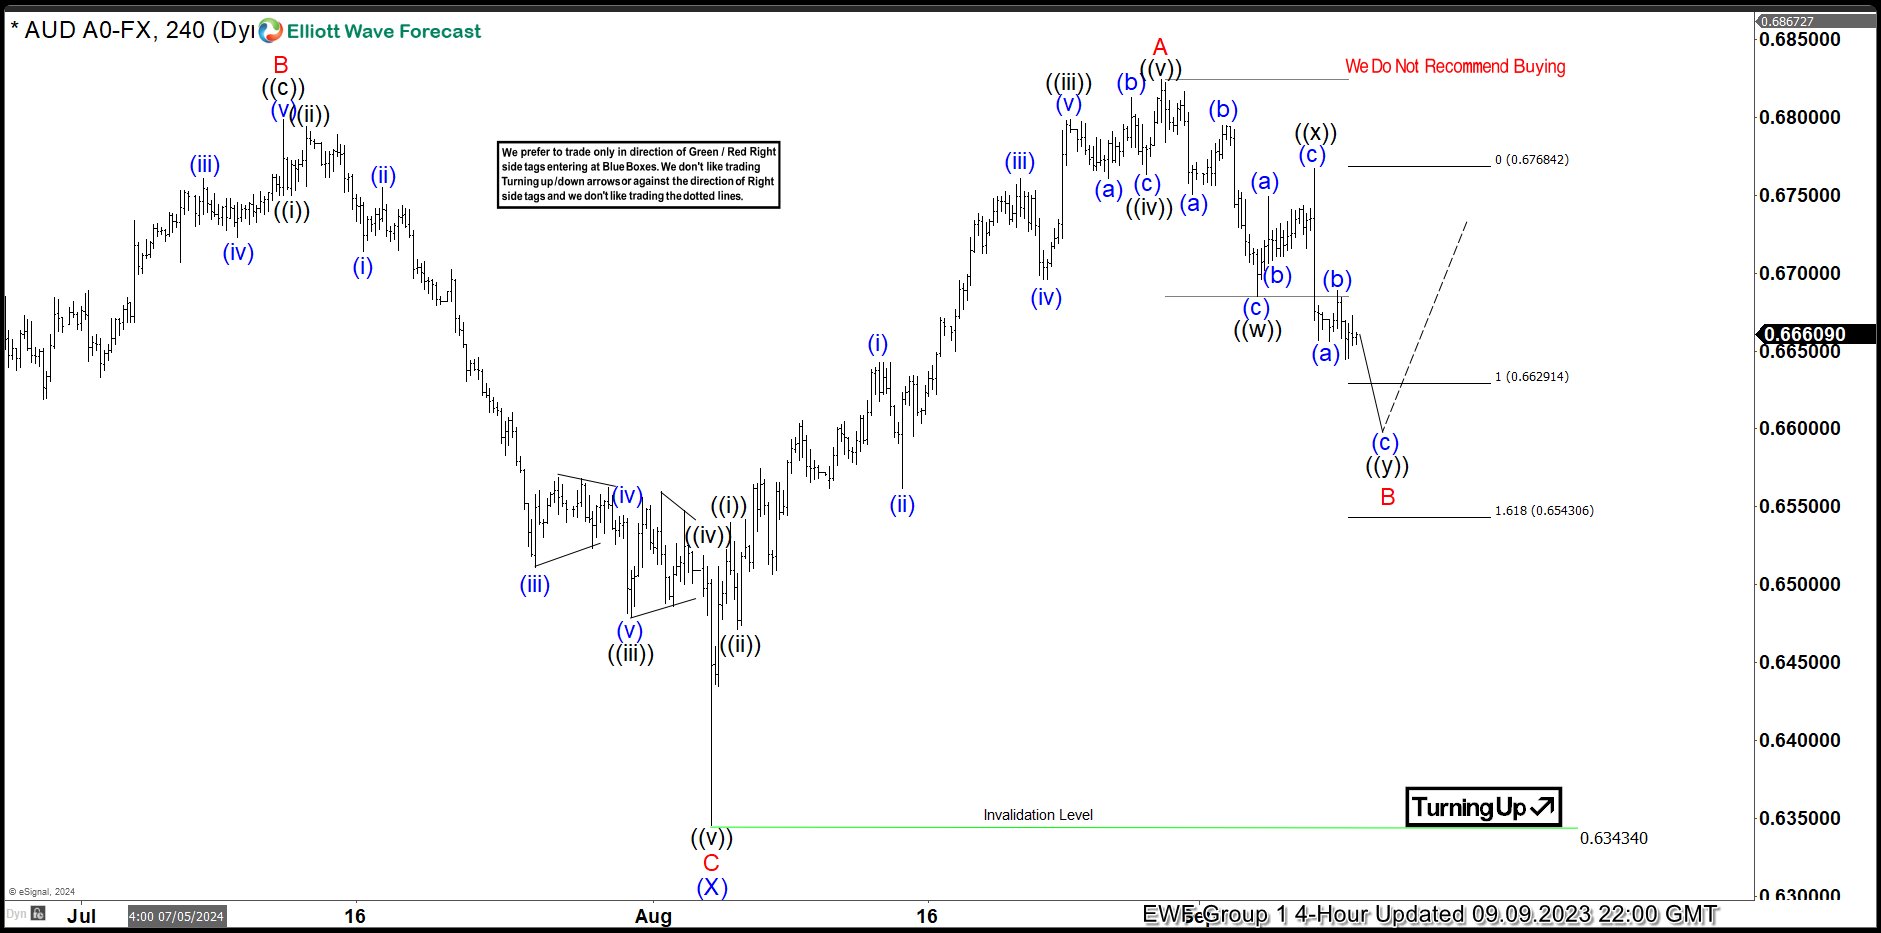
On 09.09.2024, we shared the H4 chart above with members. After the price completed wave (X) of ((X)) on 08.05.2024, it rallied sharply with an impulse structure. We identified the impulse sequence from 08.05.2025 as wave A of (Y) of ((X)). In addition, we identified the pullback that followed as a corrective double three structure, labeled as wave B. Thus, we expected that wave B would find support in the extreme zone between 0.6629 and 0.6543. From the extreme, we anticipated at least a 3-swing bounce. We provided the extreme zone for independent members who would like to buy in this kind of scenario. While that was the path we expected, we would prefer to buy after wave A’s high is breached. Consequently, we can buy the next pullback.
AUDUSD Elliott Wave Analysis. 09/09/2024 Update
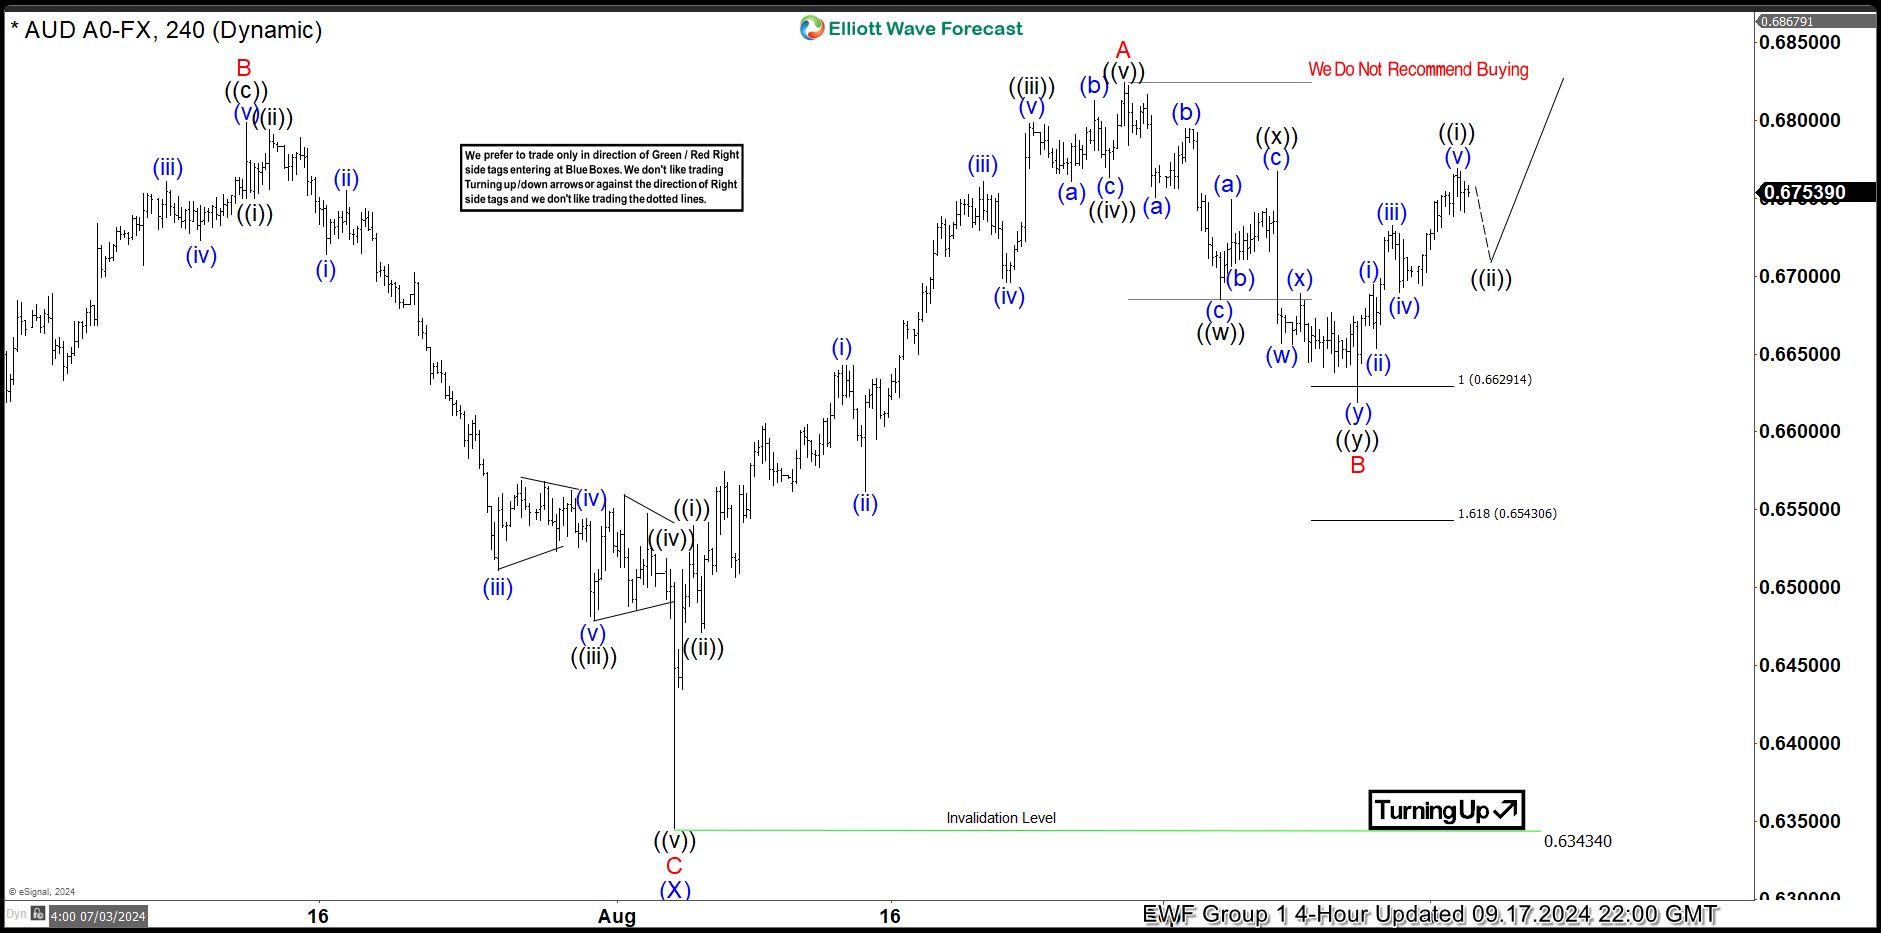
Price reached the extreme as expected, confirming the completion of a double zigzag structure for wave B. Afterwards, an impulse rally followed in wave ((i)) of C. Thus, wave C could extend to 0.7090. Meanwhile, we are expecting a breach of wave A high, opening more room to the upside and confirming that wave B has finished. Afterward, we would like to buy pullbacks when they complete 3, 7, or 11 swings.
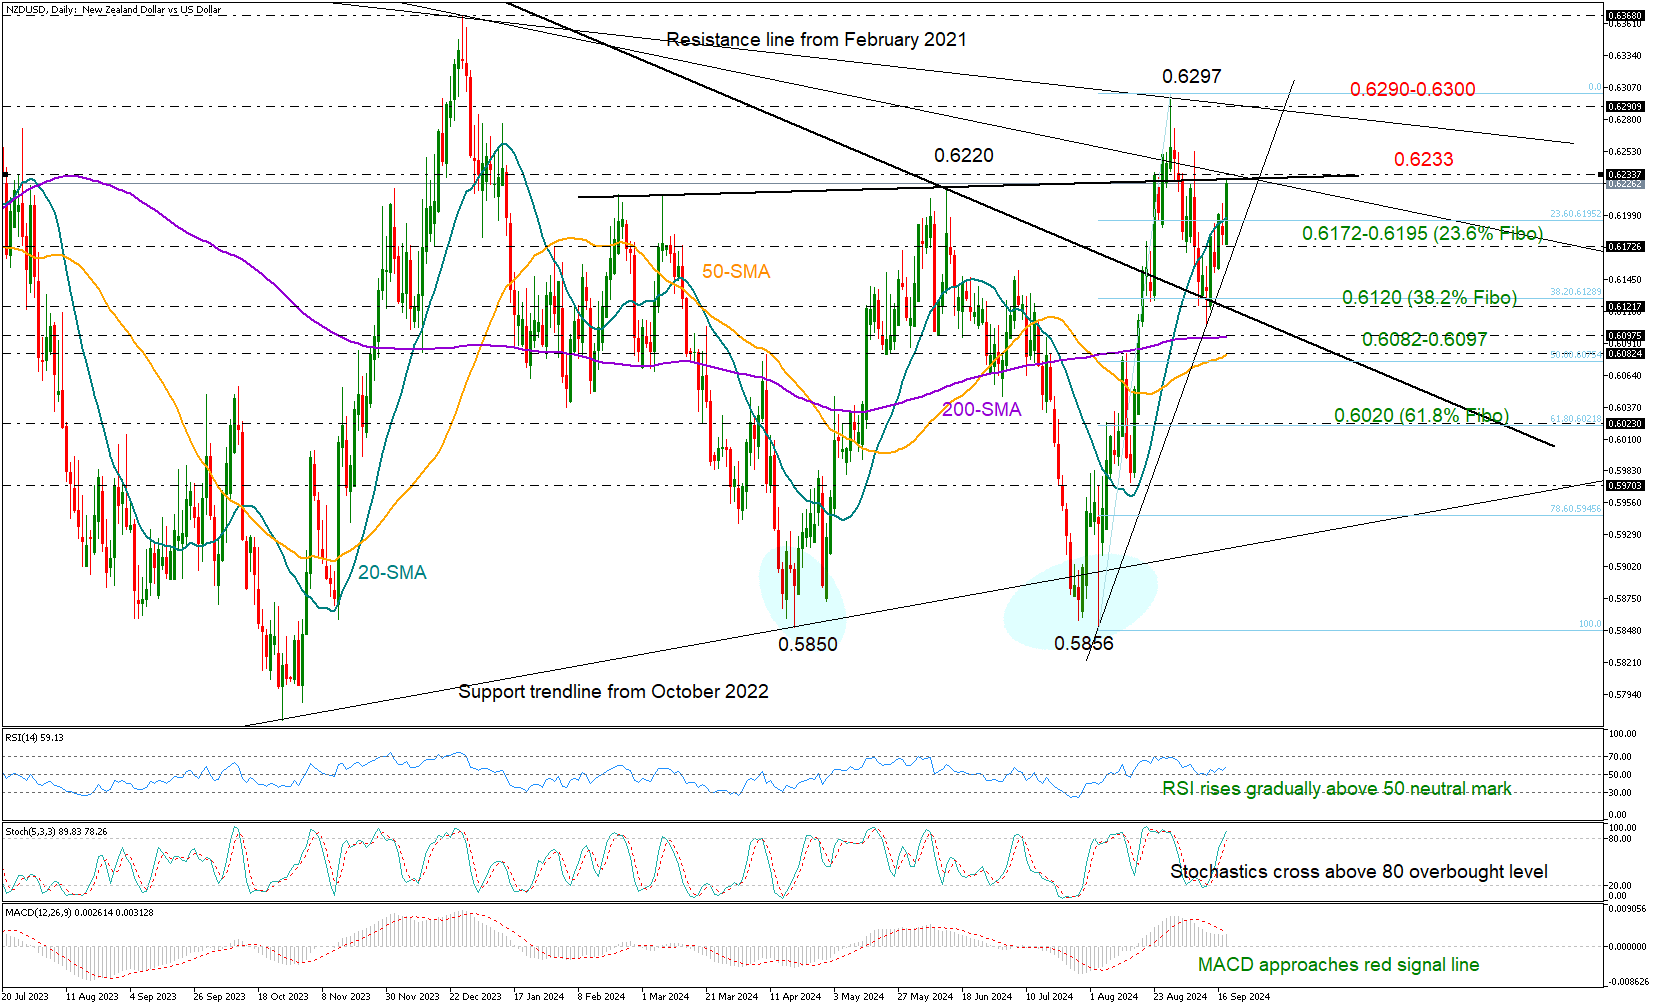
NZDUSD Leads the Pack as FOMC Rate Decision Looms
- NZDUSD bulls retake control; fight for a close above 20-SMA
- Short-term bias is positive, but there are more obstacles on the upside
NZDUSD is a top performer today as investors are actively waiting for the Fed’s rate decision. The pair picked up positive momentum above its 20-day simple moving average (SMA) at 0.6195, which has been rejecting bullish actions over the past week. A close above this line might encourage more buying, but investors might need more progress to increase their exposure in the market.
Specifically, a break above the descending line, which connects the February and December 2023 highs at 0.6233, might secure more gains towards the descending line from July 2023 at 0.6290. The 23.6% Fibonacci retracement of the October 2022-February 2023 uptrend is within breathing distance at 0.6300. Hence, a step above it might be necessary for an acceleration towards the December 2023 peak of 0.6368.
If the pair retreats below its 20-day SMA once again, it may immediately pause near the support trendline at 0.6172. A violation there could reach the 38.2% Fibonacci retracement level of the latest upleg at 0.6120 and the long-term falling line from February 2022. If this floor cracks too, the pair could seek shelter somewhere between the 200- and 50-day SMAs. Then, an aggressive sell-off might follow towards the 61.8% Fibonacci of 0.6020.
Technically, the bias is skewed to the upside given the positive slope in the indicators, though with the stochastic oscillator climbing above its 80 overbought level, there is a risk of failure near 0.6233.
Summing up, despite holding a bullish bias, NZDUSD has two more obstacles to overcome at 0.6233 and 0.6300 before its short-term outlook can be upgraded.
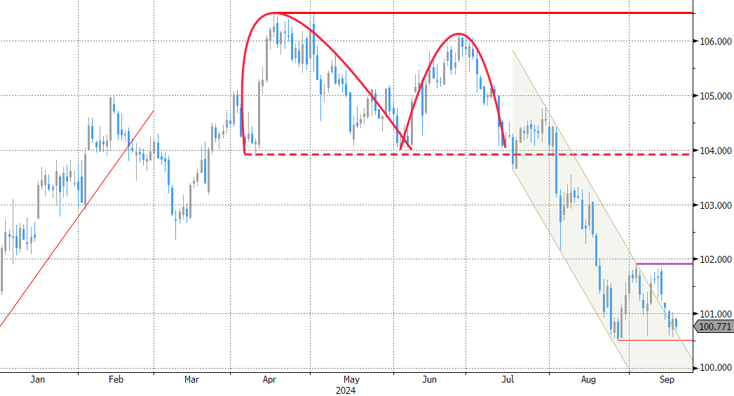
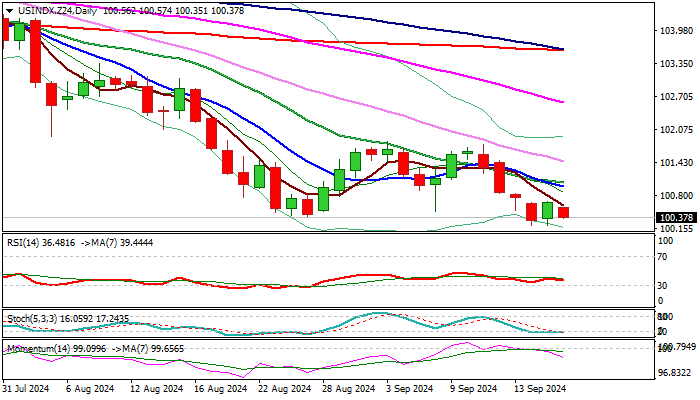
Dollar Index – FOMC Rate Decision to Define Fresh Direction
The dollar index remains in a sideways mode for the third consecutive day and moving within a narrow range, just above new multi-month low.
Near-term price action slowed ahead of key event – Fed interest rate decision – which is expected to define fresh direction.
Technical picture on daily chart is firmly bearish as negative momentum continues to strengthen and MA’s are in bearish configuration (freshly formed 10/20DMA bear cross and converged 100/200DMA’s about to form a death cross), maintaining downside pressure and favoring scenario of bearish continuation.
However, bears need to clearly break pivotal supports at 100.33/00 (200WMA / psychological) to resume larger downtrend and focus on next technical support at 98.92 (Fibo 61.8% of 89.15/114.72 2021/2022 uptrend.
Immediate resistance lays at 100.68 (recent range top) with 101.00 zone (round figure / falling 10/20 DMA’s) marking the first pivot.
Bears are expected to remain fully in play while the price stays below this level, while break higher would generate initial warning.
The US central bank is expected to eventually start its policy easing cycle and make the first rate cut in more than four years, though with high uncertainty about the size of rate cut, as bets for cuts either by 25 or 50 basis points, recently moved in a large swings on quick changes in sentiment.
The latest numbers showed that bets for larger rate cut rose significantly in past few days, adding to hopes that the US policymakers may opt for more aggressive action today.
Growing concerns that the US economy might be in worse condition than initially thought, would add to such scenario (50 basis points cut) in which the dollar would come under fresh pressure.
Markets will also focus on the tone of Fed’s statement and following press conference, as well as signals for the next steps (markets expect more than 100 basis points cuts by the end of the year) which would contribute to overall picture.
Res: 100.68; 101.00; 101.46; 101.84
Sup: 100.22; 100.00; 98.92; 98.36
US DJIA: In Vogue Over SPX 500 and Nasdaq 100 as FOMC Looms
- The Dow Jones Industrial (DJIA) has managed to print a fresh all-time high in September while the S&P 500 and Nasdaq 100 have yet to break above their July all-time highs.
- The US Treasury yield curve bull steepener has reinforced a defensive rotation play in the US stock market.
- Watch the key medium-term support of 40,030 on the DJIA.
Since our last publication, the Dow Jones Industrial Average (DJIA) has rallied by 6%, surpassing the first 41,440 medium-term resistance mentioned in our report. Also, it printed a fresh all-time closing high of 41,622 on Monday, 16 September before the key US Federal Reserve monetary policy decision outcome due later today.
The Fed has been widely expected to kickstart its interest rate cut cycle by either 25 basis points (bps) or 50 bps cut on the Fed funds rate, currently at 5.25%-5.00% after it increased the rate to their highest level in nearly two decades and held it constant for 13 months.
50 bps cut is now baked into the interest rates market
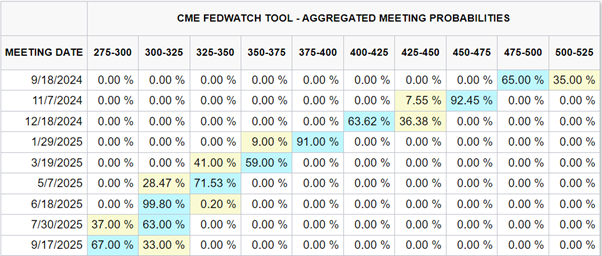
Fig 1: FOMC meetings aggregated probabilities of cuts/hikes as of 18 September 2024 (Source: CME FedWatch tool, click to enlarge chart)
The Fed funds futures market based on data from the CME FedWatch tool has priced in a high odd (65% chance) at this time of the writing that the Fed is likely to enact a jumbo cut of 50 bps today and the expectations of a larger size of cut have increased from a probability of just 14% seen a week ago (see Fig 1).
Overall, the Fed funds futures market is also pricing in a potential 250 bps rate cut in total by the Fed from a year now to bring down the Fed funds rate to 2.75%-3.00% by the 17 September 2025 FOMC meeting from the current rate of 5.25%-5.50%.
Bull steepening US Treasury yield curve reinforces a defensive sector rotation play
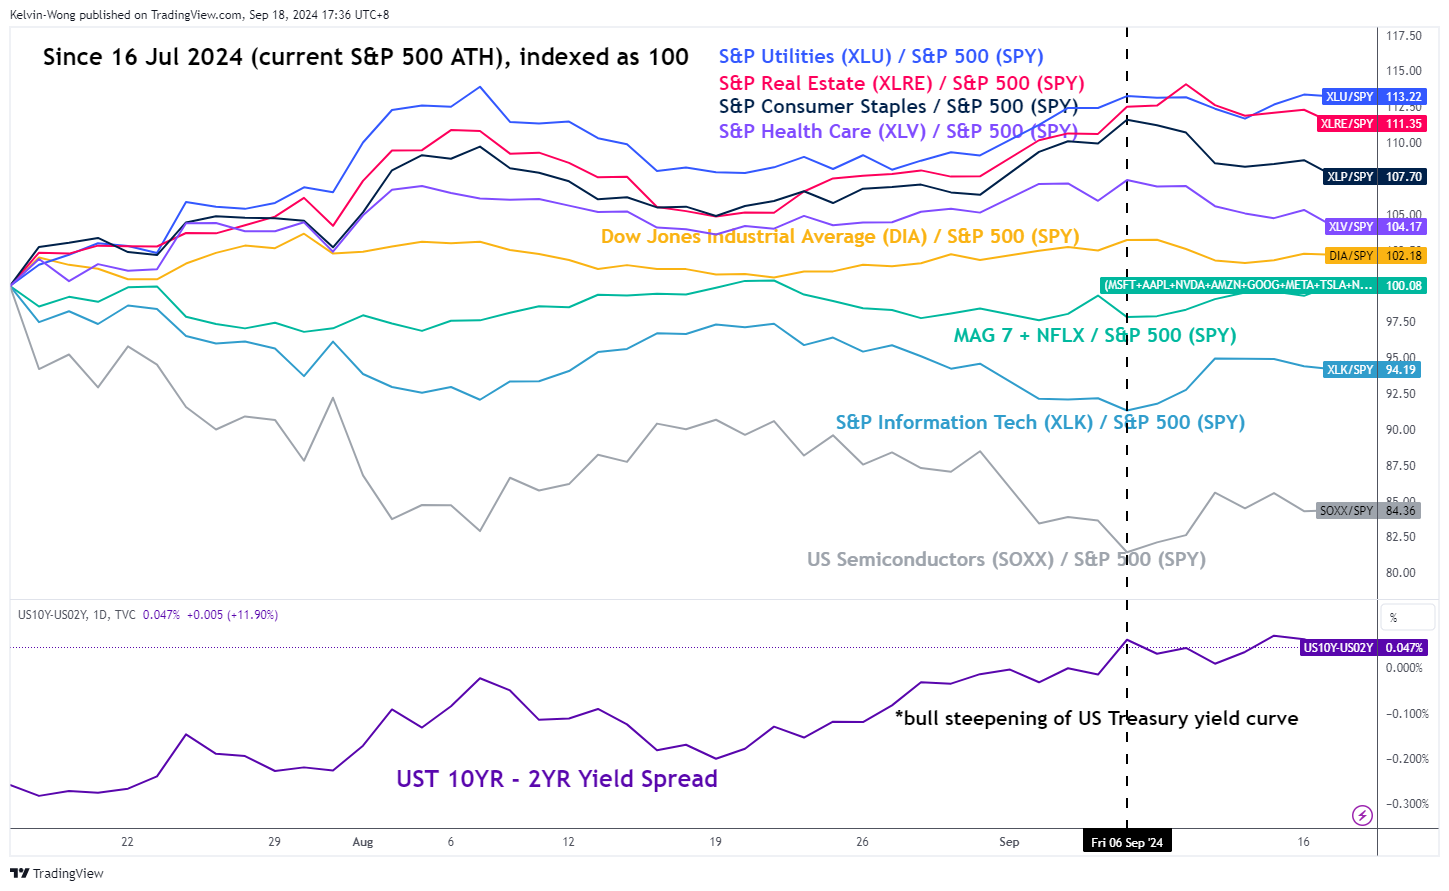
Fig 2: Relative strength of key S&P sectors, Magnificent 7 plus Netflix, US Semiconductors & DJIA against S&P 500 as of 18 Sep 2024 (Source: TradingView, click to enlarge chart)
The expected pace of cuts to bring down the Fed funds rate to 2.75%-3.00% from a year now to just a whisker above the 2.5% median long-run projection pencilled in the previous economic “dot-plot” projections released on the prior June FOMC meeting suggests a recessionary environment in the US.
The US Treasury yield curve (10-year minus 2-year) has un-inverted from more than two years of inversion on 6 September where the 2-year US Treasury yield fell at a faster pace versus the drop of the longer-term10-year Treasury yield.
Concurrently, since the current all-time high of the S&P 500 printed on 16 July 2024, the higher beta Information Technology sector, mega-cap seven cohort plus Netflix, and Semiconductor industry group that were leaders in the past two years of bull run seen in the S&P 500 have now underperformed (see Fig 2).
In contrast, the defensive sectors; Utilities, Real Estate, Consumer Staples, and Health Care have outperformed the S&P 500, together with the Dow Jones Industrial Average which has a lower combined weightage in three of the mega-cap seven stocks (Apple, Amazon, Alphabet, Meta, Microsoft, Nvidia, and Tesla) that represents a significant weightage in the S&P 500, and Nasdaq 100.
The impulsive upmove sequence from the 5 August low remains intact in DJIA
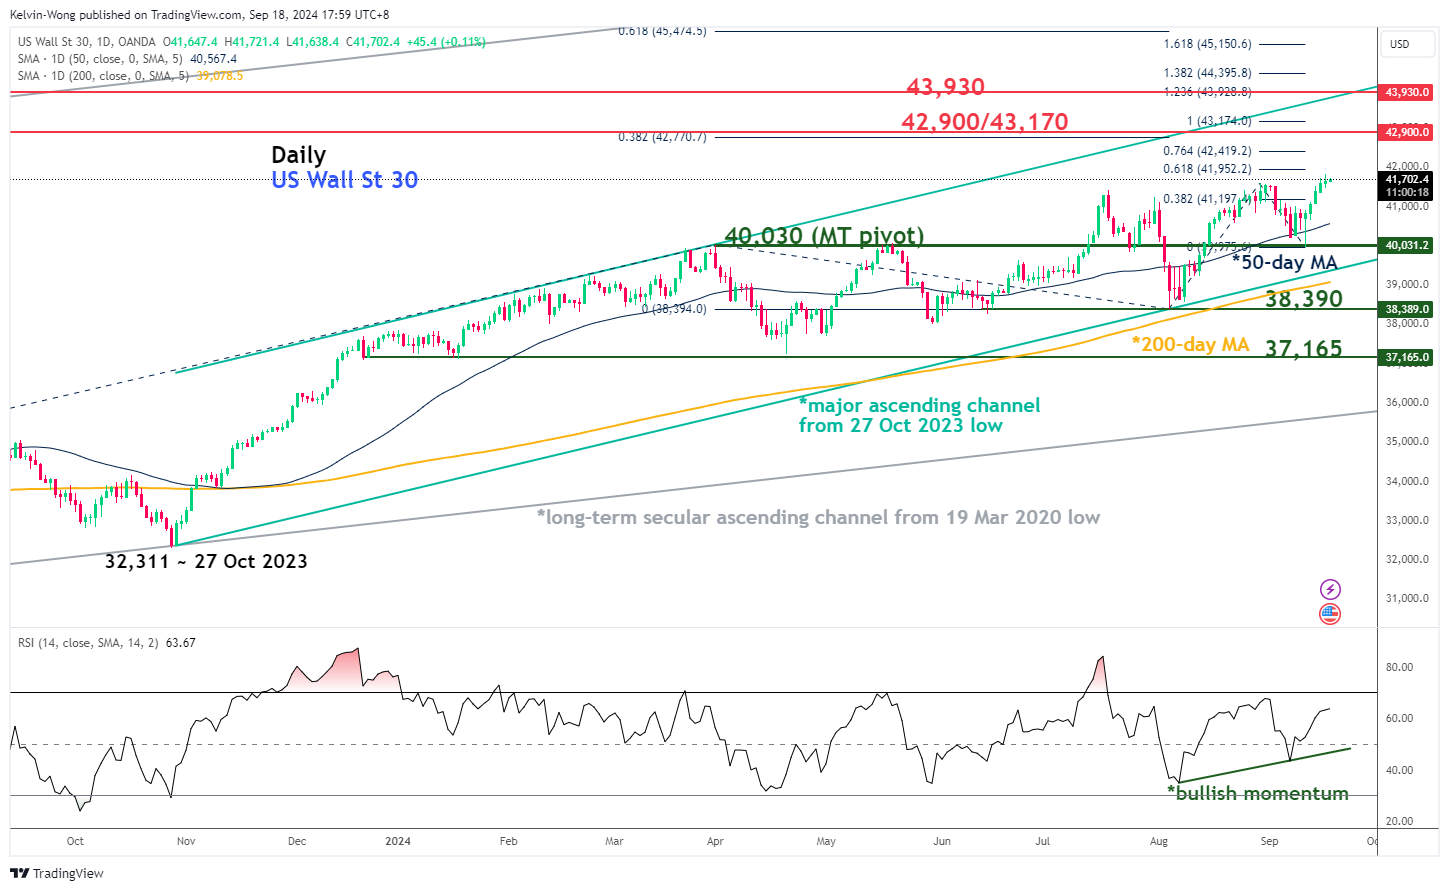
Fig 3: US Wall Street 30 major & medium-term trends as of 18 Sep 2024 (Source: TradingView, click to enlarge chart)
Based on the current price actions of the US Wall Street 30 CFD Index (a proxy of the DJIA futures), the impulsive upmove sequence from the 5 August 2024 low of its major uptrend phase in place since the 27 October 2023 low remains intact.
In addition, the daily RSI momentum indicator has continued to flash out a bullish momentum condition that reinforces the impulsive price action movements.
If the 40,030 key medium-term pivotal support holds, the Index may see the next medium-term resistances coming in at 42,900/43,170 and 43,930 next (also the upper boundary of the major ascending channel from the 27 October 2023 low) (see Fig 3).
On the other hand, a break below 40,030 invalidates the bullish scenario to trigger a potential medium-term corrective decline that may expose the next medium-term supports at 38,390 and 37,165.
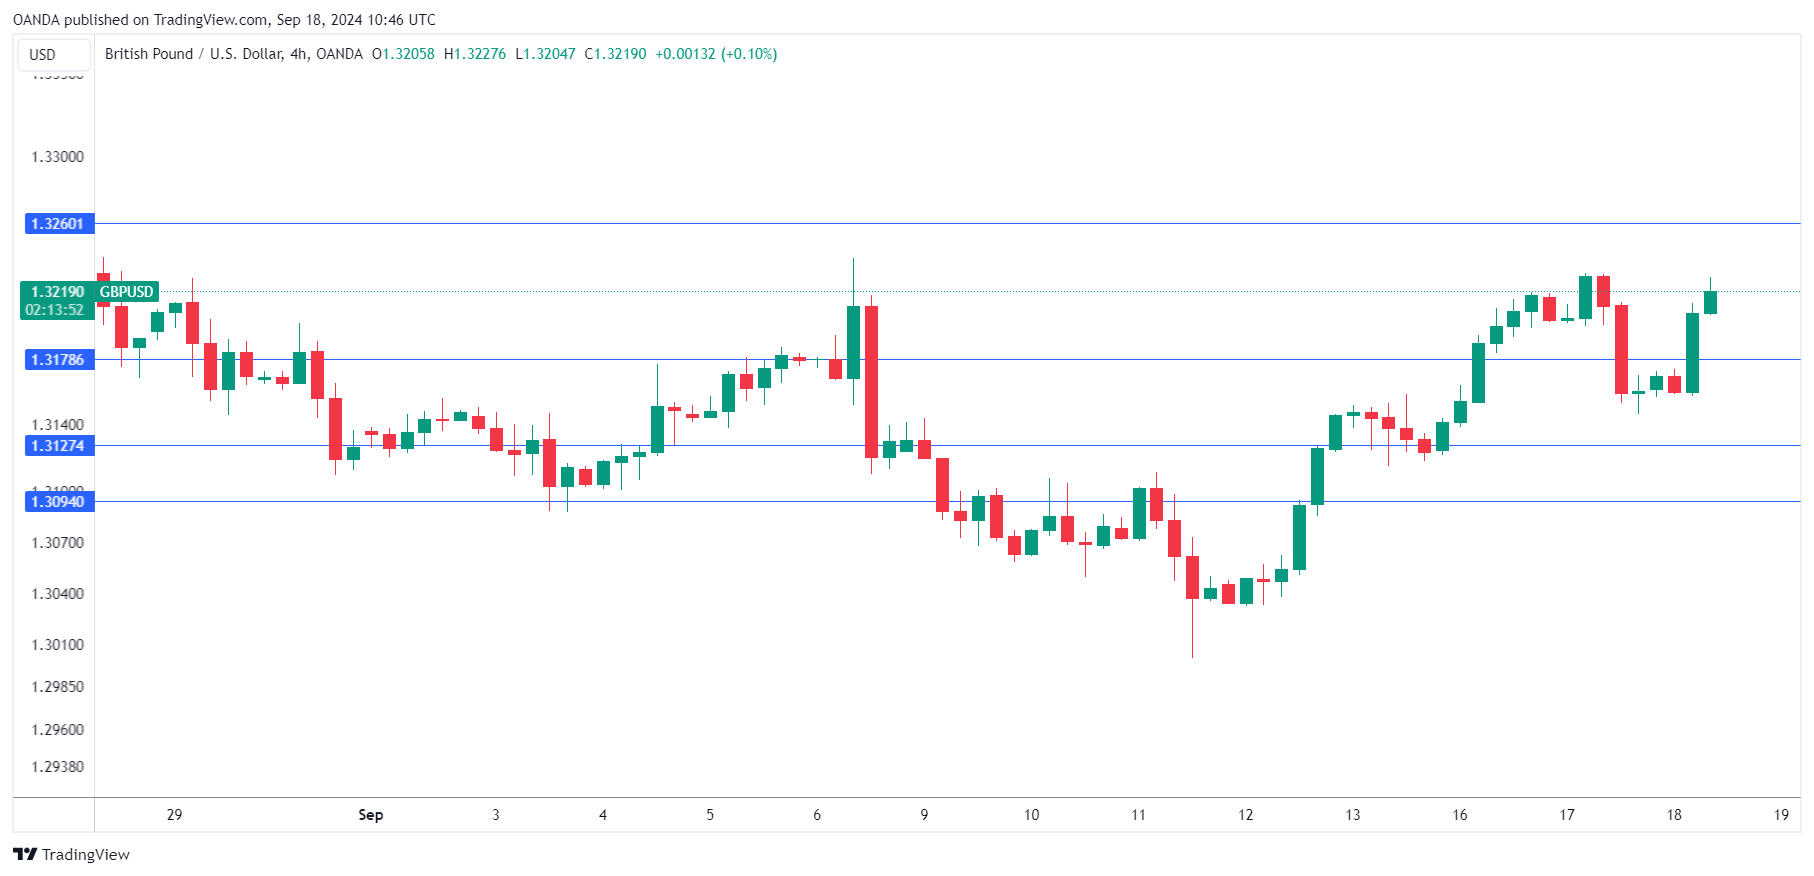
British Pound Rises as Core CPI Jumps
The British pound has gained ground on Wednesday. In the European session, GBP/USD is trading at 1.3224, up 0.48% on the day.
UK core inflation surprises to the upside
First, the good news. UK headline inflation remained unchanged at 2.2% y/y in August, and matched the market estimate. The Bank of England had estimated that inflation would rise by 2.4%. Gasoline prices fell but this was offset by an increase in air fares. Monthly, headline inflation rose to 0.3%, up from -0.2% in July and in line with the market estimate.
The core inflation rate, which is a better gauge of inflation trends, showed a significant increase. Yearly, core inflation rose to 3.6%, up from 3.3% and above the market estimate of 3.5%. Monthly, the core rate climbed 0.4%, up from an upwardly revised 0.1% in July and matching the market estimate. Services inflation, which the Bank of England closely watches, rose from 5.2% to 5.6%.
The mixed inflation data isn’t expected to change minds at the BoE, which meets on Thursday. The central bank kicked off the new rate-cutting cycle on August 1 but is expected to maintain rates on Thursday. Inflation is moving in the right direction but services inflation remains a serious concern, given that the BoE’s inflation target is 2%.
All eyes on Mr. Powell
There’s little doubt that the Federal Reserve will finally join the rate-cutting club at today’s meeting, but will the cut be 25 or 50 basis points? Market pricing has been all over the map, which has only added to the anticipation and the suspense. A week ago, the odds of a 50-bps cut were just 14%; that has flipped to 65% currently, according the CME’s FedWatch. Investors will also be keenly interested in the ‘dot plot’ a projection of the FOMC’s outlook for interest rates.
GBP/USD Technical
- GBP/USD has pushed above resistance at 1.3178 and 1.3260
- 1.3127 and 1.3094 are providing support
Sunset Market Commentary
Markets
Focus this morning briefly turned from this evening’s Fed meeting to tomorrow’s BoE policy decision following August UK CPI data. The report was almost exactly in line with expectations. Headline inflation rose 0.3% M/M and 2.2% (from -0.2% M/M and 2.2% in July). Core inflation reaccelerated to 0.5% M/M and 3.6% Y/Y (from 0.1% and 3.3%). Similar story applied to services prices rising by 0.4% M/M and 5.6% Y/Y (from 0.5% and 5.2%). While core services inflation is affected by some highly volatile components like airfares, today’s data still show too much stickiness for the Bank of England to take another advance on the hoped-for further cooling of inflation. Admittedly, at least part of the MPC is probably keen to turn the focus from inflation to growth. A new reassessment can only take place on the basis of the next Monetary policy report at the November 7 policy meeting. UK gilts underperformed Bunds and Treasuries with yields rising 6 7 bps across the curve. Markets for now only see room for further gradual easing by 25 bps steps in Q4 and Q1 next year. Sterling outperforms the dollar (GBP/USD 1.3215) and the euro (EUR/GBP 0.8415 from 0.8430). A test of the 0.8400/0.8383 support area might be on the cards. Even so, if the BoE holds such cautious approach against the background of weak UK activity data stay weak (cf last week’s rather poor July production/GDP data), it’s doubtful that ‘longer-lasting’ interest rate support will be a big help for sustained further sterling gains.
In global markets outside the UK, the countdown to this evening’s Fed interest rate decision caused some further mild profit taking on recent protracted easing bets. US yields add between 2 bps (2-y) and 3.5 bps (30-y). German Bunds slightly underperform treasuries with yields rising between 2.5 bps (2-y) and 5.5 bps (30-y). ECB Nagel, while supporting the start of easing, indicated that the ECB will have to show ‘staying power’ to fully reach to 2% target. In this process, he warned that policy rates certainly won’t go down as quickly and sharply as they went up. The dollar is losing a few ticks (DXY 100.8, EUR/USD 1.1135, USD/JPY 141.75). Equities show no clear trend (Eurostoxx -0.4%, S&P 500 unchanged) With respect to this evening’s Fed decision, we prefer a scenario of Powell and co starting with a substantial reduction of policy restriction (50 bps) to avoid an unnecessary weakening of the labour market. Current high policy yield levels allow to do so. It still leaves the Fed the option to make a revaluation on both inflation and growth with the policy rate above neutral (end this year/early next year). In this scenario, an assumed additional cumulative 75 bps of easing signaled in the median dot plot for the remainder of the year might still support recent dynamics of markets staying asymmetrically sensitive to softer than expected activity/labour market data. The message from the dots for 2025 might be much less aggressive than what markets are currently discounting, but it’s probably too early as a driver for markets in the near term. In this context we also stay cautious on the dollar.
News & Views
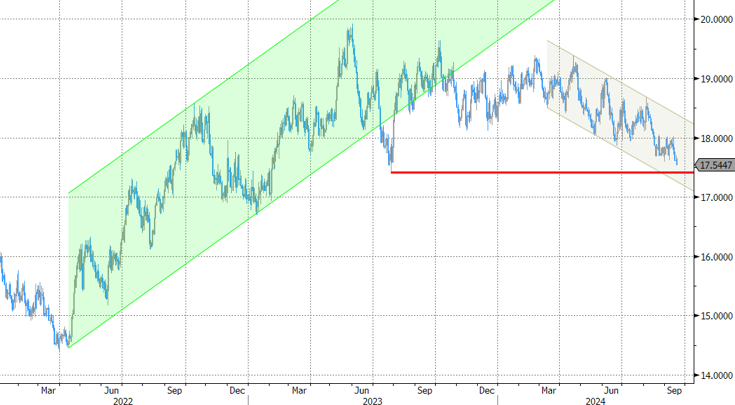
South African inflation slowed to 0.1% M/M in August from 0.4% in July and below 0.2% consensus. In Y/Y-terms, headline inflation fell below the 4.5%-midpoint of the South African central bank’s inflation target (3%-6%) for the first time since April 2021. Core inflation was flat in August but slowed from 4.3% Y/Y to 4.1%. Today’s benign inflation print cements the case for a first 25 bps by the SARB since hitting the current peak at 8.25% in May of last year. Fortunes of the South-African rand improved since the start of the summer on global USD-weakness as markets prepare for less restrictive monetary conditions. Emerging market currencies tend to profit from these prospects in general. USD/ZAR is setting new YTD lows today below 17.60.
US housing starts rebounded by 9.6% M/M in August, coming off a 6.9% drop in July. In absolute numbers, the 1356k annualized rate is the highest since April. New construction of single-family homes increased almost 16% to an annualized 992k pace (3 month best). Starts of multifamily projects declined for the first time since May. Overall building permits, a pointer for future construction, rose by 4.9% M/M (from -3.3% M/M) with the annualized rate of 1475k being the best since March. Both figures beat market consensus..
Graphs
EUR/GBP: Sterling outperforms the euro (and the dollar) as BoE for now has little room to cut interest rates aggressively.
USD/ZAR: rand profits from easing of global financial condtions even as softer inflation opens the door to SARB easing.
US 2y yield: Markets await Fed’s ‘nihil obstat’ to discount more frontloading
DXY TW USD ready to attack key support