Sample Category Title
Events, My Dear Readers, Events
It helps to have a framework for thinking through the different events that might come along and surprise us. Some things are just lumps and bumps along the way, while others are genuinely forks in the path ahead.
The past few weeks have been big ones for news. An assassination attempt, a Presidential withdrawal and a global cyber-botch. Not to mention a string of elections in other countries in prior weeks. Aside from the salutary reminder that we should never attribute to conspiracy something that could as easily be a stuff-up, recent events have highlighted that unexpected events can occur, and that even things that were well-anticipated can have surprising consequences. As former UK Prime Minister Harold Macmillan famously said, the biggest issues he needed to deal with were ‘Events, my dear boy, events’.
It helps to have a framework for thinking through the events that might come along and surprise us. Some years ago, in another life, I tried to develop one, dividing things up into lumps, bumps and waves.
Lumps, bumps, waves …
Perhaps easiest to understand are the lumps and bumps. The ‘lumps’ are the single factors that are big enough to shift the total even though they are not representative. You can see the role they play when forming a view about very near-term outcomes. In the broader scheme of things, inflation is driven by macro-level factors, the balance of aggregate demand and aggregate supply. But in working out what you expect the next CPI result to print, you need to allow for all the individual components that could shift the total. This is why Westpac Economics Senior Economist Justin Smirk’s preview of next week’s CPI release covered specific factors such as electricity rebates and the timing of end of financial year sales. In ‘now-casting’, a ‘bottom-up’ view can be very helpful.
The ‘bumps’ are temporary special factors like cyclones or other disruptions. In a world where supply shocks are more prominent, thinking through the effects of these bumps will be something we all need to do more often.
Bumps are not always short-lived. A good example of a bump that is playing out over several years is the drop and then surge in population growth resulting from the closure of Australia’s international borders during the pandemic and subsequent reopening. The peak in population growth was last year, partly because China’s borders had just reopened. It will take a couple of years before population growth reverts to its pre-pandemic norm. In the meantime, the housing market is under pressure. Even allowing for some increase in average household size back to its pre-pandemic level, rental vacancy rates will remain low for a while, and rent growth in the CPI elevated.
A challenge for policy in all of this is that one needs to recognise where the aggregate numbers are being pushed around by one-offs and unrepresentative influences. At the same time, one cannot dismiss these effects entirely. Simply excluding all the one-off things that are boosting inflation, for example, can mean one ends up with an inappropriately sanguine view of the underlying trend.
We also need to pay attention to the ‘waves’ – the big shifts that can change the underlying structure of the economy. Typically these stem from demographic shifts or regulatory or technological developments.
Sometimes these waves are transitions to a new normal. The process of urbanisation underway in China is a good example of such a transition. The end of a transition can be especially challenging to navigate. People get used to the way things work during the transition phase, and do not anticipate that it will not last forever. This is especially so for the leveraging phase that typically follows deregulation of the financial sector. The crises and near-crises in Japan, Scandinavia and Australia in the early 1990s and in Asia in the late 1990s are all examples of how that can play out badly. It can also be hard to stick the landing when converging to a higher standard of living, as Ireland and Spain found after joining the Euro Area and converging to Euro Area living standards.
Another challenge with the truly important waves is that even when we recognise a wave is occurring, we might misread its broader implications. As I pointed out in that speech in 2019, it is often assumed that the ageing of the population means that participation in the labour force will decline and the workforces of advanced economies will shrink. In fact, with the notable exception of the United States, the reverse is happening. (This trend, and the US exception to it, is a topic for a future note.) Similarly, it is often assumed that technological change boosting productivity in one sector more than others will result in that sector expanding. That may be true for output, but the history of agricultural and manufacturing employment shows the opposite.
…and forks
With the benefit of a few more years, it has become clear that some events are best understood not as lumps, bumps or waves, but as forks in the road. A particular threshold event occurs with two or more possible future outcomes. Once it occurs, it closes off some potential futures, and sets us on one path. While this is not the superposition of possible states of a Schrödinger’s cat, we know that, for example, come November the cat will either be red or blue. The reunification of Germany was another good example.
Resolution of this kind of event uncertainty can shift market pricing considerably. Before the event pricing needs to cover a range of possible futures. Once some paths are closed off, the chance they might occur is no longer priced in.
We must remember, though, that not every big event is a lasting wave or a fork. Sometimes they are just big bumps, and things return to where they were before. And even if something is genuinely a fork, some aspects of the scenery along the path will be similar. For example, regardless of whether the November cat is red or blue, the United States will still be running enormous fiscal deficits in some form. That has implications for the global structure of interest rates. And in time, decisionmakers in that country may well face another fork in the road as a consequence.
Elliott Wave Intraday Analysis: CHFJPY Bouncing Higher from Support Zone
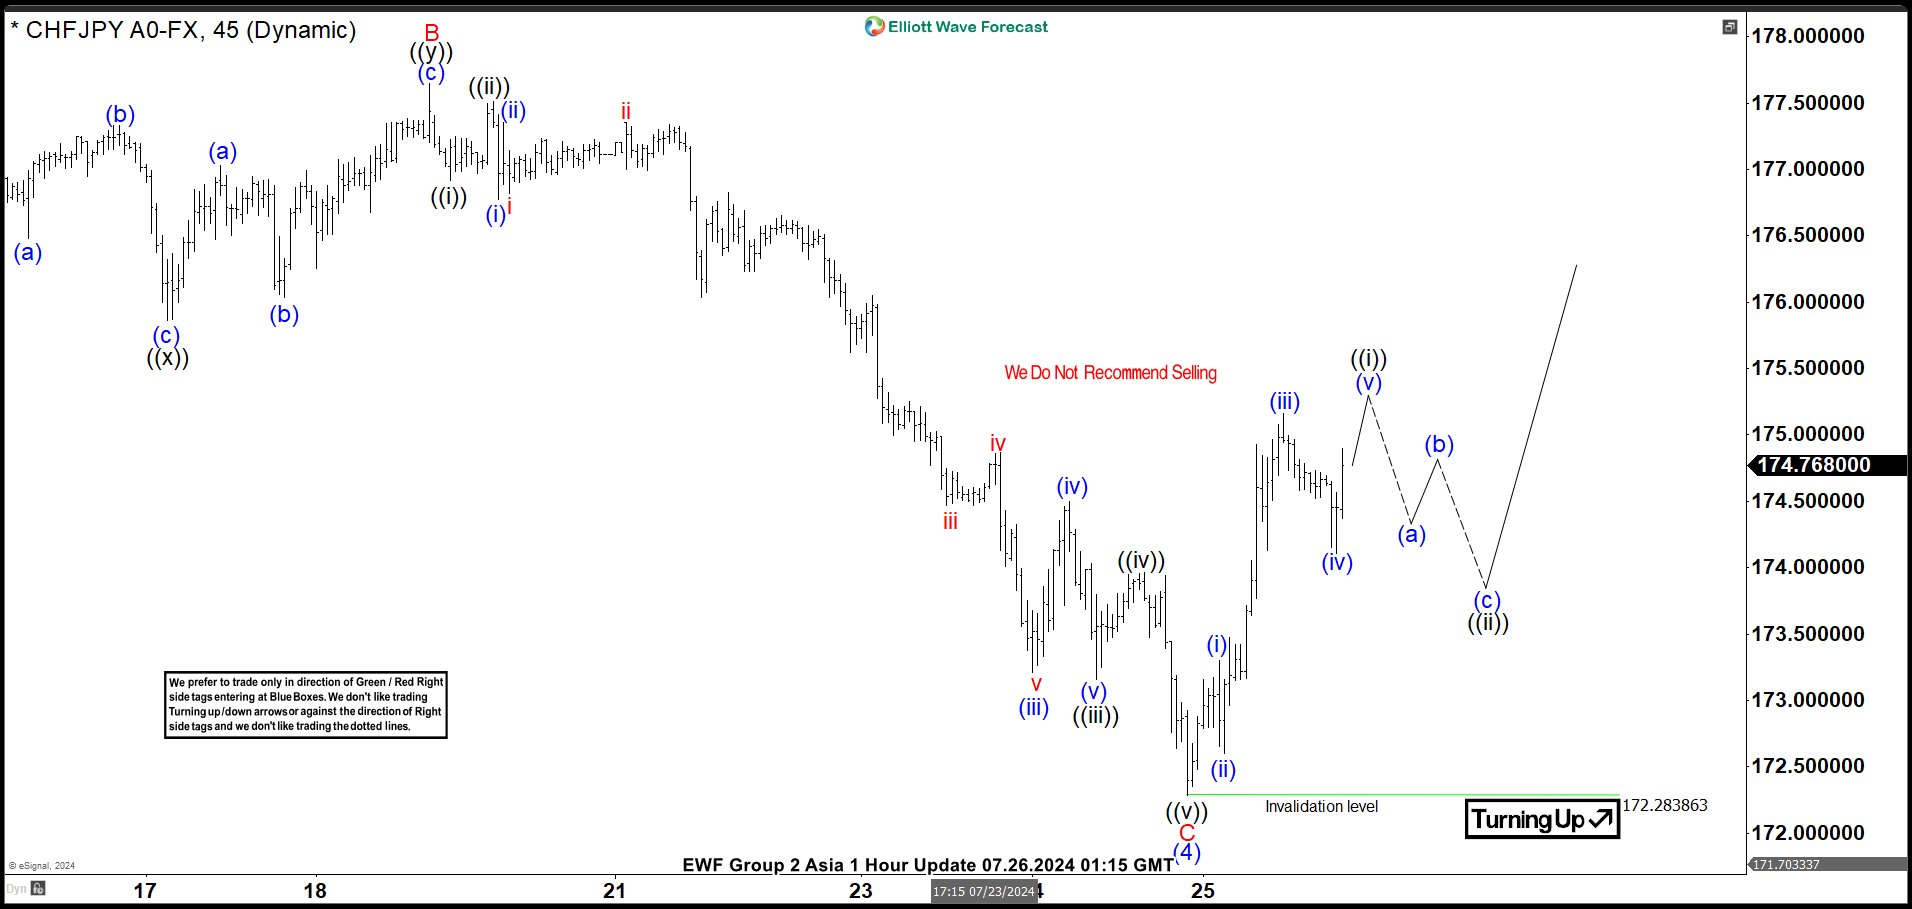
Short Term Elliott Wave view in CHFJPY suggests the decline from 7.11.2024 high unfolded as a zigzag structure. Down from 7.11.2024 high, wave A ended at 175.84 and rally in wave B ended at 177.64. The pair then extended lower in wave C with internal subdivision as an impulse. Down from wave B, wave ((i)) ended at 176.91 and rally in wave ((ii)) ended at 177.51. Pair then extended lower again in wave ((iii)) towards 173.15 and bounce in wave ((iv)) ended at 173.96. Final leg wave ((v)) lower ended at 172.28 which completed wave C of (4).
Pair has turned higher in wave (5). Up from wave (4), wave (i) ended at 173.3 and pullback in wave (ii) ended at 172.6. Pair then rallied higher in wave (iii) towards 175.15 and pullback in wave (iv) ended at 174.11. Expect pair to extend higher in wave (v) which should complete wave ((i)) in higher degree. It then should pullback in wave ((ii)) to correct cycle from 7.25.2024 low before the rally resumes. Near term, as far as pivot at 172.28 low stays intact, expect dips to find buyers in 3, 7, or 11 swing for further upside.
CHFJPY 60 Minutes Elliott Wave Chart
CHFJPY Elliott Wave Video
https://www.youtube.com/watch?v=vBQKjtfX82s
Tokyo CPI core rises, but core-core falls; BoJ rate hike uncertainty persists
Japan's Tokyo CPI core (excluding food) increased from 2.1% yoy to 2.2% yoy in July, aligning with market expectations. This marks the third consecutive month of re-acceleration following a dip to 1.6% yoy in April. The primary driver of this uptick was energy prices, with electricity costs soaring by 19.7% yoy due to the termination of government utility subsidies.
However, other inflation measures showed a slowdown. CPI core-core (excluding food and energy) dropped from 1.8% yoy to 1.5% yoy. Additionally, services inflation decreased from 0.9% yoy to 0.5% yoy, while headline CPI fell slightly from 2.3% yoy to 2.2% yoy.
The increase in core inflation maintains the possibility of a BoJ rate hike next week. However, the current data is not sufficiently conclusive to confirm this outcome. Swap markets indicate a 38% probability of a 15bps hike. A Bloomberg survey reveals that 30% of BoJ watchers anticipate a hike, with 90% viewing it as a potential risk.
USD/JPY Recovery Faces Challenges: What to Watch For
Key Highlights
- USD/JPY declined heavily before the bulls appeared near 152.00.
- A major bearish trend line is forming with resistance at 155.50 on the 4-hour chart.
- Crude oil prices remain at risk of more downsides toward $75.00.
- Ethereum saw bearish moves and might continue lower.
USD/JPY Technical Analysis
The US Dollar started a major decline from well above 158.00 against the Japanese Yen. USD/JPY declined below the 156.50 support to enter a bearish zone.
Looking at the 4-hour chart, the pair even settled below the 155.50 support, the 100 simple moving average (red, 4-hour), and the 200 simple moving average (green, 4-hour). Finally, the pair tested the 152.00 support.
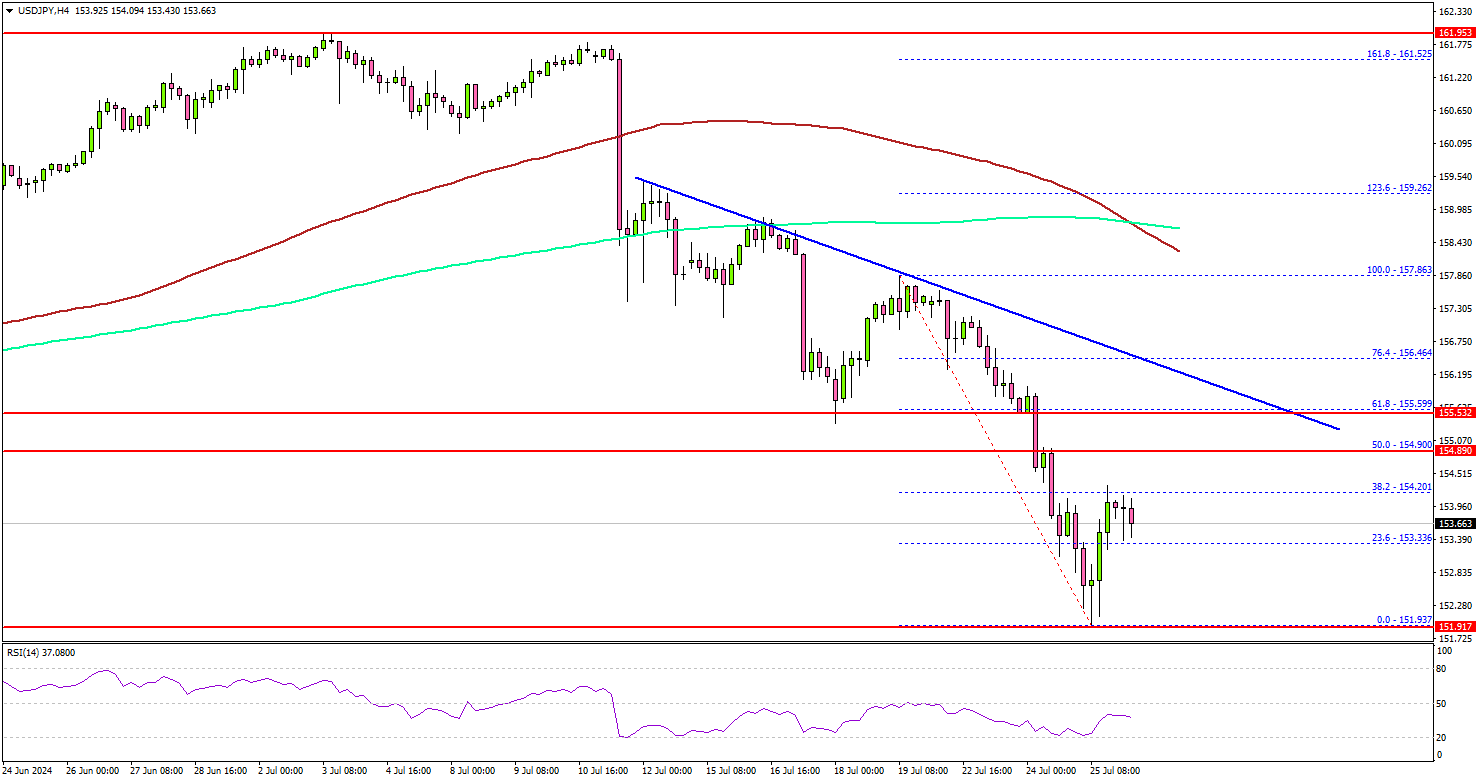
A low was formed at 151.93 before the pair started a decent recovery wave. The pair climbed above the 153.20 level. It surpassed the 23.6% Fib retracement level of the downward move from the 157.86 swing high to the 151.93 low.
On the upside, the pair could face resistance near the 154.20 level. The next resistance sits at 155.00 or the 50% Fib retracement level of the downward move from the 157.86 swing high to the 151.93 low.
The main hurdle sits at 155.50 and a bearish trend line on the same chart. A clear move above the 155.50 resistance might send it toward the 156.20 level. Any more gains might open the doors for a test of the 157.50 zone in the coming days.
Immediate support is near the 152.80 level. The next major support is near the 152.00 level. A downside break and close below the 152.00 support zone could open the doors for more losses. In the stated case, USD/JPY might decline toward the 150.50 level.
Looking at Ethereum, there was a sharp bearish reaction below the $3,350 support zone. If the bears remain in action, ETH could even test $3,020.
Economic Releases
- US Personal Income for June 2024 (MoM) - Forecast +0.4%, versus +0.5% previous.
- US Core Personal Consumption Expenditure for June 2024 (MoM) - Forecast +0.1%, versus +0.1% previous.
EURJPY Wave Analysis
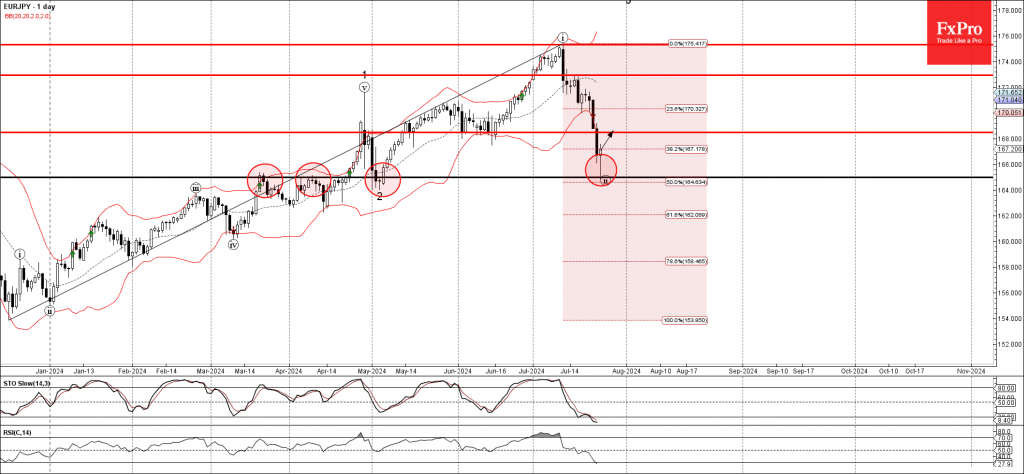
- EURJPY reversed from support level 165.00
- Likely to rise to resistance level 168.00
EURJPY currency pair recently reversed up from the pivotal support level 165.00 (former strong resistance from March and April, which also stopped the previous correction 2 at the start of May).
The support level 165.00 was strengthened by the 50% Fibonacci correction of the previous sharp uptrend from December.
Given the clear uptrend, EURJPY currency pair can be expected to rise further to the next resistance level 168.00 (former strong support from May and June).
USDCAD Wave Analysis
- USDCAD reversed from long-term resistance level 1.3850
- Likely to fall to support level 1.3760
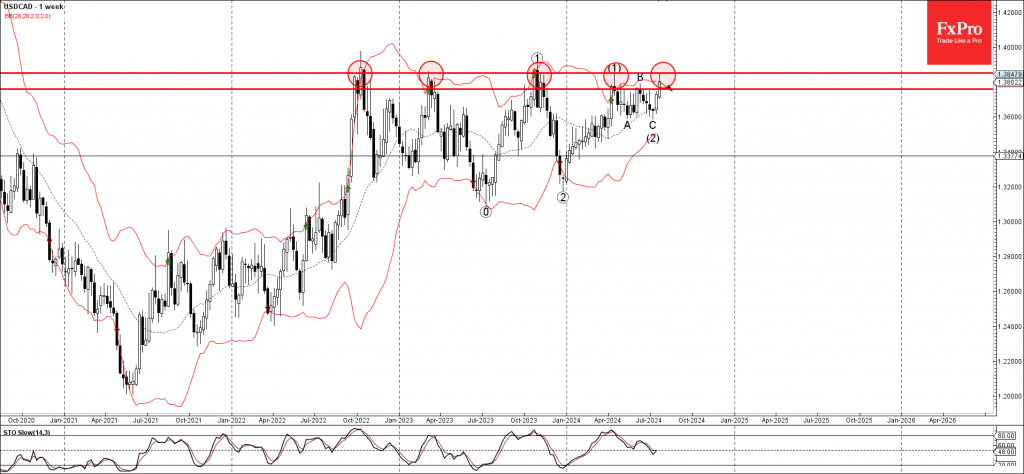
USDCAD currency pair is under bearish pressure after previously reversing from the long-term resistance level 1.3850 (which has been repeatedly reversing the price from the end of 2022, as can be seen below).
The resistance level 1.3850 was strengthened by the nearby upper daily and the weekly Bollinger Bands.
Given the strength of the resistance level 1.3850 and the clear bearish divergence on the weekly Stochastic indicator, USDCAD currency pair can be expected to fall further to the next support level 1.3760.
What to Expect from Markets in the Run Up to US Elections?
- Presidential race dominates headlines and complicates Fed’s job
- Equities suffered in the two months leading up to the last six presidential elections
- Market’s performance in the 2016 pre-election period could be a useful guide
- Dollar strengthened in 2016 but equities were under pressure
Significant developments in the race lately
The recent gun attack against Donald Trump and US President Biden's candidacy withdrawal last weekend have raised even more the profile of the November presidential election. As a result, the market is starting to price in an increased possibility of Trump returning to the White House for a second term.
In these volatile conditions, the Fed is facing an uphill battle to implement its strategy. The market is currently fully pricing in a 25bps rate cut in September, the first rate cut since March 2020, despite data remaining strong. In a recent special report focusing on the pre-Fed meeting performance of key market assets, a strong resemblance of current price action to the 2006-07 period was identified.
This means that should history repeat itself, the S&P 500 index could experience a sizable correction, the drop in US 10-year yield could have legs and the yen could benefit further against the US dollar in the run up to the September Fed gathering.
Interestingly, it is the first since 2000 that the Fed is preparing to start a monetary policy easing cycle in the period leading up to the US Presidential election. Back in 2000, Chairman Greenspan opted to maintain the Fed's stance, despite the evident economic slowdown, to avoid criticism about interfering in the election.
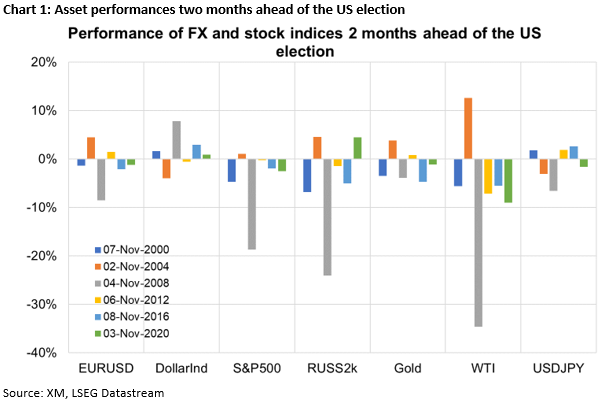
Returning to the November elections and the performance of key market assets in the two months leading up to the US election was examined, using data from the last six US Presidential elections. A number of questions were posed. Are there any assets that benefit from the pre-election uncertainty? Are there any specific S&P 500 sectors that feel jittery in this period? Additionally, what did the market do in 2016, ahead of the election won by Donald Trump?
Asset performances two months ahead of the US election
Digging through the data, some interesting, mostly negative, trends can be identified. More specifically, WTI oil futures show a tendency to drop by 5.5%-12.6% in the run up to the election. Similarly, the S&P 500 equity index dropped by 0.3%-18.7% in five of the past six elections, revealing a certain degree of anxiety among investors. Chart 1 below presents the detailed results.
S&P 500 subsectors performance
Looking under the hood, the analysis showed a mixed performance by the eleven sectors comprising the S&P 500 index. Interestingly, the real estate, consumer staples and communication services stocks tend to react more negatively to election uncertainty. Chart 2 portrays these sectors and their respective pre-election performance.

It sounds reasonable that elections tend to affect stocks more than other asset classes. Big risk events negatively affect consumer sentiment, delay business investments and generally force corporations to postpone important decisions until after the election when they will have a clearer view of the new administration in place.
Interestingly, the dollar does not exhibit a clear-cut pattern with the dollar index being in the green in the pre-election periods of 2000, 2008, 2016 and 2022 but suffering in both 2004 and 2012. On the flip side, the 10-year US yield tends to increase by 7.5-26bps in the last two months before the election process, possibly on the back of campaign talk about increased public spending.
What happened in 2016 when Trump was a candidate?
Since Trump is trying to return to the Oval Office, the market's performance in the two months leading up to the 2016 US election should be examined more closely. Chart 3 below displays the performance of certain market assets going for the aforementioned period.
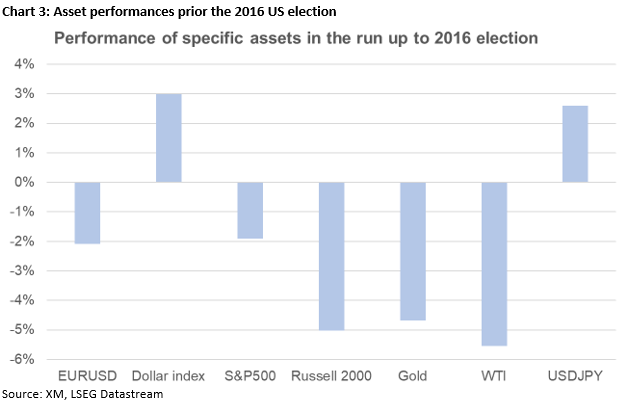
The dollar strengthened into the election as made evident by euro/dollar, dollar/yen and the dollar index. This dollar outperformance could partly explain the strong correction seen in both gold and WTI oil prices in the same period. In the meantime, the S&P 500 index managed to drop by around 2% going into the November 2016 election with the Russell 2000 index suffering the most.
Fed Preview: Opening the Door But Not Pre-committing
- We expect the Federal Reserve to maintain its monetary policy unchanged next week. Focus will be on upcoming rate cuts, which we expect to begin in September.
- The two latest CPI prints have built significant confidence in inflation remaining en route to target, but with the economy still on a stable footing, we doubt Powell feels the need to pre-commit to rate cuts quite yet.
- We expect the Fed to cut rates twice by 25bp this year, while markets price in a cumulative 64bp of cuts by year-end. We see risks skewed towards modestly higher short-end rates and lower EUR/USD during the press conference.
After Powell and Waller confirmed the Fed feels no urgency to cut rates just ahead of the blackout, markets have mostly priced out any speculation of a rate cut next week. With no new economic and rate projections on the agenda, the meeting's focus will be fully on any communication around the start of rate cuts later in the fall.
We still like our call for quarterly rate cuts starting from September, while markets have swung from pricing only one 25bp cut this year to now pricing a cumulative 64bp by year-end and 142bp over the next year. The Fed could deliver a faster series of cuts if it believes the economy is on a brink of an abrupt slowdown, but we do not believe this is the case today. We list three arguments for why the Fed is likely to opt for a more gradual pace:
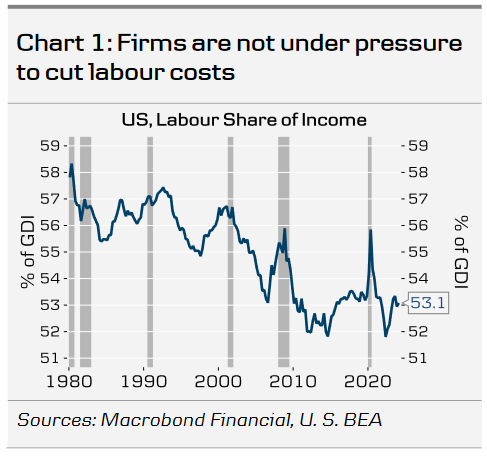
1). Labour markets are cooling, but not collapsing: The unemployment rate has risen to 4.1% from the low of 3.4% reached in April 2023, but largely as a result of rebounding labour supply. Number of layoffs remains historically low, because labour costs are not yet pressuring firms' margins, given that that labour share of income remains modest (Chart 1). Labour demand has normalized to pre-pandemic levels, but as long as firms hold on to their existing workforce, this is not a signal of recession to come.
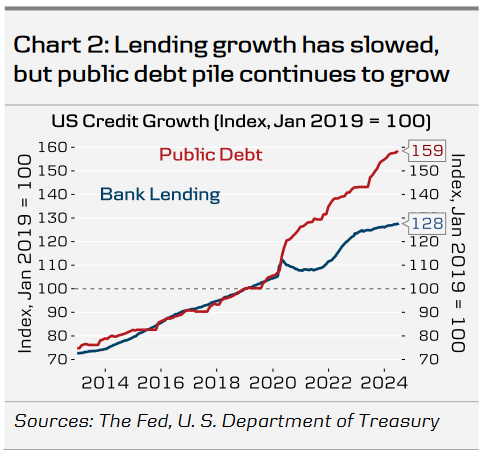
2). Fiscal policy continues to counteract tight monetary policy: Bank lending and broader credit growth remain muted, but rapid expansion in public debt continues to counteract the restrictive effect of higher rates (Chart 2). November election outlook will not materially impact the Fed's decision making over the 1-year horizon.
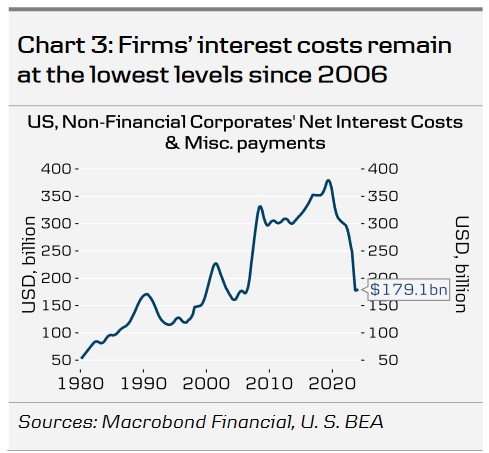
3). Fixed interest rates limit pressure on firms' margins: Non-financial corporates' net interest costs remain at post-GFC lows due to fixed-rate financing (Chart 3). High interest rates mean that expanding business is costly, but companies are not struggling with their existing loans for now. When firms are not pressured to cut costs, labour markets remain steady, in turn supporting consumer confidence.
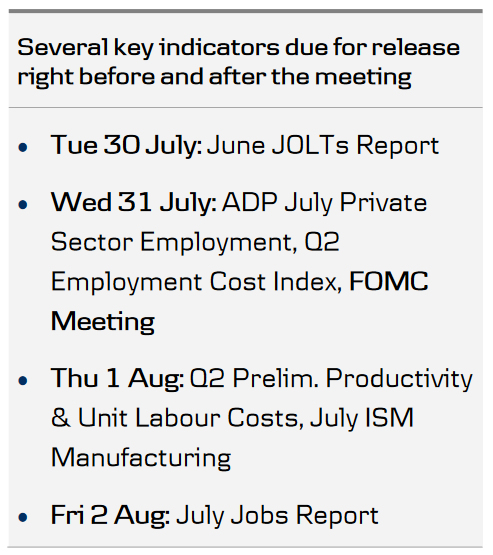
The Fed will have access to the results of Q3 Senior Loan Officer Opinion Survey (SLOOS, due for public release on 5 Aug), which we expect to signal still weak credit demand as real interest rates remain at restrictive levels. We pencil in gradual cooling in both economic activity and inflation towards year-end but do not foresee a recession. As such, we doubt Powell feels the need to pre-commit to rate cuts at this point, which could spark a modestly hawkish reaction in the markets. Any more explicit guidance towards cuts either in the press release or during the press conference would have the opposite effect.
Markets: We continue to favour lower EUR/USD
We think that the dovish repricing of Fed cuts over the summer is overdone, and therefore, we lean towards a slightly hawkish market reaction based on Powell's communication, which could lead to a lower EUR/USD during the press conference. While signs of disinflation are bolstering the Fed's confidence that rate cuts are imminent, there are still two months of data to consider before the September meeting. We expect rate cuts to begin in September, which also seems very likely as a 25bp cut is more than fully priced. However, any setbacks, particularly concerning inflation, pose risks that the 'higher for longer' scenario may continue longer than what the markets have recently priced in. We expect the EUR/USD to move towards 1.03 on a 12M horizon, driven by our expectation of stronger US growth dynamics.
USD/JPY – Yen on a Tear, US GDP Blows Past Forecast
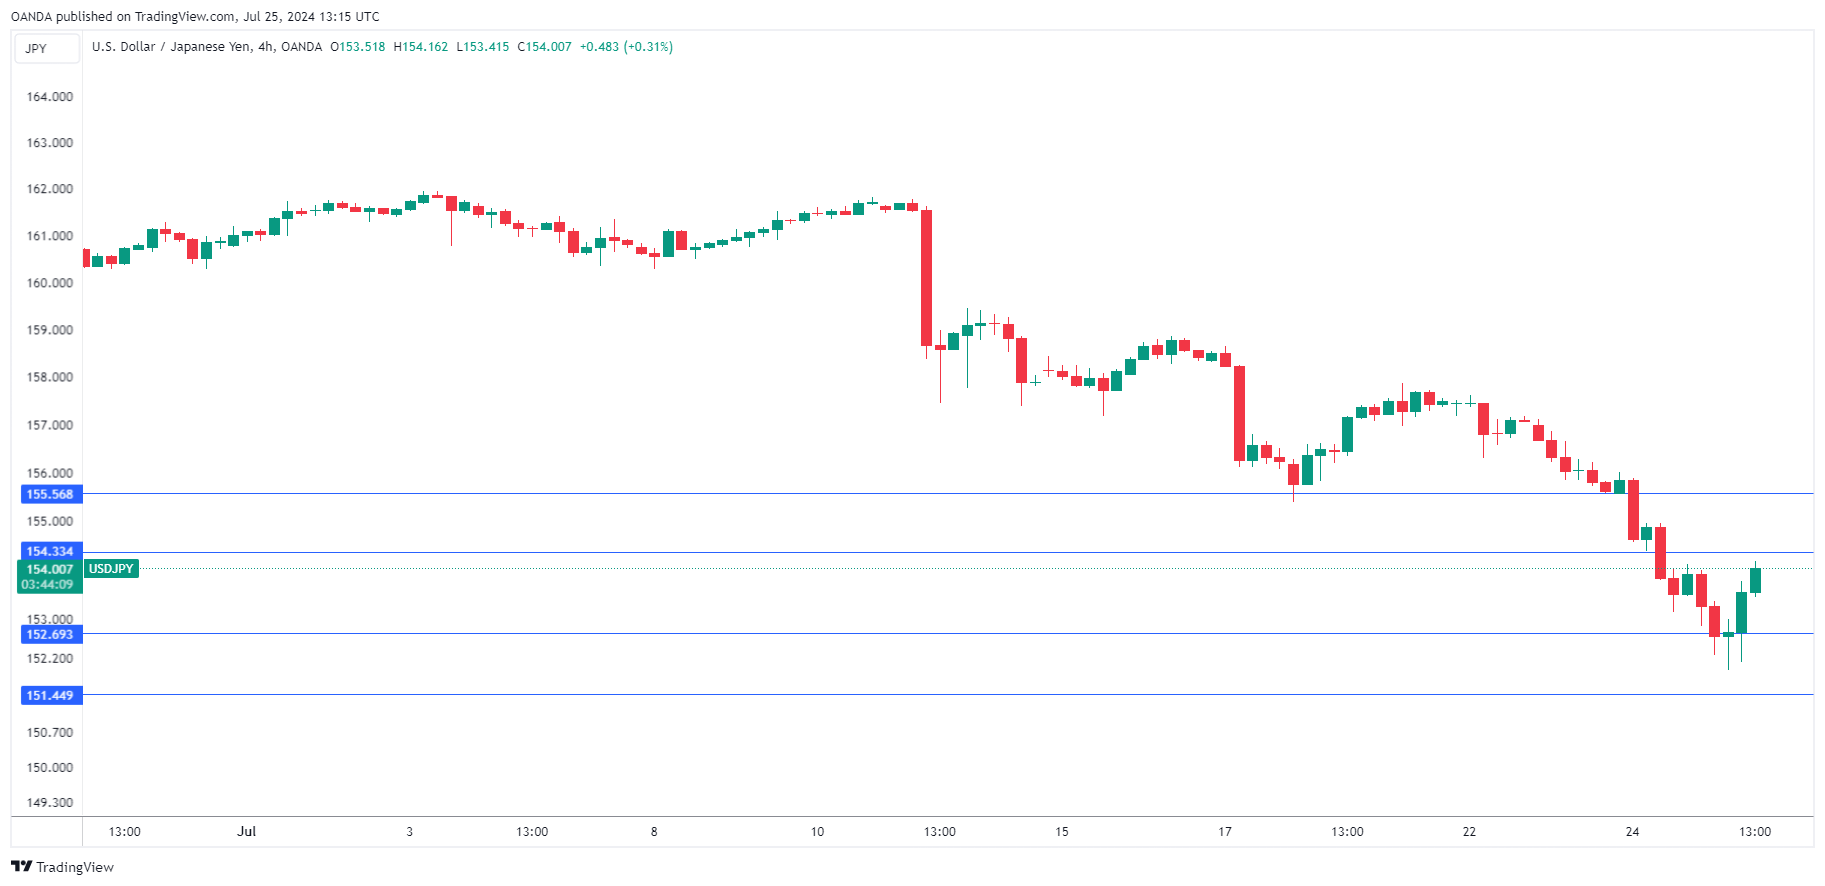
The Japanese yen continues to gain ground against the US dollar. USD/JPY is trading at 153.68 early in the North American session, down 0.14% on the day. Earlier today, USD/JPY fell as low as 151.93 (1.3%), its lowest level since May 3, before paring most of these losses. The yen has soared, rising 2.4% this week and a staggering 4.5% in the month of July.
Buzz around BoJ meeting
There’s plenty of buzz but also uncertainty in the air as the yen has gone on a torrid run against the hapless US dollar. The yen jumped 1.1% on Wednesday after a senior Japanese official urged the Bank of Japan to normalize policy. As well, the sharp drop in global tech stocks sent investors fleeing to traditional safe havens, including the Japanese yen.
The Bank of Japan meets on July 30-31 and it’s a close call as to whether it will stay on the sidelines or raise interest rates. The central bank is also expected to announce details of a plan to cut bond purchases in order to reduce its massive monetary stimulus.
The BoJ has hinted that a rate hike is coming, but the question of timing is up in the air. Core inflation rose to 2.6% in June and wages have climbed sharply, setting up the case for the central bank to raise rates. On the other side of the coin, consumer spending has been weak and inflation is relatively moderate.
US GDP climbs to 2.8%
The US economy climbed 2.8% y/y in the second quarter, double the 1.4% rate in the first quarter and blowing past the forecast of 2.0%. An increase in consumer spending helped drive the strong gain. On the inflation front, the personal consumption expenditures price index, a key measure for the Federal Reserve, eased to 2.6%, down from 3.4% in Q1.
.
USD/JPY Technical
- USD/JPY tested support at 152.68 earlier. Below, there is support at 151.45
- There is resistance at 154.33 and 155.56