

Sample Category Title
EUR/JPY Daily Outlook
Daily Pivots: (S1) 170.20; (P) 170.93; (R1) 171.79; More...
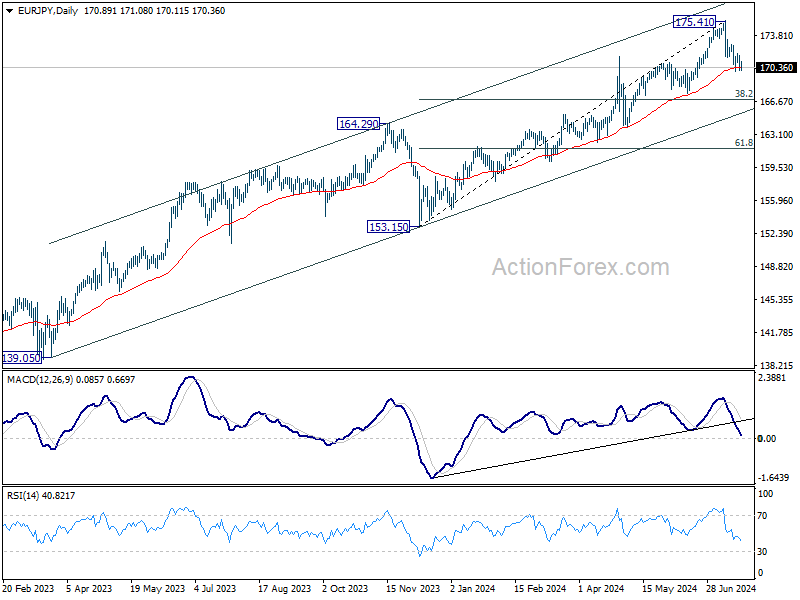
Range trading continues in EUR/JPY above 169.98 temporary low and intraday bias stays neutral. Further decline is expected as long as 172.91 resistance holds. Below 169.98 will target 38.2% retracement of 153.15 to 175.41 at 166.90, as a correction to whole rise from 153.15. On the upside, though, break of 172.91 resistance will revive near term bullishness and bring retest of 175.41 high.
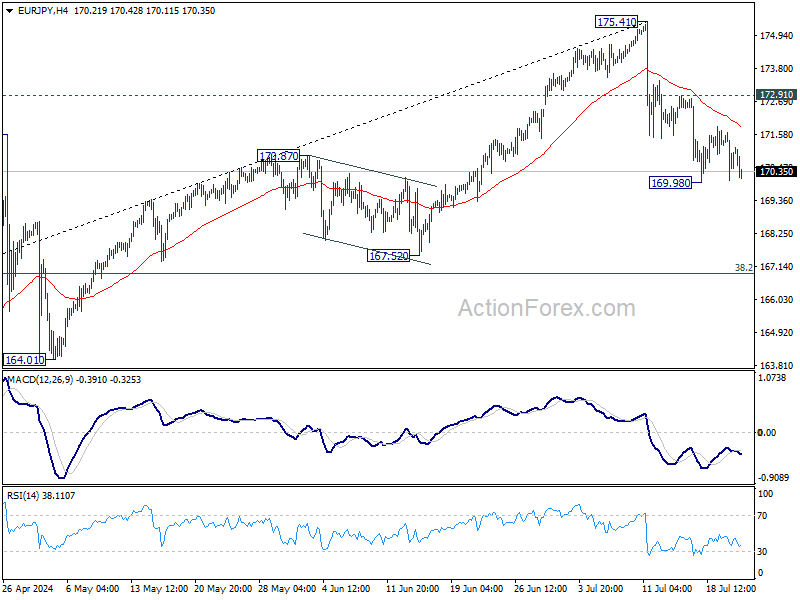
In the bigger picture, medium term outlook will stay bullish as long as 164.29 resistance turned support holds. Long term up trend is still in favor to continue through 175.41 at a later stage. However, firm break of 164.29 will be a strong sign of bearish trend reversal.
Big Tech Rebound Ahead of Earnings, Oil Slips
Week started on a bullish note in Europe and the US as Jow Biden’s decision to leave the presidential race didn’t impact the market mood. The S&P500 rebounded 1% following its worst week since April on a Big Tech selloff and on rising worries that a second term for Donald Trump in the White House would worsen the global trade relations. Nasdaq 100 gained more than 1.50% as Magnificent 7 climbed 2.5% led by a nearly 5% jump in Nvidia and a more than 5% jump in Tesla.
Tesla and Google are due to report earnings today after the bell, and their results – or the reaction to their results – could shift the wind in either direction. Despite almost doubling its stock price between April and July, Tesla sees appetite for its cars and its market share under pressure, and the company’s operating profit is expected to shrink in the Q2 for the 6th straight quarter. What keeps optimism alive for Tesla is the robotaxi plan. But robotaxis will cost to the company before it can generate profit. Therefore, the recent gains may not find a solid ground to let the share price extend gains. The key support to the robotaxi-led rally stands at $220 per share, the major 38.2% Fibonacci retracement on April to July rebound. For Google, investors will be closely watching the cloud revenue and whether the AI spending is making a difference for the ad revenue. For this quarter, analysts are expecting impressive numbers: Google’s earnings per share is expected to have risen from $1.44 to $1.85 and its revenue from $74.6 to $84.35 billion. This would mark a significant increase from the same period last year and give hope that the AI trade is not yet exhausted. The risk is, given the sky-high Big Tech valuations, any delay in AI revenue, any unpleasant detail, or any misstep could have a sector-wide negative impact and lead to a rapid selloff in AI-related stocks.
In Europe, the Stoxx 600 gained more than 1% on Monday. The earnings season started on a relatively positive note with around 30% companies beating profit expectations, but luxury and airlines don’t look in a great shape. Ryanair shares plunged 15% after the company cut its summer fare forecast because of ‘materially lower’ ticket prices on growing reluctance from consumers to carry on the weight of higher prices. That’s bad news for company profits but it’s clearly good news for inflation expectations. It means that the companies are visibly losing their pricing power, and should stop hiking prices if they want to sell their goods and services to people who continue to struggle with ongoing cost-of-living crisis. In the same context, Mc Donald’s is also looking to extend its $5 value meal in most Us markets as they think that the deal boosts traffic in its stores. All encouraging news for your central bankers.
FX, bonds and energy
The US 2-year yield consolidates near the 4.50% level, the 10-year yield is sitting close to 4.20% and the US dollar index remains offered near its 200-DMA. But the USD weakness is countered by higher expectations of rate cuts from other major central banks. The euro bulls for example remains timid into the $1.10 mark, while Cable is back below the 1.30 level on uncertainties regarding the Bank of England’s (BoE) next move. In Japan, the yen gains some strength on FX interventions and on some hawkish expectations building into next week’s Bank of Japan (BoJ) meeting that could bring a rate hike, according to some. We hear growing pressure from the political figures as well. A senior official from the ruling party has urged the BoJ to clearly communicate its plan to normalize monetary policy through steady interest rate hikes, noting that the excessive decline of the yen is harming the economy. Prime Minister Kishida also emphasized that normalizing the central bank’s monetary policy would support Japan's transition to a growth-driven economy. As such, the yen is coming to a crossroads near 155 against the US dollar. Either a concrete BoJ action will back a further rise in the yen and back a further decline in the USDJPY toward the 150 level, or the pair will remain within an infernal cycle and go back to the 160 level on unresponsive BoJ. Elsewhere, the BoC is expected to trim its rate by 25bp when officials meet tomorrow.
In energy, US crude slipped below the $80pb psychological and Fibonacci support and tipped a toe below the 200-DMA despite a surprise People’s Bank of China (PBoC) rate cut, the reflation-positive market environment and supply concerns on rising geopolitical tensions in the Mid-East and Canadian wildfires. The expectation that OPEC will starts unwinding its production restrictions in Q4 and the rising odds that Trump presidency would further boost the US production take the upper hand. From a technical standpoint, oil has now stepped into the medium-term bearish consolidation zone and could experience deeper declines. Next support is seen at $78.60/80 region and should be strong given that the rising expectations of rate cuts from the major central banks is still positive for oil prices, while offers now look crowded into the $80pb level.
GBP/JPY Daily Outlook
Daily Pivots: (S1) 202.15; (P) 202.88; (R1) 203.86; More...
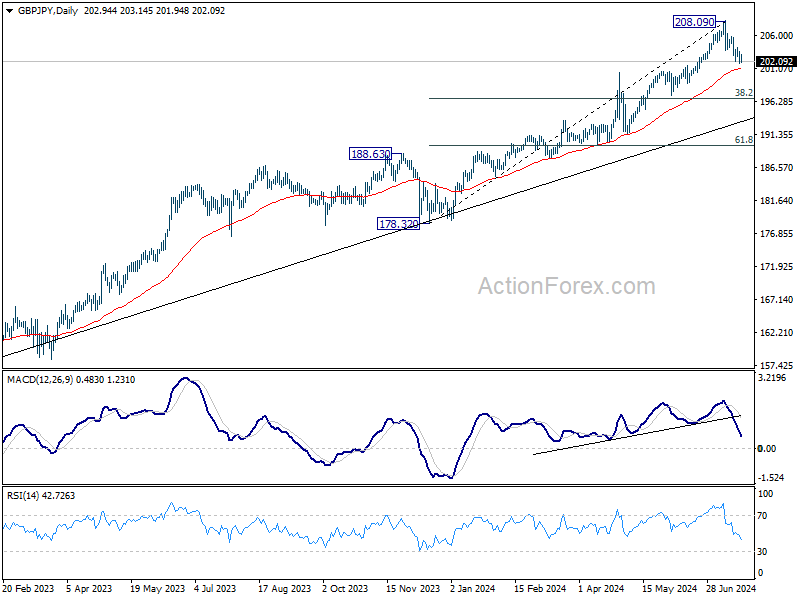
Intraday bias in GBP/JPY remains on the downside for the moment. Fall from 208.09, as a correction to whole rise from 178.32, is in progress. Sustained break of 55 D EMA (now at 201.13) will target 38.2% retracement of 178.32 to 208.09 at 196.71. Nevertheless, break of 204.20 resistance will retain near term bullishness and bring retest of 208.09 high.
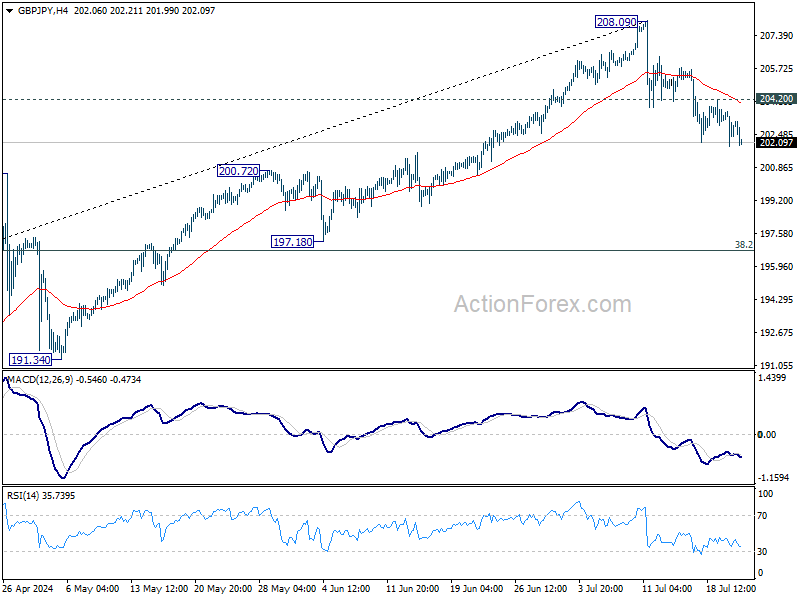
In the bigger picture, medium term outlook will stay bullish as long as 188.63 resistance turned support holds. Long term up trend remains in favor to continue through 208.09 at a later stage. However, firm break of 188.63 will be a strong sign of bearish trend reversal.
Yen Advances Despite BoJ Uncertainty, Aussie and Kiwi Struggles Continue
Yen is trading broadly higher in otherwise sluggish Asian session today. The central focus remains on whether BoJ will implement another interest rate hike at its upcoming announcement on July 31. Media reports suggest that some BoJ officials are concerned about weak consumer spending, which complicates their decision-making. The possibility of postponing the rate decision until the July meeting to gather more data is being considered by some officials, as they look to see if this year's strong wage growth will indeed boost consumer spending. Either way, this month's decision is expected to be down to the wire, with key economic indicators such as this week's Tokyo CPI and next Wednesday's retail sales data playing crucial roles in the final determination.
In other market developments, the selloff in commodity currencies continues, with Australian Dollar and New Zealand Dollar facing significant pressure. Canadian Dollar, however, is faring slightly better. Following Yen's lead, Swiss Franc and Dollar are also showing strength, while he Euro and Sterling positioned in the middle of the pack. It's noted that European majors and Dollar are trading within a narrow range against each other, suggesting that their positions could shift easily depending on upcoming market dynamics. However, the stalled recovery in both EUR/USD and GBP/USD suggests that Dollar may be gearing up for another potential rebound, especially if global risk sentiment deteriorates.
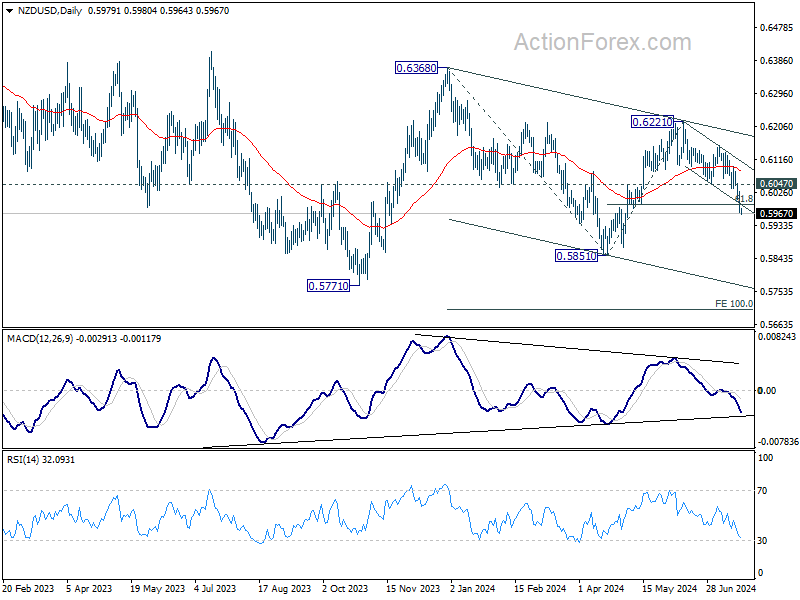
Technically, NZD/USD's fall from 0.6621 extends further and takes out 61.8% retracement of 0.5851 to 0.6221 at 0.5992 with conviction. Also, the break of near term falling channel support indicates downside acceleration. Decline from 0.6221 is likely resuming whole fall from 0.6368. Near term outlook will stay bearish as long as 0.6047 support turned resistance holds. Deeper fall should be seen through 0.5851 support, and possibly through 0.5771 too, to 100% projection of 0.6368 to 0.5851 from 0.6221 at 0.5694.
In Asia, at the time of writing, Nikkei is up 0.05%. Hong Kong HSI is down -0.16%. China Shanghai SSE is down -0.62%. Singapore Strait Times is up 0.54%. Japan 10-year JGB yield is up 0.0028 at 1.068. Overnight, DOW rose 0.32%. S&P 500 rose 1.08%. NASDAQ rose 1.58%. 10-year yield rose 0.021 to 4.260.
AUD/CAD struggles as impact of interest rate policies sidestepped
Australian Dollar continues to face significant headwinds, largely due to ongoing worries about the Chinese economy—the most significant trading partner. Despite the possibility of RBA raising interest rates while other global central banks are adopting easing policies, this potential policy divergence is currently providing little support for the Aussie. Market focus has shifted away from these interest rate considerations, at last for the time being.
Recent developments, including China's Third Plenum last week, have left investors disappointed due to the lack of substantial measures announced to revitalize the slowing Chinese economy, currently grappling with deflation risks and a troubled housing market. The People's Bank of China's unexpected rate cut yesterday, although aimed at addressing these issues, was perceived as too modest to make a significant impact.
Adding to the complexity is the uncertainty surrounding the upcoming US presidential election. Overnight reactions in the US stock market to Joe Biden's withdrawal from the presidential race—and Kamala Harris stepping in as the Democratic candidate—were initially positive. However, the realistic possibility of Donald Trump securing a victory poses concerns, particularly regarding his trade tariff policies, which could exacerbate the economic slowdown in China
AUD/CAD's decline starkly illustrates that interest rate policies are not the primary driver for the Aussie at this time. With BoC's anticipated rate cut this week and uncertainty over whether RBA might hike rates again, the currency pair should theoretically have more room to rally. But the cross has indeed turned south.
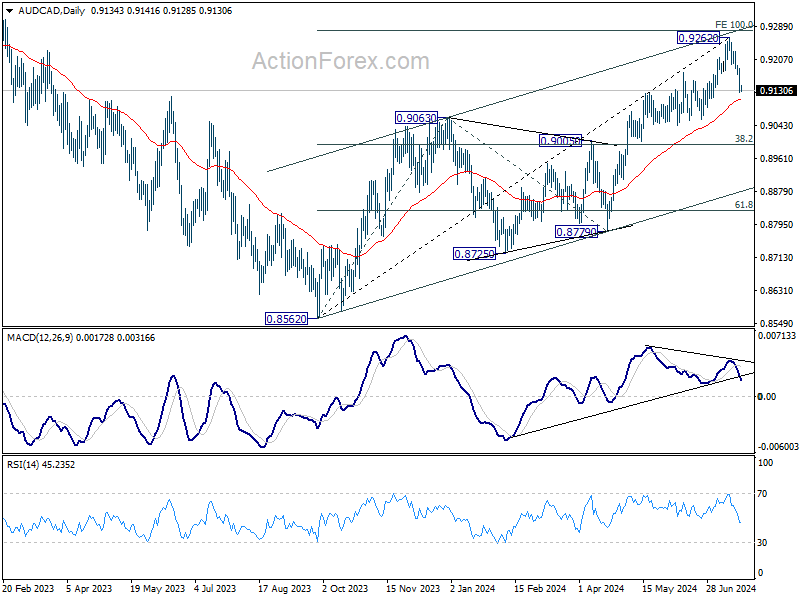
Technically, considering bearish divergence condition in D MACD, a medium term top could have been formed at 0.9262, just ahead of 100% projection of 0.8562 to 0.9063 from 0.8779 at 0.9280. Near term focus is on 55 D EMA (now at 0.9108). Decisive break there would at least send AUD/CAD to 38.2% retracement of 0.8562 to 0.9262 at 0.8995, with risk of further fall to channel support (now at 0.8872).
Looking ahead
The economic calendar remains near empty today. US existing home sales and Eurozone consumer confidence are the only features.
GBP/JPY Daily Outlook
Daily Pivots: (S1) 202.15; (P) 202.88; (R1) 203.86; More...
Intraday bias in GBP/JPY remains on the downside for the moment. Fall from 208.09, as a correction to whole rise from 178.32, is in progress. Sustained break of 55 D EMA (now at 201.13) will target 38.2% retracement of 178.32 to 208.09 at 196.71. Nevertheless, break of 204.20 resistance will retain near term bullishness and bring retest of 208.09 high.
In the bigger picture, medium term outlook will stay bullish as long as 188.63 resistance turned support holds. Long term up trend remains in favor to continue through 208.09 at a later stage. However, firm break of 188.63 will be a strong sign of bearish trend reversal.
Economic Indicators Update
| GMT | Ccy | Events | Actual | Forecast | Previous | Revised |
|---|---|---|---|---|---|---|
| 14:00 | USD | Existing Home Sales Jun | 4.00M | 4.11M | ||
| 14:00 | EUR | Eurozone Consumer Confidence Jul P | -13 | -14 |
AUD/CAD struggles as impact of interest rate policies sidestepped
Australian Dollar continues to face significant headwinds, largely due to ongoing worries about the Chinese economy—the most significant trading partner. Despite the possibility of RBA raising interest rates while other global central banks are adopting easing policies, this potential policy divergence is currently providing little support for the Aussie. Market focus has shifted away from these interest rate considerations, at last for the time being.
Recent developments, including China's Third Plenum last week, have left investors disappointed due to the lack of substantial measures announced to revitalize the slowing Chinese economy, currently grappling with deflation risks and a troubled housing market. The People's Bank of China's unexpected rate cut yesterday, although aimed at addressing these issues, was perceived as too modest to make a significant impact.
Adding to the complexity is the uncertainty surrounding the upcoming US presidential election. Overnight reactions in the US stock market to Joe Biden's withdrawal from the presidential race—and Kamala Harris stepping in as the Democratic candidate—were initially positive. However, the realistic possibility of Donald Trump securing a victory poses concerns, particularly regarding his trade tariff policies, which could exacerbate the economic slowdown in China
AUD/CAD's decline starkly illustrates that interest rate policies are not the primary driver for the Aussie at this time. With BoC's anticipated rate cut this week and uncertainty over whether RBA might hike rates again, the currency pair should theoretically have more room to rally. But the cross has indeed turned south.
Technically, considering bearish divergence condition in D MACD, a medium term top could have been formed at 0.9262, just ahead of 100% projection of 0.8562 to 0.9063 from 0.8779 at 0.9280. Near term focus is on 55 D EMA (now at 0.9108). Decisive break there would at least send AUD/CAD to 38.2% retracement of 0.8562 to 0.9262 at 0.8995, with risk of further fall to channel support (now at 0.8872).
Copper (HG) Double Three Elliott Wave Correction in Progress
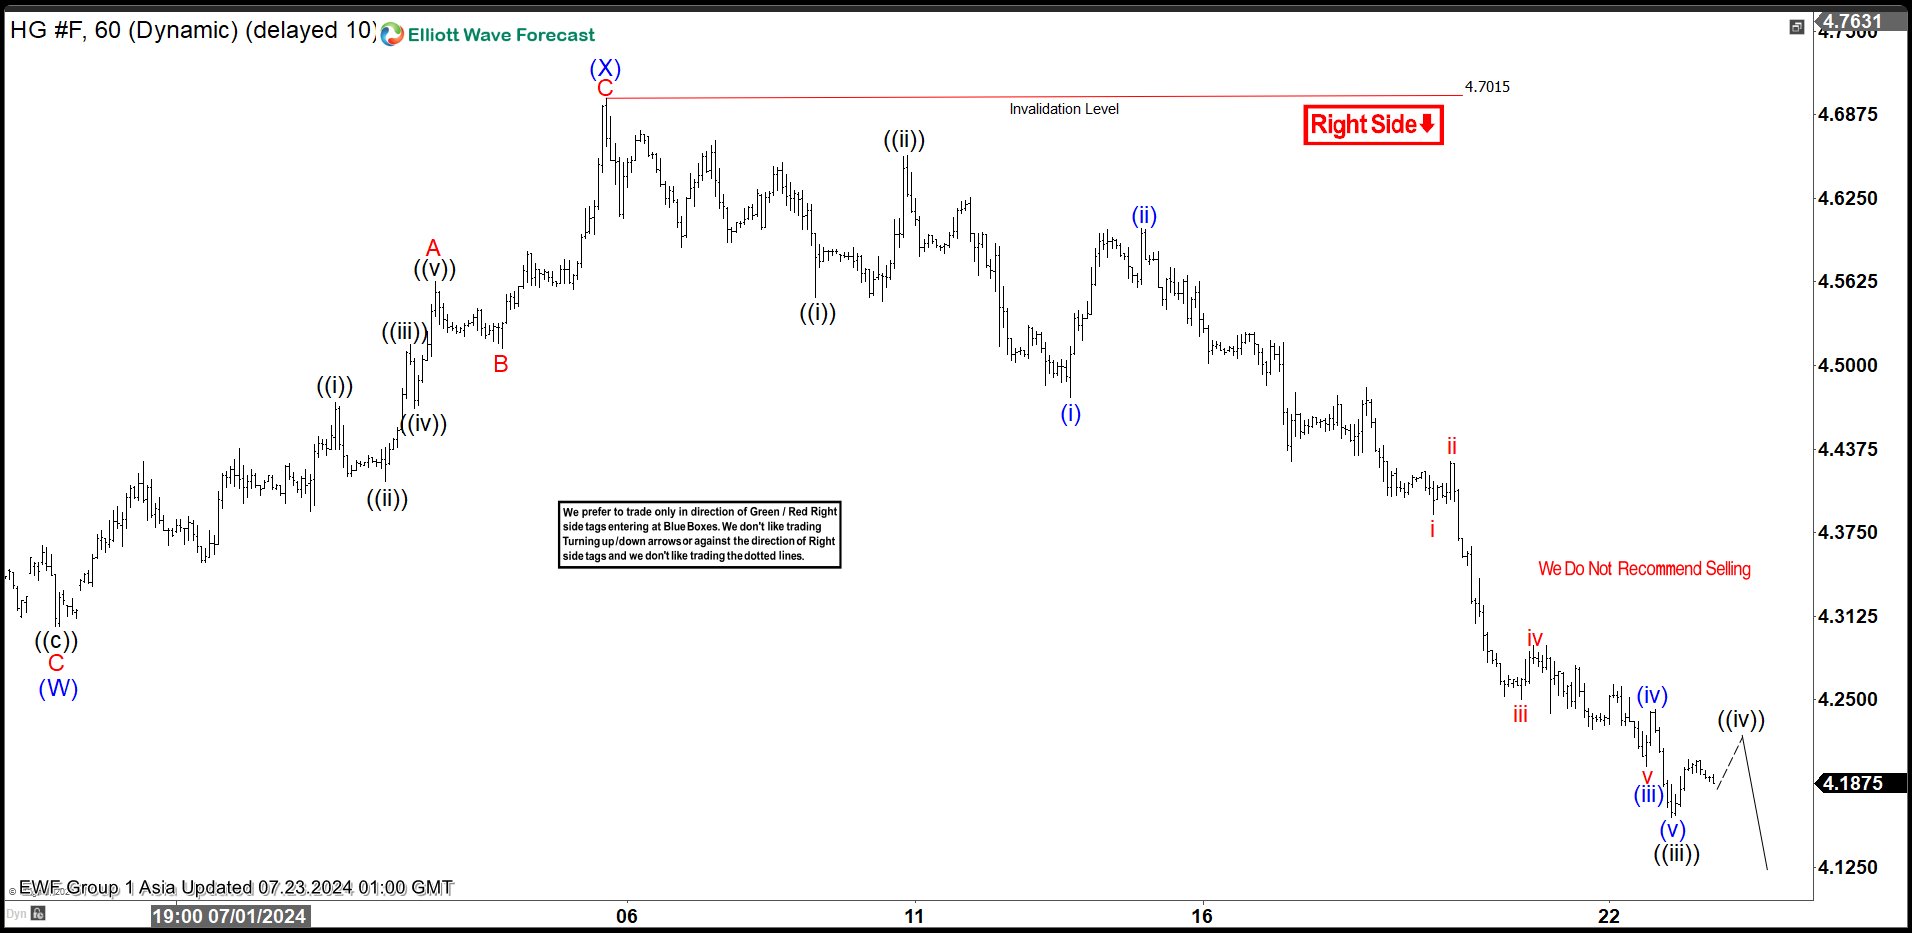
Short Term Elliott Wave View in Copper (HG) suggests that correction from 5.20.2024 high remains in progress. The internal subdivision of the correction is unfolding as a double three Elliott Wave structure. Down from 5.20.2024 high, wave (W) ended at 4.305 and rally in wave (X) ended at 4.7015. Wave (Y) lower is in progress as a zigzag structure. Down from wave (X), wave ((i)) ended at 4.551 and rally in wave ((ii)) ended at 4.657. The metal then extends lower again in wave ((iii)).
Down from wave ((ii)), wave (i) ended at 4.476 and rally in wave (ii) ended at 4.6025. The metal turns lower again in wave (iii) ended at 4.2 and wave (iv) rally ended at 4.242. Wave (v) lower ended at 4.162 which completed wave ((iii)) in higher degree. Rally in wave ((iv)) is currently in progress to correct cycle from 7.10.2024 high in 3, 7, or 11 swing before it resumes lower again. Near term, as far as pivot at 4.701 high stays intact, expect rally to fail in 3, 7, or 11 swing for further downside. Potential target lower is 100% – 161.8% Fibonacci extension from 5.20.2024 high. This area comes at 3.6 – 3.81 where support can be seen.
Copper (HG) 60 Minutes Elliott Wave Chart
HG_F Elliott Wave Video
https://www.youtube.com/watch?v=Bth5NrVDFSk
GBP/USD Sees Pullback But Key Support Intact
Key Highlights
- GBP/USD started a downside correction from the 1.3050 zone.
- It traded below a connecting bullish trend line with support at 1.2970 on the 4-hour chart.
- Gold prices corrected gains and traded below $2,425.
- Oil prices extended losses and declined below the $80.00 level.
GBP/USD Technical Analysis
The British Pound remained in a positive zone above the 1.2850 level against the US Dollar. GBP/USD climbed above the 1.3000 resistance before the bears appeared.
Looking at the 4-hour chart, the pair tested the 1.3050 level, and settled above the 100 simple moving average (red, 4-hour) and the 200 simple moving average (green, 4-hour). Recently, the pair started a downside correction below the 1.3000 level.
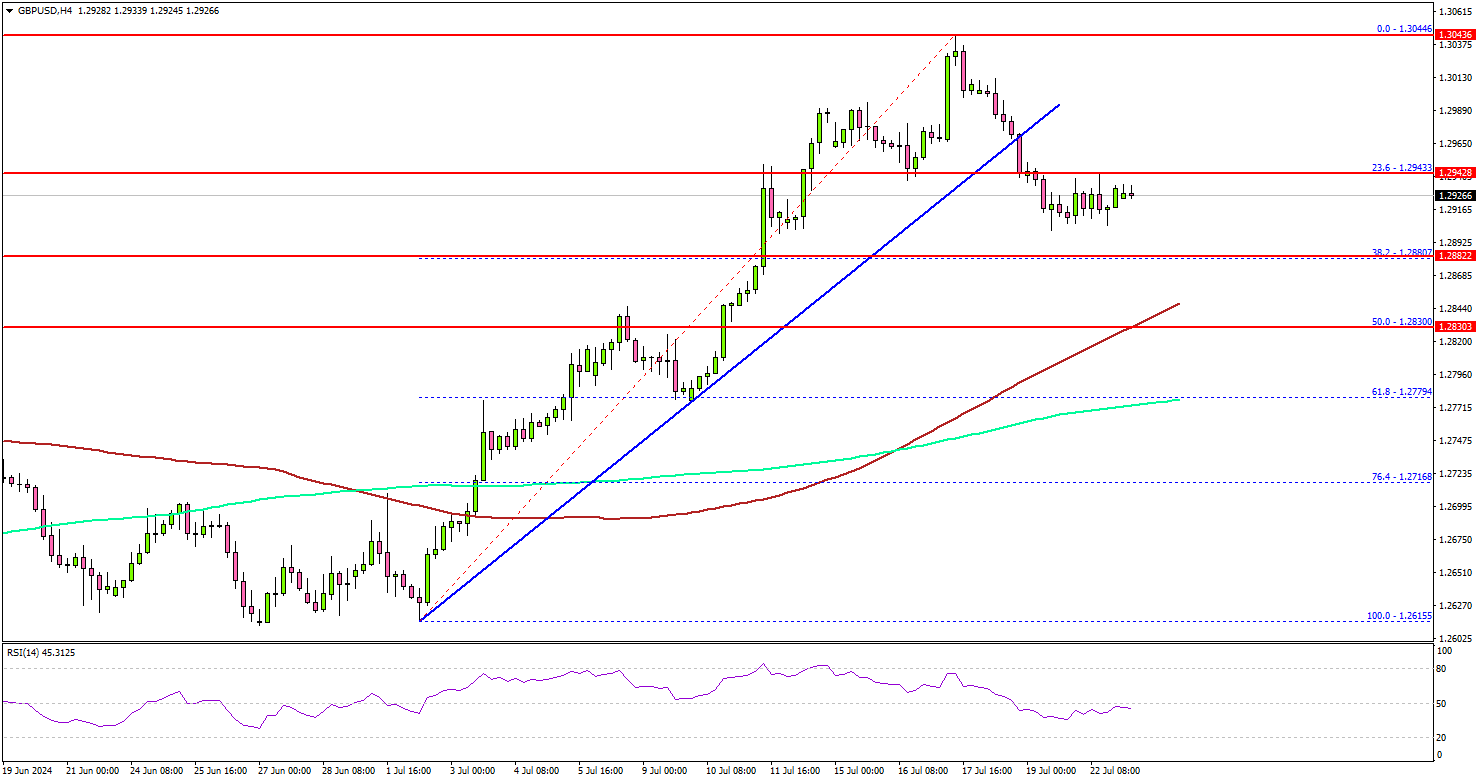
It traded below a connecting bullish trend line with support at 1.2970 on the same chart. The bears pushed the pair below the 23.6% Fib retracement level of the upward move from the 1.2615 swing low to the 1.3044 high.
However, the bulls are active near 1.2900. If there is a fresh increase, the pair could face resistance near the 1.2940 level. The next resistance sits at 1.2965. The main hurdle sits at 1.3000.
A clear move above the 1.3000 resistance might send it toward the 1.3050 level. Any more gains might open the doors for a test of the 1.3150 zone in the coming days.
Immediate support is near the 1.2890 level. The next major support is near the 1.2830 level and the 50% Fib retracement level of the upward move from the 1.2615 swing low to the 1.3044 high. A downside break and close below the 1.2830 support zone could open the doors for more losses. In the stated case, EUR/USD might decline toward the 1.2750 level.
Looking at Gold, there was a fresh bearish reaction, and the bears were able to push the price below the $2,425 level.
Economic Releases
- Euro Zone Manufacturing PMI for July 2024 (Preliminary) – Forecast 46.1, versus 45.8 previous.
- Euro Zone Services PMI for July 2024 (Preliminary) – Forecast 53.0, versus 52.8 previous.
- UK Manufacturing PMI for July 2024 (Preliminary) – Forecast 51.1, versus 50.9 previous.
- UK Services PMI for July 2024 (Preliminary) – Forecast 52.5, versus 52.1 previous.
- US Manufacturing PMI for July 2024 (Preliminary) – Forecast 51.7, versus 51.6 previous.
- US Services PMI for July 2024 (Preliminary) – Forecast 54.4, versus 55.3 previous.
US GDP and PCE Inflation Up Next Before July FOMC
- Fed to get final clues on growth and inflation before July meeting
- But with traders more preoccupied with politics, will the data move the dollar?
- Preliminary GDP is due Thursday and PCE inflation on Friday, both at 12:30 GMT
Fed still wants to see more progress
The recent inflation reports have brought some much needed relief for both policymakers and the markets, pointing to a resumption of the downward trend after several months of sideways movement. The Fed has even toned down its hawkish rhetoric somewhat, hinting that a rate cut may be nearing.
However, Chair Jerome Powell was also quite specific when he addressed lawmakers earlier this month that the Fed wants to see more good data to gain greater confidence of achieving its 2% price objective. Hence, Friday’s PCE inflation figures could be crucial in taking the Fed a step closer towards its target.
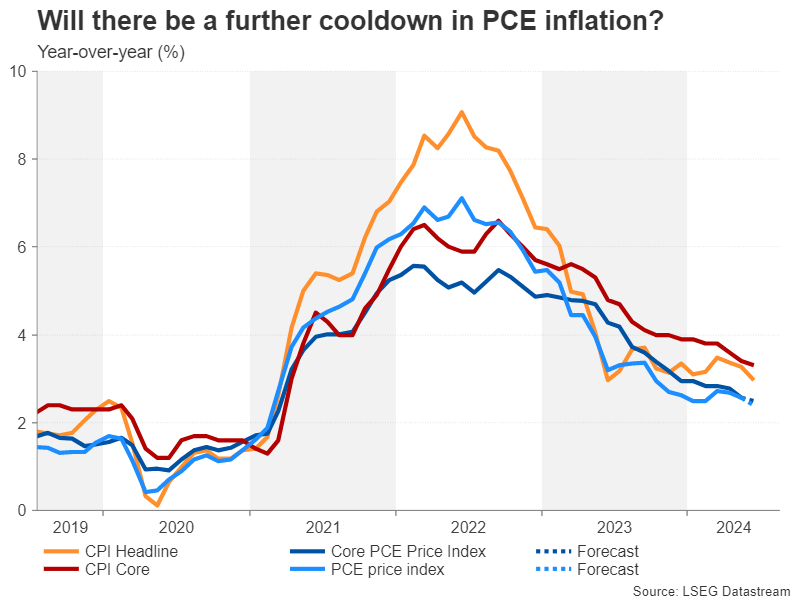
The personal consumption expenditures (PCE) price index is expected to have eased from 2.6% in May y/y to 2.4% to June, which would make it the lowest since February 2021. The more important core PCE price index that strips out food and energy prices is forecast to have edged down 0.1 percentage points to 2.5% y/y in June – also a more than three-year low.
Are American households spending less?
Included in the same report are the personal income and personal consumption numbers. The former is expected to have risen by 0.4% m/m in June, slowing from 0.5%, and the latter by 0.3% m/m, in a modest pick up from 0.2%.
Recent indicators suggest the US consumer is finally reining in spending and this may have contributed to the Fed’s slight dovish lean, as weaker consumption would reduce the upside risks to inflation. But if there’s an unexpected acceleration, the Fed will be more inclined to maintain a cautious stance when it meets next week.
GDP growth probably quickened in Q2
Overall, though, it’s clear that the US economy has lost steam this year, with even the red-hot labour market cooling a bit lately. Yet, there have been some discrepancies between the different data sets and it’s not just inflation that policymakers have struggled to get a clear read on. Although it can only be a good thing that a soft landing seems achievable and is not simply an elusive goal, the Fed would probably prefer for growth to have slowed more sharply by now to aid its fight against inflation.
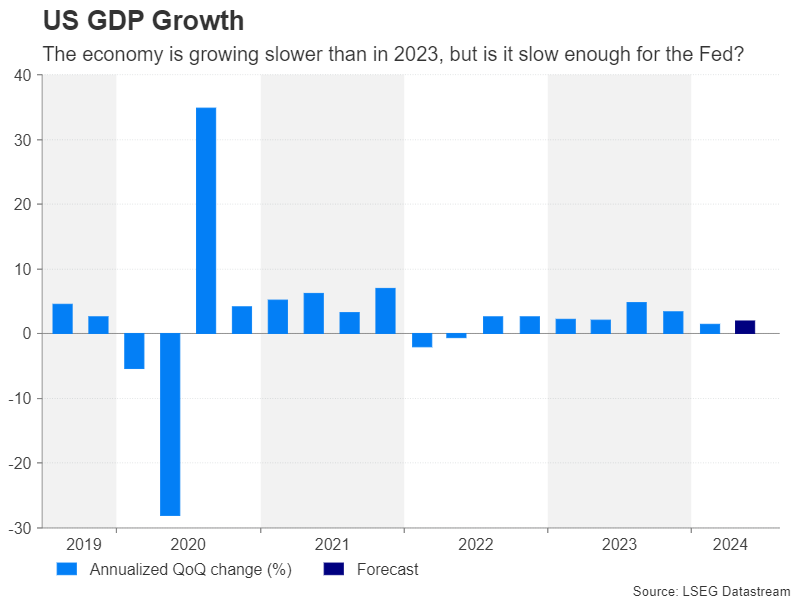
Thursday’s advance estimate of GDP growth for the second quarter is not expected to do much in clearing the fog. The US economy is projected to have expanded by an annualized rate of 2.0% in Q2 versus 1.4% in the prior three months.
Fed not in a rush to cut
A lower print would ease concerns about domestic demand remaining too strong, but the bigger question is would softer readings on either inflation or growth, or both, prompt some kind of a policy shift by the Fed at the July 30-31 meeting?
Judging by their language, policymakers seem quite comfortable to wait a while longer so unless there is anything in the incoming data that points to a sudden deterioration in the economy, the Fed will probably make only slight tweaks to its language to flag a possible rate cut in September without quite committing to it.
Dollar on the backfoot
The US dollar could come under pressure if this week’s releases bring a September cut closer. Against currencies such as the Japanese yen, the greenback has already suffered substantial losses over the past couple of weeks and a further selloff could bring the 155.00 support into view.
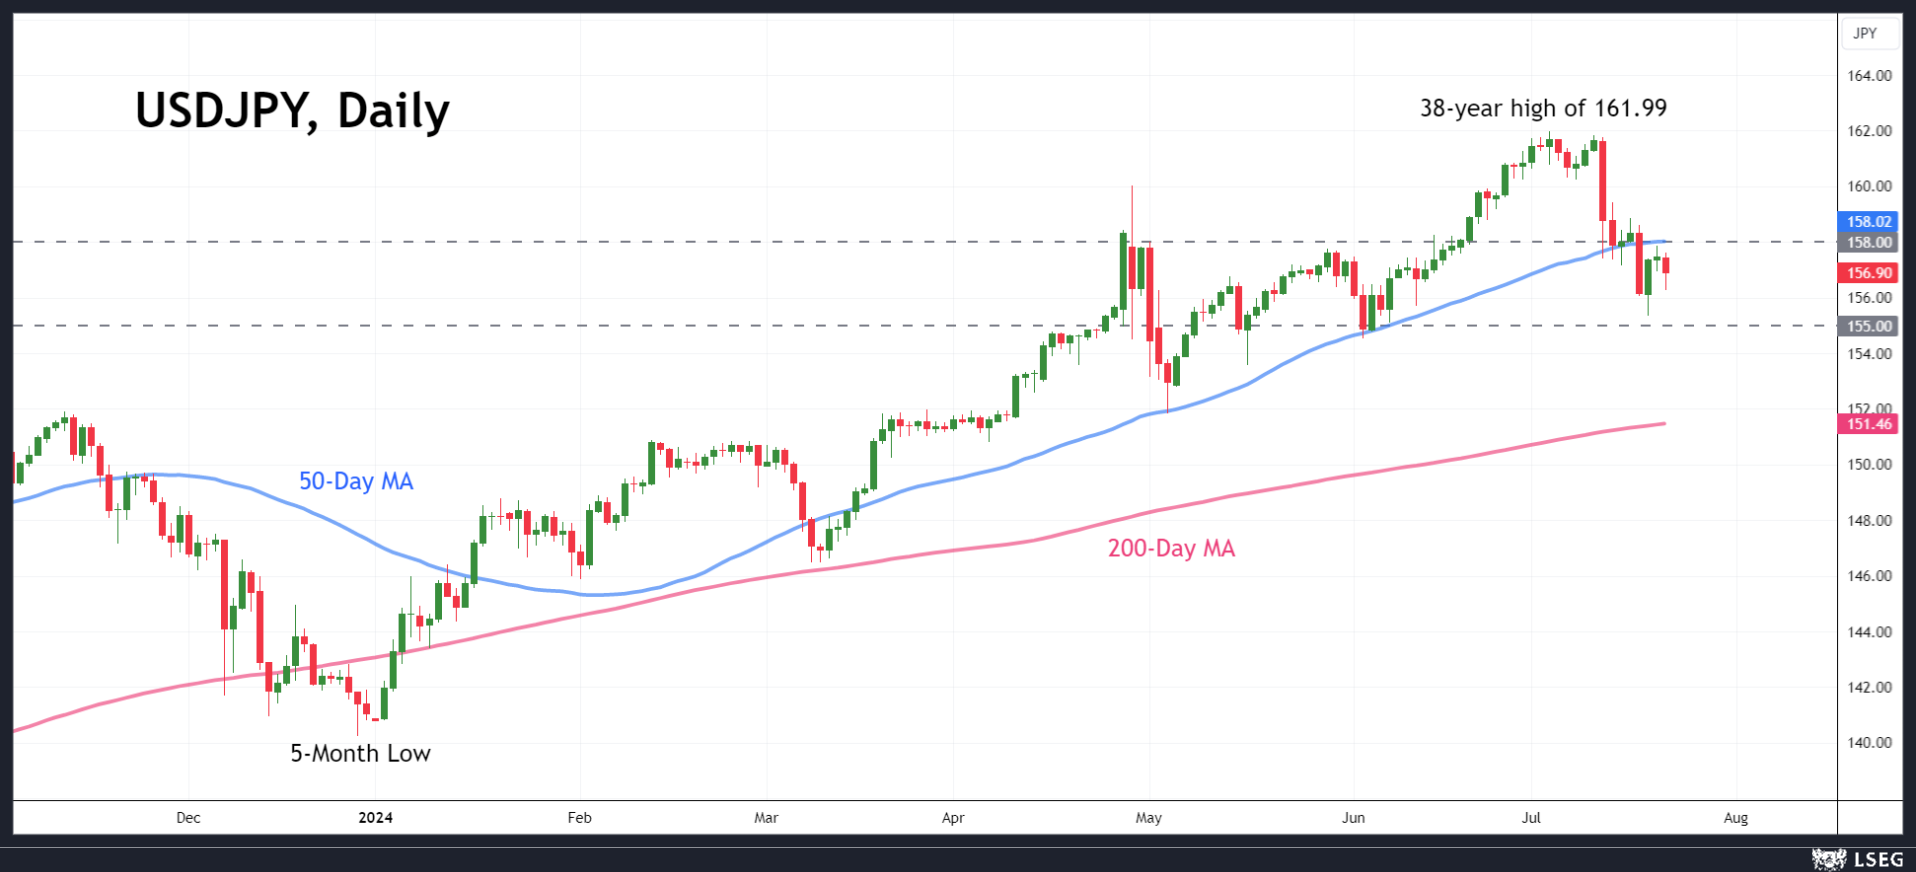
However, any setback from the data to rate cut bets, particularly from a hotter-than-expected core PCE number, could spur a rebound in the dollar, pushing it above its 50-day moving average (MA), which has started to flatten at 158.00 yen.
US elections keeping markets on edge
In the meantime, investors will also be keeping a close watch on the US presidential race as the Democrats’ chances of securing another victory got a boost following President Biden’s decision on Sunday not to stand for re-election and to instead endorse his vice president, Kamala Harris, as the party’s nominee.
There’s still some way to go before the Democrats formally pick their candidate at the party’s convention next month but should the opinion polls suggest that Harris poses a threat to Trump’s bid to re-enter the White House, the dollar could slip a little as there would be less of a risk of higher trade tariffs from a Trump presidency, which have the potential to push up inflation.
S&P 500 Wave Analysis
- S&P 500 continues daily uptrend
- Likely to rise to resistance level 5675.00
S&P 500 Index recently reversed from the support area between the key support level 5500.00 (former resistance from June) and the 38.2% Fibonacci correction of the previous upward impulse from May.
The upward reversal from this support area will likely form the daily Japanese candlesticks reversal pattern Bullish Engulfing if the price closes today near the current levels – a strong buy signal for this index.
Given the clear daily uptrend, S&P 500 Index can be expected to rise further to the next resistance level 5675.00 (top of the previous wave i).
