Sample Category Title
What Could UK General Election Mean for Pound?
- UK citizens head to the ballots on July 4
- Opinion polls point to a Labour Party victory
- Political stability could initially benefit the pound
- But BoE rate cut bets could prove negative in the longer run
How it works
On July 4, Britons will head to the ballots to vote in a general election, with opinion polls suggesting that they will end 14 years of Conservative rule.
The United Kingdom is divided into 650 constituencies. In each of them, voters choose a local candidate for a seat in Parliament, and typically those candidates represent a political party. There are two Houses in the UK Parliament: The House of Commons and the House of Lords. Voters are electing members of the House of Commons as members of the House of Lords are appointed by the government as life peers.
The party with the most seats wins the election but to run the government, they need 326 of the 650 seats or negotiate with other parties to build a coalition. They could still try and govern with a minority, but they could face huge obstacles in passing their agenda. The leader of the winning party becomes prime minister.
Who is leading?
Opinion polls have been consistently showing the Labour Party is leading the race, with Nigel Farage’s Reform UK overtaking Conservatives in some of the latest polls. It is also projected that the Labour party could win more than 400 seats in Parliament.
So, what does a Labour victory mean for the economy, the Bank of England, and consequently, the pound?
Labour victory, economy and BoE policy
Conservatives are focusing on tax cuts to reignite economic growth, while the Labour Party is portraying itself as the party of fiscal responsibility. Although the center-left party promised not to raise income tax, national insurance or corporation tax, they have not ruled out raising other taxes. What’s more, even though it is highly unlikely they would cut spending significantly, they said they cannot rely on using government funds to spur growth. They want to adopt a different strategy where finances are raised by companies.
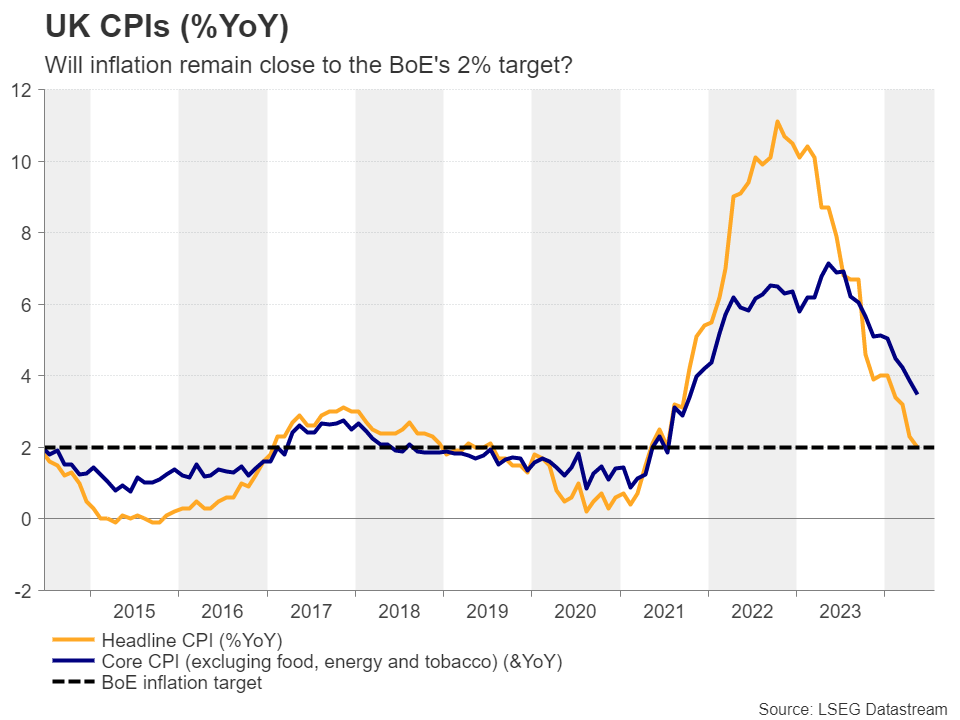
But managing to make the corporate mechanism to work could take time, which means that a potential economic boost will be delayed, thereby keeping inflation close to the BoE’s target of 2% and allowing policymakers to start cutting interest rates sooner and faster.
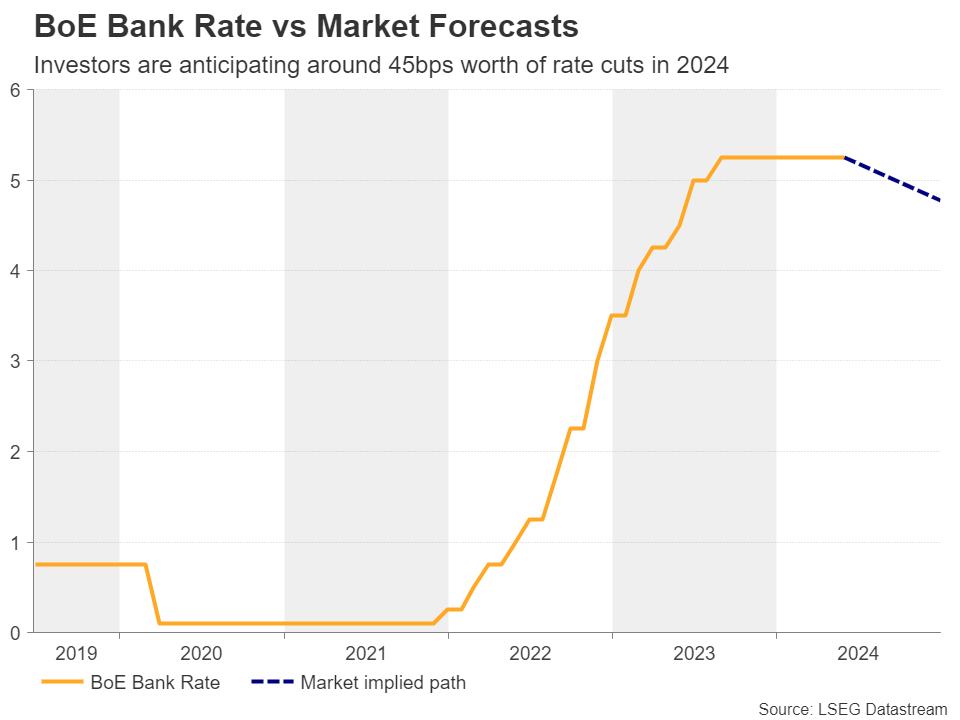
At last week’s gathering, the BoE kept interest rates unchanged, but the meeting minutes revealed that the decision was “finely balanced”, raising the probability for an August rate cut to around 50%. Taking that into account, a Labour victory on July 4 could increase that probability and perhaps encourage investors to add to the total number of basis points worth of reductions expected by the end of the year. Currently, there are nearly two quarter-point cuts penciled in for 2024.
Pound could benefit, but only temporarily
As for the pound, expectations of more rate cuts by the BoE could prove negative, but the initial reaction to a Labour victory may be positive as investors may view this as the beginning of a period of political stability amid a less divided party and amid Labour’s pledge to improve ties with the European union.
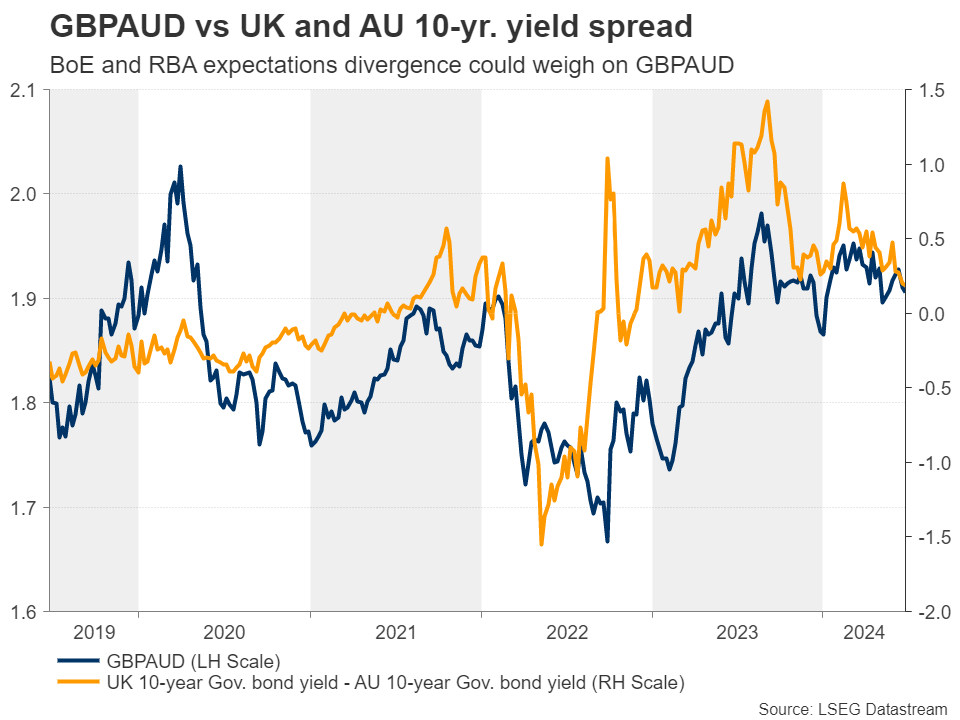
Having said that though, any reaction to a potential Labor victory may not have a huge market impact as this is the outcome already expected. If the pound is set to drift south in the post-election era due to increasing BoE rate cut bets, the currency against which it could lose the most ground may be the aussie. Remember that last week, the RBA maintained its neutral stance, while Governor Bullock revealed that they discussed the option of raising rates.
Pound/aussie remains in downtrend
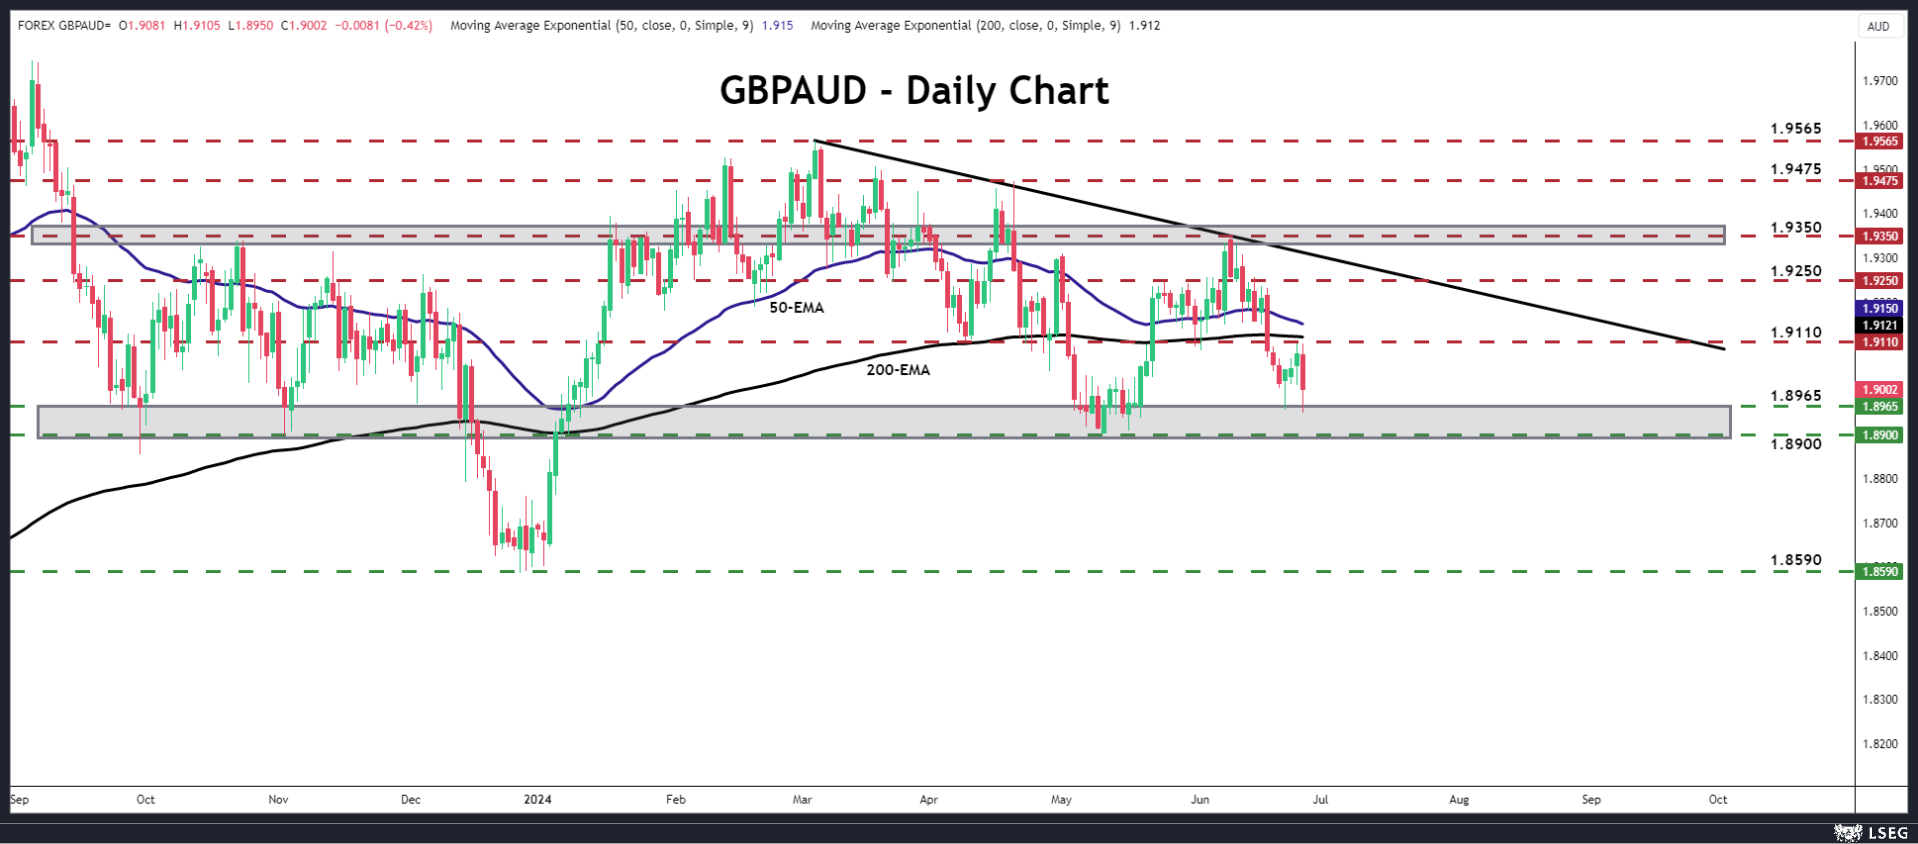
From a technical standpoint, pound/aussie entered a recovery phase on June 21, but on June 26, it hit strong resistance at around 1.9110 and slid. In the bigger picture, the pair remains below a downward sloping trendline drawn from the high of March 3. Therefore, if the pair recovers again on the election outcome, the rebound may be considered a corrective phase within a larger downtrend.
The bears could take charge again at some point and the pair may slip towards the 1.8965 zone again or the 1.8900 barrier, which provided support between May 7 and 15. A break lower would confirm a lower low on the daily chart and perhaps pave the way towards the low of December 27, at around 1.8590. For the outlook to change to positive, the bulls may need to clearly overcome the 1.9350 territory.
Will Core PCE Inflation Persuade Fed to Cut Rates?
- US core PCE inflation index could resume downtrend
- Fed may ask more evidence before cutting interest rates
- EURUSD trades near key support zone. Is it time for an upside reversal?
Inflation could hit a new low in May
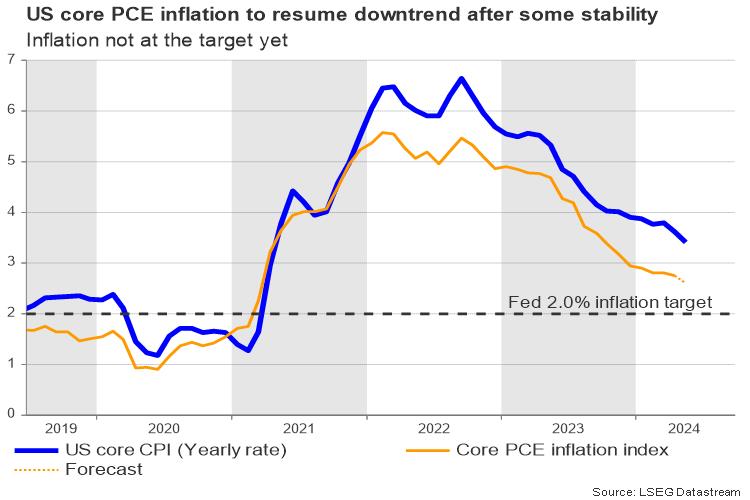
Friday will see the release of the Fed’s favorite core PCE inflation measure at 12:30 GMT as the world’s largest central bank keeps looking for signs of sustained price stability around its 2.0% target almost a year after it paused its hiking cycle.
Forecasts point to a weaker reading of 2.6% year-on-year in May from 2.8% previously. If analysts are correct, the news could be meaningful to the Fed as this would be the lowest level reached since inflation accelerated from 1.9% to 3.1% in May 2021. The monthly increase could be a relief as well if it softens from 0.2% to 0.1%.
Will the data push for a rate cut?
The short answer is no. Recall that the latest CPI inflation report surprised slightly to the downside, increasing the chances of a September rate cut, but the details showed that there are still some areas such as the house/rental market which are stuck. Although the acceleration in interest rates sapped momentum in the house market and pushed housing inventory to the highest in two years recently, the house price index continued to rise at an unacceptable rate of 6.3% y/y.
Hence, even if the core PCE gauge resumes its downward pattern, policymakers would like to see one or two softer releases to consider a rate cut in September. Falling personal spending and income data could provide more incentives to lower borrowing costs, but analysts estimate a slight pickup to 0.3% m/m and 0.4% m/m, respectively.
Note that Fed policymakers lowered their rate projections from three rate cuts in March to only one for 2024, and some policymakers, including the board member Michelle Bowman, insist that reductions will not happen this year as upside inflation risks persist.
How will the data influence market sentiment?
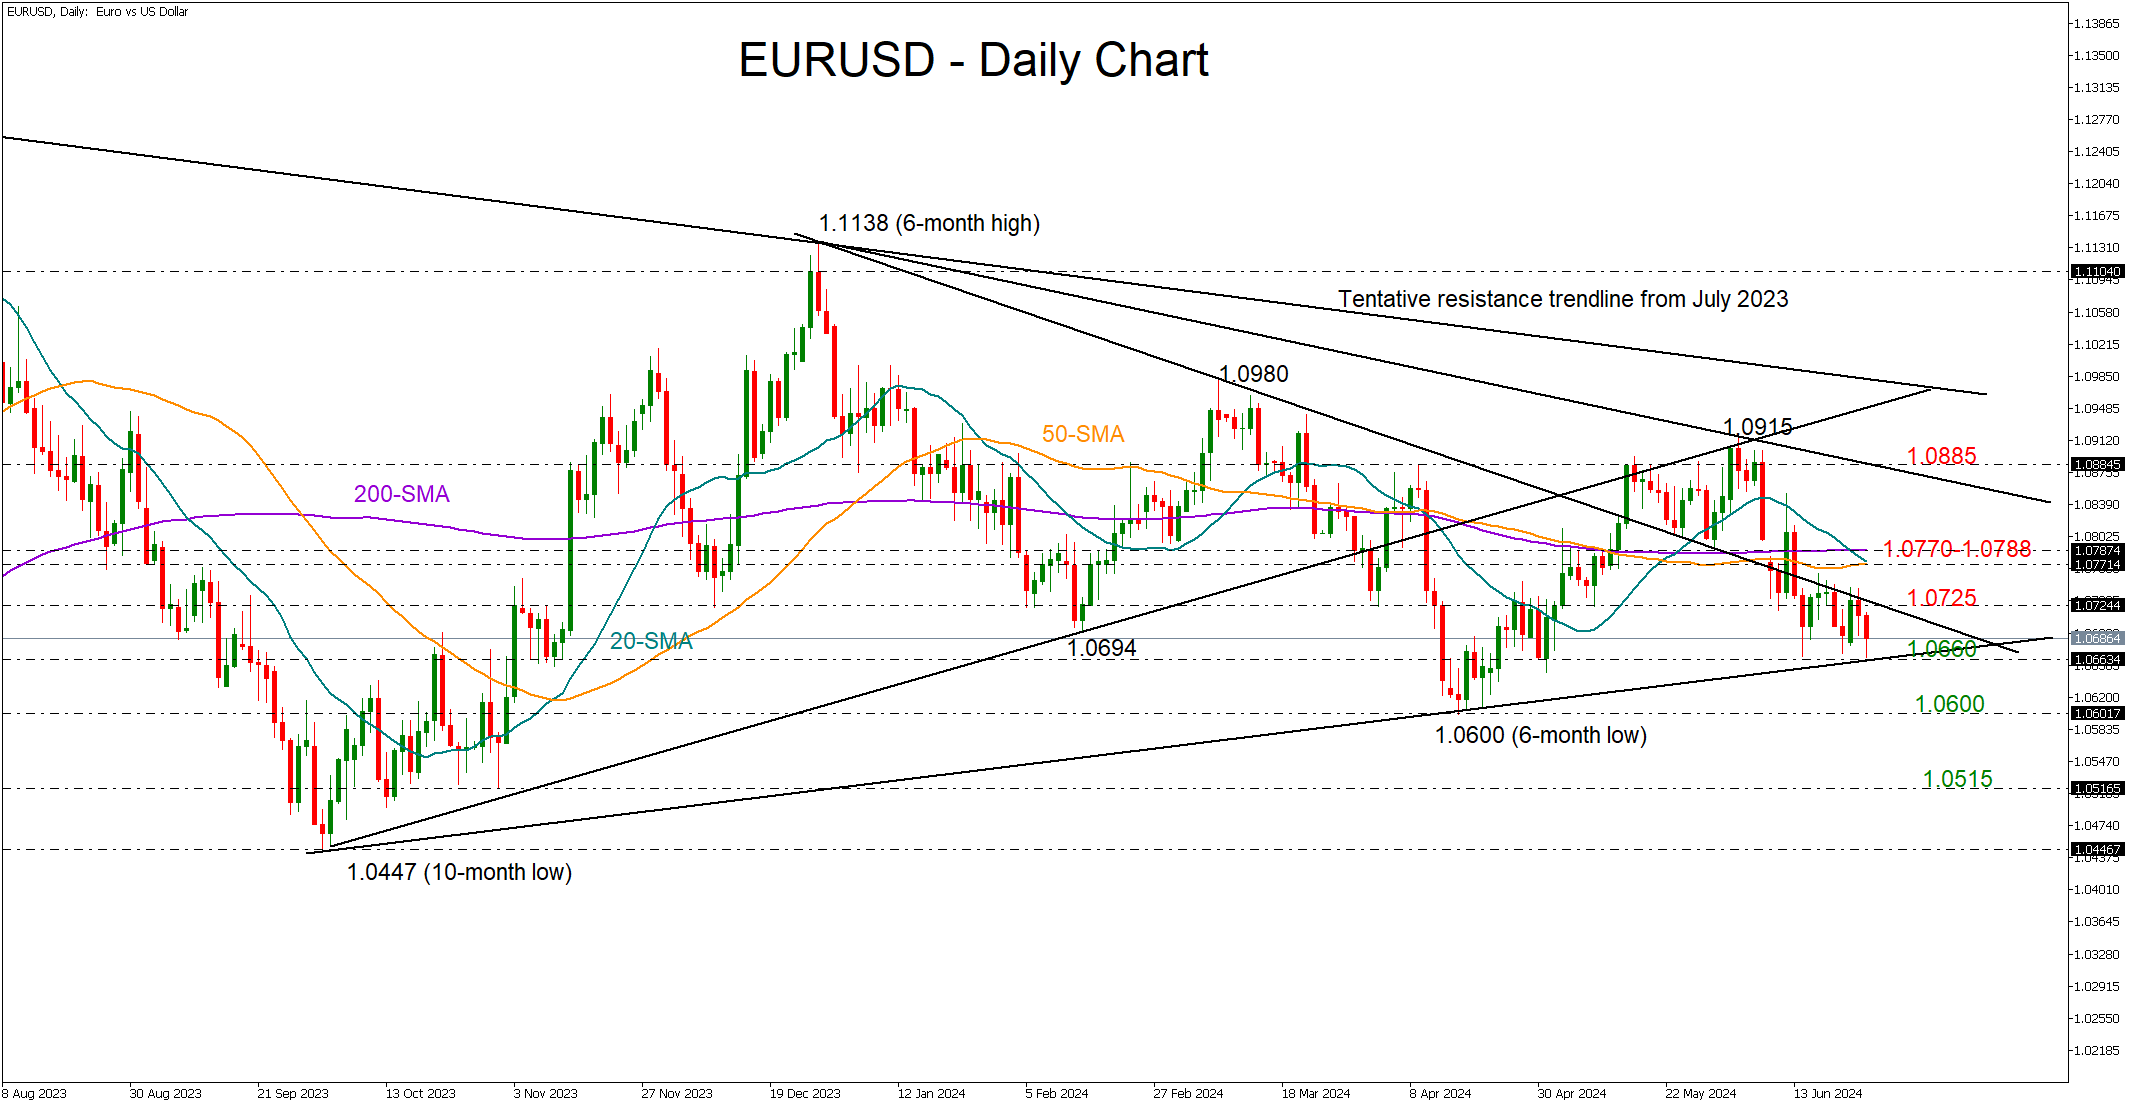
Some volatility is expected following the release of the data as investors have downgraded their rate forecasts to 45 bps of monetary easing, and are currently thinking that a reduction in September could be a close call. Therefore, a negative surprise in the core PCE inflation data and signs of decelerating consumption could see more investors backing a September rate cut, especially as November’s general election approaches. In this case, EURUSD could set a strong footing near the key support trendline at 1.0660 and head towards its simple moving averages (SMAs) located within the 1.0770-1.0788 zone if the 1.0725 constraining zone gives the green light on the upside.
Alternatively, hotter-than-expected readings might increase fears that policy divergence between the Fed and other major central banks could widen in the coming months. As a result, the US dollar could benefit from the news, pressing EURUSD below 1.0660 and towards the 1.0600 round level. A more aggressive decline could lead the pair into the 1.0500-1.0515 support region.
Yen Weaker Every Day, USDJPY Breaks 1990 Highs
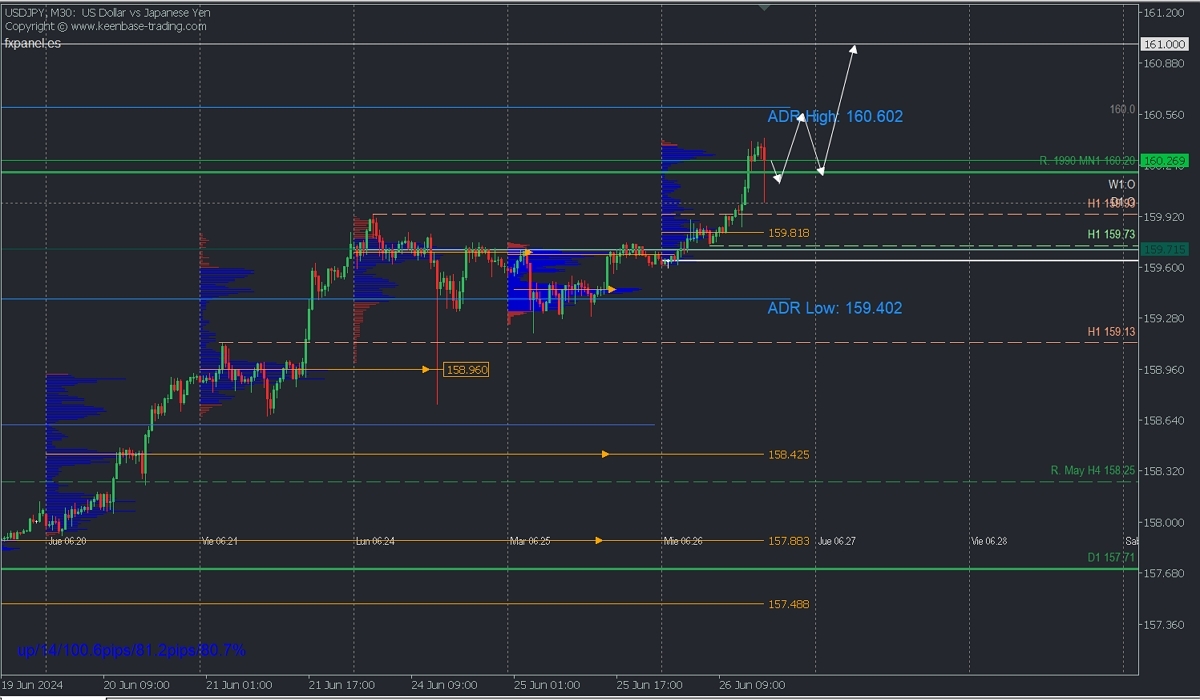
Intraday Bullish Scenario: Wait for a pullback to 160.12 with TP1 at 160.60 and TP2 at 160.80, with an S.L. below 159.90 or at least 1% of the account capital. Apply Trailing Stop.
Bearish Scenario: Sell below 160.60 (if a PAR forms) with TP1 at 159.81, TP2 at 159.73, and TP3 at 159.40 with S.L. at 160.70 or at least 1% of the account capital.
Fundamental Analysis
This week, the USDJPY pair has experienced significant movements driven by various economic and political factors. The Japanese yen has shown weakness against the US dollar due to several events.
- Weakness of the Japanese Yen: The yen has been on a nearly 10-day losing streak, with traders watching for possible interventions by the Japanese Ministry of Finance. Authorities have hinted that they will not intervene until after the US Personal Consumption Expenditures (PCE) report, which has kept volatility high.
- Strength of the US Dollar: The US Dollar Index (DXY) has risen thanks to hawkish comments from the Federal Reserve and the yen depreciation. Political uncertainty in Europe, especially due to the snap elections in France and low consumer confidence in Germany, has also contributed to the dollar's strength.
Key Ideas
The intervention of the Japanese Ministry of Finance is likely if US economic data is stronger than expected.
Technical Analysis, H4
USDJPY
- Supply Zones (Sells): 160.00
- Demand Zones (Buys): 159.46, 158.96
The pair surpassed the key resistance of 1990 at 160.20 today, challenging the BoJ's tolerance levels. However, the pair has an average bullish range to 160.60, which is expected to extend the day's rise, with attention to the round level of 161.00 for the rest of the week ahead of the US PCE data on Friday.
The important pullback zone is the round level at 159.99, the broken resistance at 158.90, and the POC of the initial sessions at 159.81, from where a new rally towards 160.80 or 161.00 is expected, as long as the last relevant intraday support at 159.73 is not decisively broken.
Selling below the key support zone will pave the way for more extended sales towards the high volume node around 159.45 and the average daily bearish range at 159.40.
POC Explained: POC = Point of Control: It is the level or zone where the highest concentration of volume occurred. If a bearish movement originated from it previously, it is considered a sell zone and forms a resistance area. Conversely, if a bullish impulse occurred from it previously, it is considered a buy zone, usually located at lows, thus forming support zones.
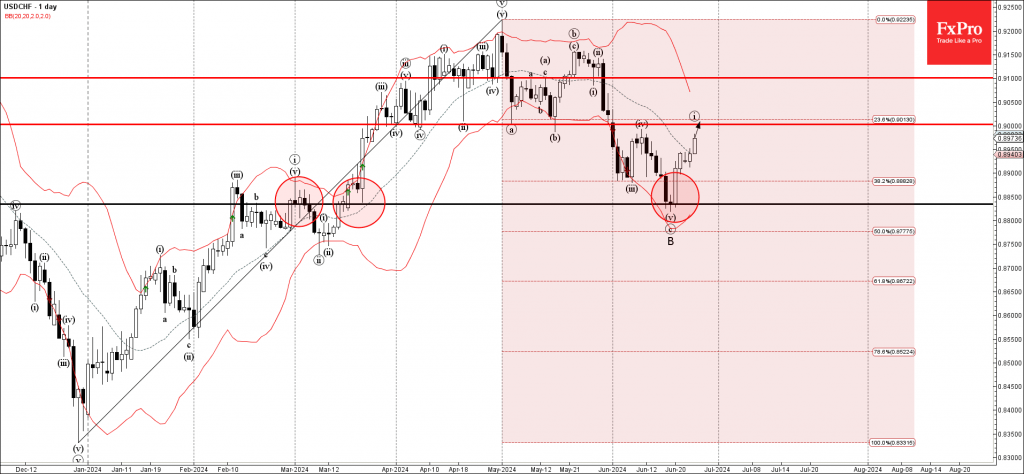
USDCHF Wave Analysis
- USDCHF rising inside impulse wave i
- Likely to reach resistance level 0.9000
USDCHF continues to rise inside the minor impulse wave i, which started earlier, when the pair reversed up from the key support level 0.8835, standing near the lower daily Bollinger Band and the 50% Fibonacci correction level of the previous upward impulse from December.
The upward reversal from the support level 0.8835 created the perfectly formed Japanese candlesticks reversal pattern Morning Star.
Given the continuation of the Swiss franc sales and USD bullish sentiment seen today, USDCHF can be expected to rise toward the next round resistance level 0.9000 (former strong support from April and May).
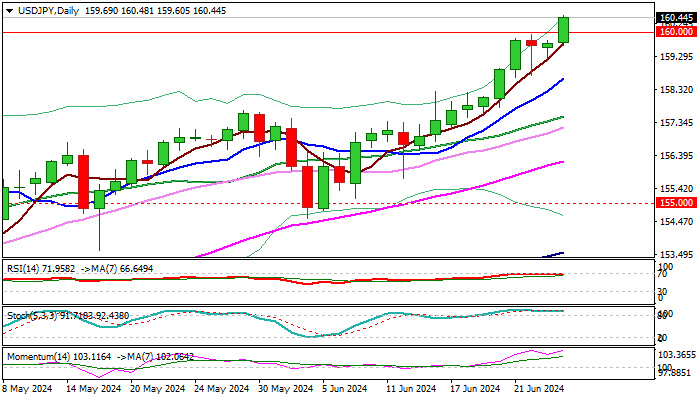
USD/JPY: Probes Again Through 160.00 Barrier and Hits New Multi-Decade Highs
USDJPY hit new multi-decade high above 160 on Wednesday, as bulls regained control after a two-day consolidation.
Fresh probe above psychological 160 barrier suggests that bids remain strong despite warning that Japan’s authorities may intervene to support weakening national currency, with 160 zone seen as a likely trigger.
Strong bids were also signaled by long tails of May / June monthly candles, while dollar remains underpinned by wide gap between monetary policies of Fed and BoJ.
Bulls also ignore overbought conditions on daily chart, with initial bullish signal expected on close above 160 level that would unmask targets at 162.16 /163.38 (Fibo projections) and 164.00 (Oct 1986 high).
Rumors that the Japanese authorities raised the red line for intervention towards 170 zone, may add to fresh bulls to sustain gains above 160.
Initial support lays at 160.00, followed by 159.60 (today’s low / 5DMA) and rising 10 DMA (158.64) which should keep the downside protected.
Res: 161.00; 162.16; 163.38; 164.00.
Sup: 160.00; 159.60; 158.64; 157.70.
Sunset Market Commentary
Markets
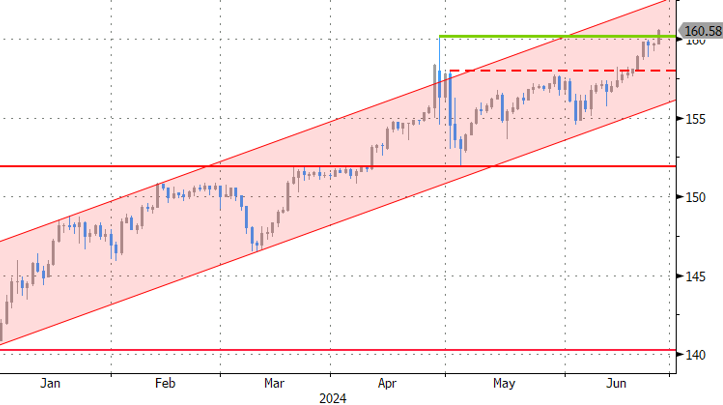
Markets are testing the resolve of Japanese officials. USD/JPY broke through the 160-level which triggered FX interventions at the end of April and early March. The pair set a new nearly 40-yr high above 160.50. Verbal warnings by the Japanese (vice-) finance minister earlier this week don’t result in effective action yet. Japan’s currency chief Kanda said that they are watching forex moves with a high level of urgency. He calls them one-sided and rapid, but didn’t mention “excessive”, which was a trigger point in the past. After his comments, the JPY sell-off just continued. USD/JPY 163 is rumoured to be the new 160. Something tells us that the journey won’t take that long. Japanese officials might be putting their eggs in the US eco update basket which starts this Friday with May PCE deflators and ends next Friday with payrolls. Overall dollar strength is at play as well today as risk sentiment soured during European dealings and going into the US start. The trade-weighted dollar changes hands above 106 for the first time since the end of April with resistance at 106.52 looming. EUR/USD tests the recent lows around 1.0670. From the euro side of the story, this morning’s comments by ECB Rehn might have contributed to some weakness. He aligned with the majority market thinking of 2 additional 25 bps rate cuts this year with the ECB eyeing a 2.25%-2.50% terminal rate. The new French underperformance (both bonds and stocks) going into Sunday’s first round of parliamentary elections could be at play as well.
Today’s core bond sell-off is somewhat at odds with the risk sell-off and USD strength. In the run-up to tomorrow’s first presidential debate between Biden and Trump, US public deficits are taking more and more center stage. The sell-off including underperformance of the long end of the curve could be related to the fact that none of them would really do something about them or on the contrary even engage on some additional fiscal spending. US yields currently add up to 5.5 bps at the very long end (30-yr). German yields add up to 2.5 bps for the longer tenors.
News & Views
The ECB published its biennial report on the progress made towards euro adoption in Bulgaria, the Czech Republic, Hungary, Poland, Romania and Sweden. As EU members they are obliged to adopt the single currency eventually. The ECB said limited progress was made since 2022 and none of them met the criteria to do so yet. Bulgaria came closest, fulfilling all but the price stability criterion. It was the only country for which the ECB also concluded “that its national legislation is consistent with the Treaty and the Statute.” Hungary’s road to the euro is the longest still, with the country meeting none of the rules, which include price stability, debt & deficit levels below 60% and 3% of GDP respectively and convergence of long-term borrowing costs. Its currency was highly volatile (not in in ERM II) and Hungary’s central bank did not comply with rules of independency and the prohibition on monetary financing. Poland and Romania performed marginally better by only fulfilling the debt condition. The Czech Republic met the interest rate and debt criteria. The ECB noted that the strength of public and economic institutions is an important factor in the sustainability of convergence over time but added that with the exception of Sweden, “the quality of institutions and governance in the countries under review remains weaker than elsewhere in the EU.”
Swiss National Bank vice-president Martin Schlegel will Thomas Jordan’s successor from October 1. Jordan unexpectedly announced to step down back in March after 12 years at the helmet. The number two’s promotion is no big surprise and follows tradition within the SNB. It is also a choice for continuity rather than spurring uncertainty by appointing an outsider. Jordan oversaw the SNB embarking on one of the most aggressive Swiss hiking cycles in the wake of the pandemic before reversing course in March. Pioneering the normalization cycle in the advanced world, Jordan’s SNB back then cut rates by 25 bps, followed by another cut last week to 1.25%. The Swiss franc trades stronger on the day though that move already happened before the announcement. EUR/CHF is trading around 0.956.
Graphs
USD/JPY: one-sided FX moves are not yet “excessive”, so JPY sell-off against strong USD continues
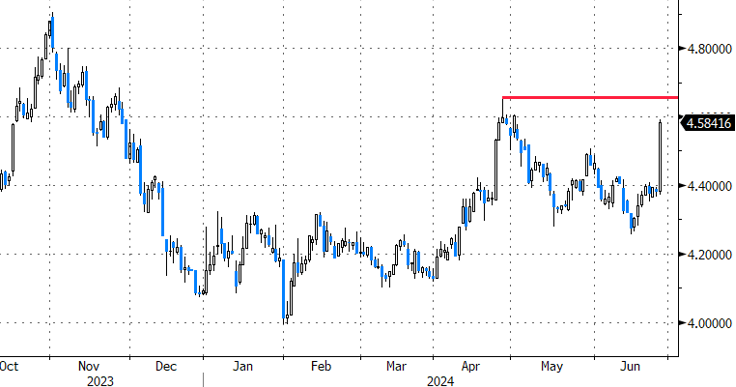
AUD 2y swap rate: sticky monthly inflation data suggest RBA will walk the rate hike talk
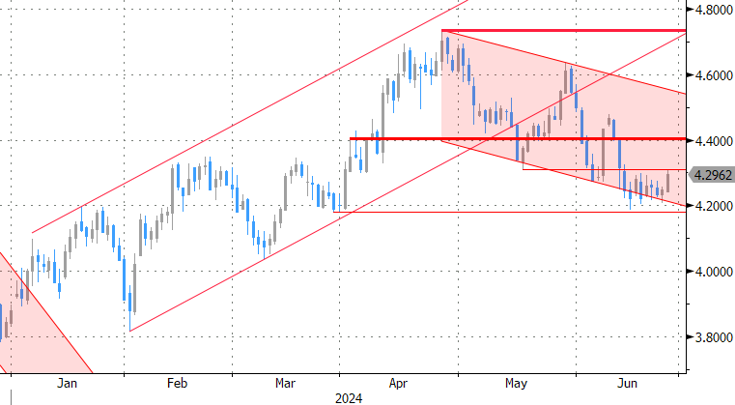
US 10-yr yield: long end underperforms. Motion of no confidence in fiscal policy ahead of presidential debate?
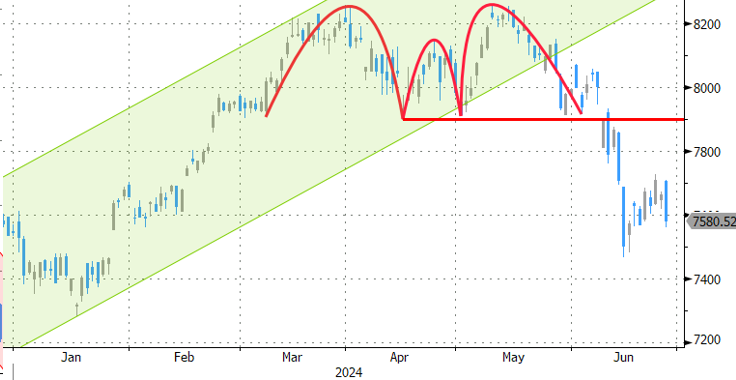
CAC40: French assets are back in underperforming modus going into Sunday’s first round of parliamentary elections
AUD/USD Surged, Buoyed by RBA Confidence and Inflation Ggrowth
The Australian dollar strengthened notably against the US dollar, with the AUD/USD pair reaching 0.6684. Australia’s May economic indicators from MI remained unchanged at zero compared to the previous value. Meanwhile, Australia’s weighted average consumer price index increased to 4.0% y/y from the last 3.6%, surpassing the less ambitious forecast of 3.8%.
Earlier statistics from Westpac also showed a rise in Australia’s consumer sentiment index in June, climbing by 1.7%, following a 0.3% decline in May.
At the Australian Banking Association conference, RBA Assistant Governor Chris Kent indicated that the Reserve Bank of Australia is not overly concerned about the growing interest in private loans among consumers. Kent highlighted the significant role that private credit plays in the market and underscored that the RBA is closely monitoring developments. However, the regulator is not overly concerned about growth in this area, as it is not particularly large in Australia.
Meanwhile, business investment is on the rise. Kent drew attention to a notable disparity between business confidence, business conditions, and consumer sentiment. The latter position appears to be below average levels.
AUDUSD technical analysis
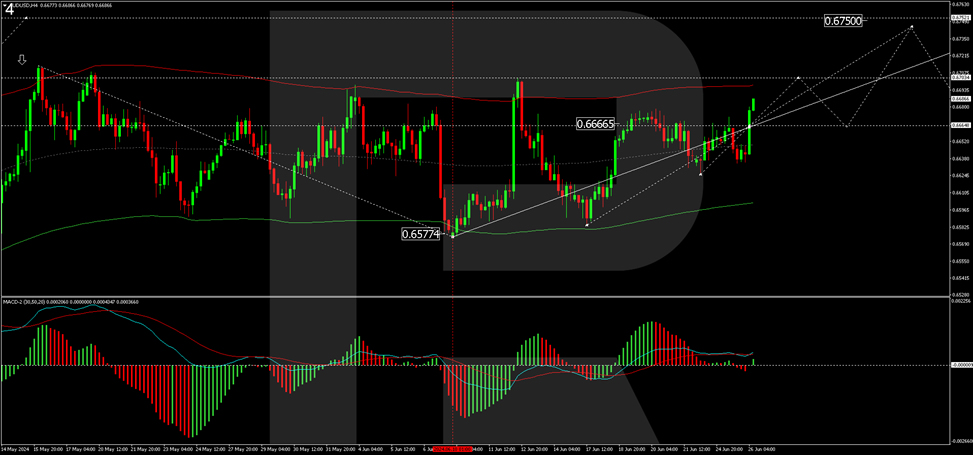
On the H4 chart of AUD/USD, the market ended the correction at 0.6577. Today, we consider a consolidation range forming around the level of 0.6666. With an upside exit, we will consider the probability of another growth structure to the level of 0.6703 with the prospect of continued growth to 0.6744. A correction link to the level of 0.6666 (test from above) is possible, followed by potential growth towards 0.6750. Technically, the MACD indicator supports this scenario. Its signal line is above the zero mark and is directed strictly upwards.
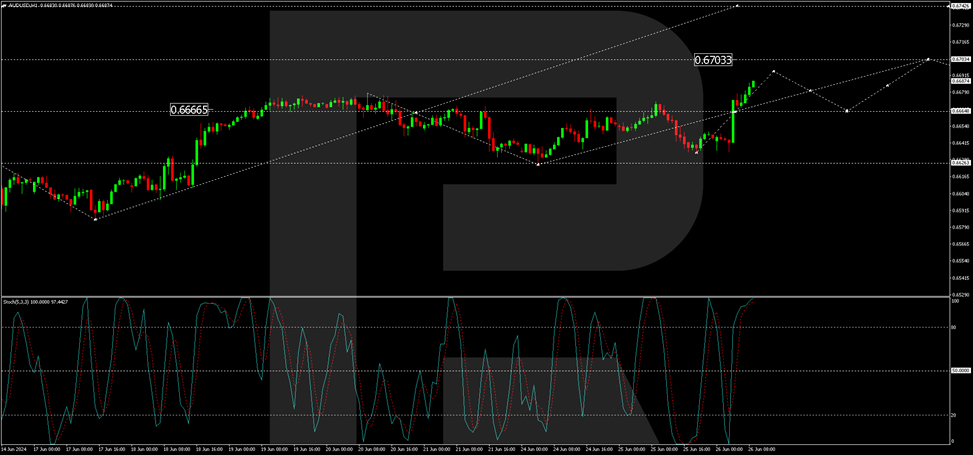
On the H1 chart of AUD/USD, a correction to 0.6626 is executed. Today, the market broke upwards to 0.6666 and continues growing towards 0.6694 with the prospect of continuing the development of the wave structure to 0.670, the local target. Technically, this scenario is confirmed by the Stochastic oscillator. Its signal line is above the level of 80. We expect the beginning of the decline to the level of 20.
EUR/USD Mid-Day Outlook
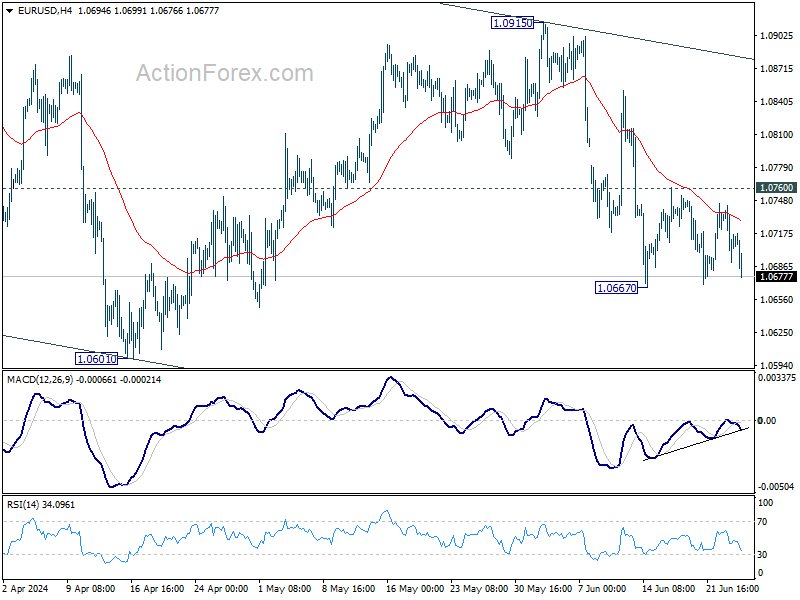
Daily Pivots: (S1) 1.0689; (P) 1.0716; (R1) 1.0742; More....
EUR/USD is still bounded in consolidation from 1.0667 and intraday bias remains neutral. Outlook stays bearish with 1.0760 resistance intact. Decline from 1.0915 is seen as another leg in the larger corrective pattern. Break of 1.0667 will target 1.0601 and below. However, firm break of 1.0760 will turn intraday bias back to the upside for stronger rebound.
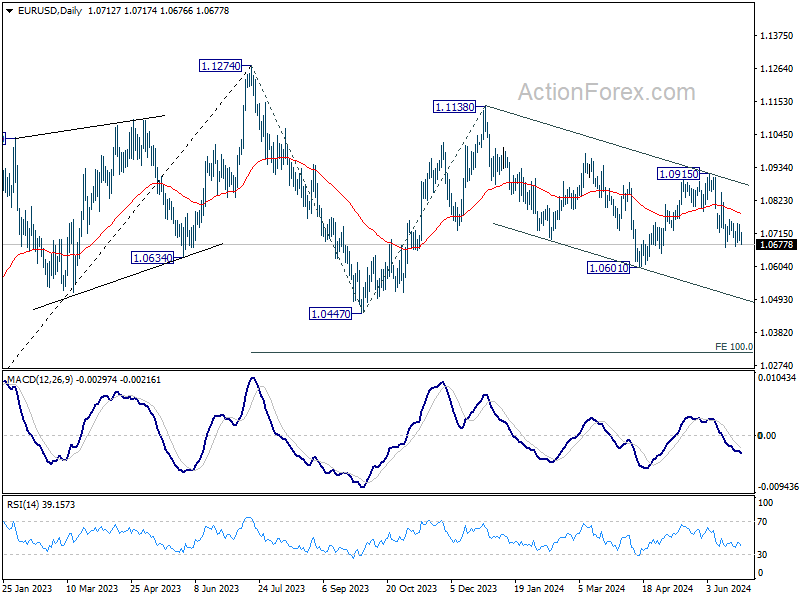
In the bigger picture, price actions from 1.1274 are viewed as a corrective pattern that's still in progress. Break of 1.0601 will target 1.0447 support and possibly further to 100% projection of 1.1274 to 1.0447 from 1.1138 at 1.0311. For now, this will remain the favored case as long as 1.0915 resistance holds, in case of rebound.
GBP/USD Mid-Day Outlook
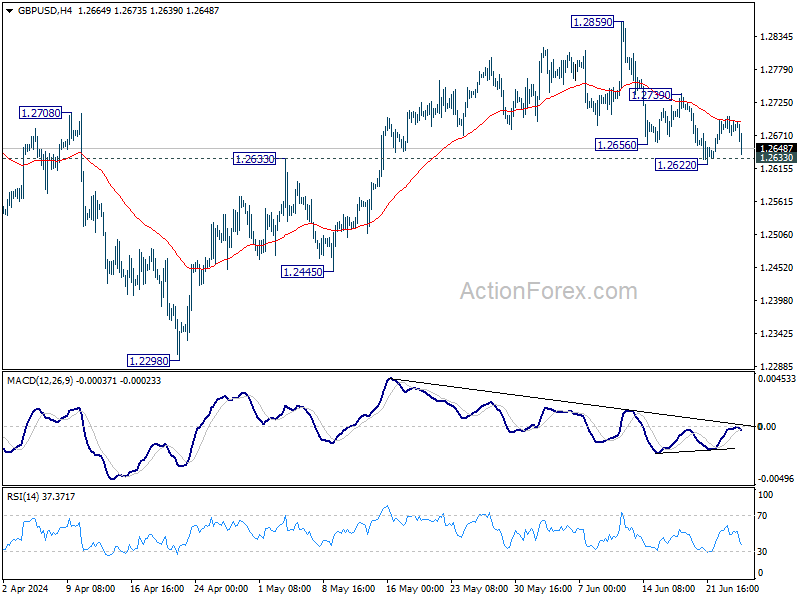
Daily Pivots: (S1) 1.2666; (P) 1.2685; (R1) 1.2704; More...
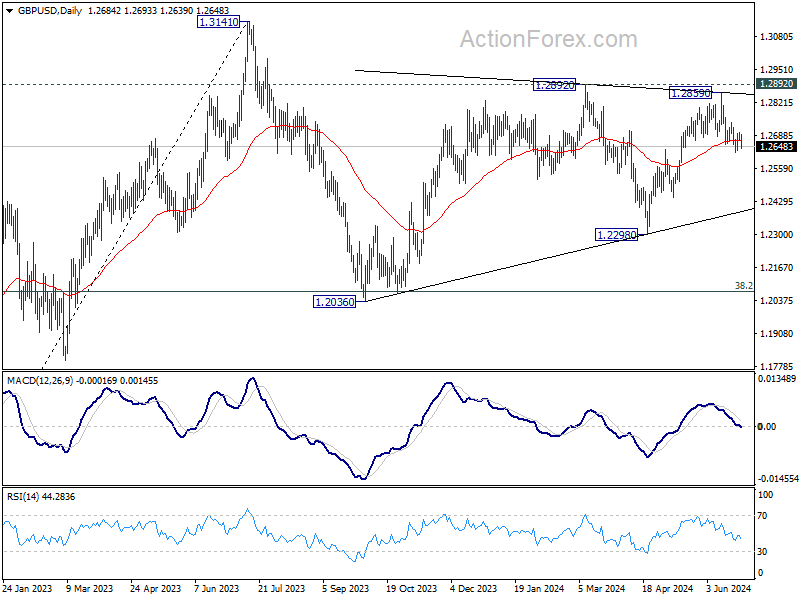
GBP/USD is staying above 1.2622 temporary low despite today's decline. Intraday bias stays neutral first. Further fall is expected as long as 1.2739 resistance holds. Break of 1.2622, and sustained trading below 1.2633 resistance turned support will argue that whole rise from 1.2298 has completed, and target 1.2445 and below. However, firm break of 1.2739 will argue that pull back from 1.2859 has completed, and bring retest of this high instead.
In the bigger picture, price actions from 1.3141 medium term top are seen as a corrective pattern that is still in progress. Break of 1.2445 support will confirm that another falling leg has started and target 1.2036 cluster support again (38.2% retracement of 1.0351 (2022 low) to 1.3141 at 1.2075. Nevertheless, break of 1.2892 resistance will argue that larger up trend from 1.0351is ready to resume through 1.3141.