

Sample Category Title
AUD/NZD: Aussie Surges Almost 1% vs Kiwi Dollar After Release of Australia’s Inflation Report
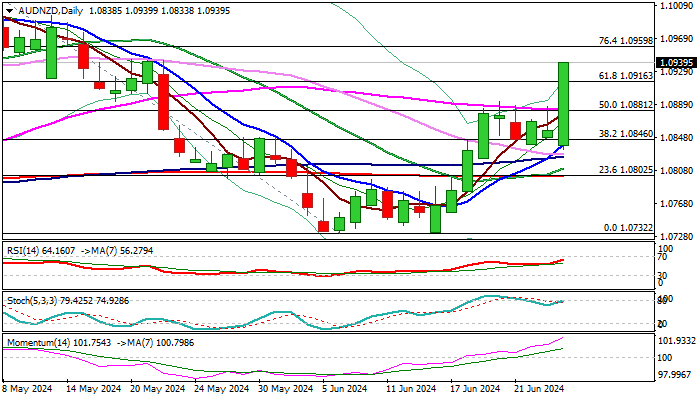
Australian dollar surged 0.9% vs Kiwi dollar in Wednesday’s morning, lifted by fresh hawkish signals that the RBA may opt for a rate hike next month, after Australia’s inflation rose above expectations and hit new multi-month high in May.
A full-figure rise broke through three Fibo barriers (38.2%; 50% and 61.8% retracement of 1.1030/1.0732 downtrend) and pressuring the top of daily cloud (1.0943).
Breach of narrowing cloud top to expose targets at 1.0959 (Fibo 76.4%) and 1.10 (psychological; Fibo 100% expansion of the current third wave of five-wave cycle from 1.0732 higher base).
Daily technical indicators are in full bullish setup but about to enter overbought territory, which may slow bulls for consolidation / limited correction.
Supports at 1.0916/1.0890 zone should contain dips and keep larger bulls intact.
Res: 1.0959; 1.1000; 1.1.1030; 1.1062.
Sup: 1.0916; 1.0890; 1.0846; 1.0825.
USDJPY Flirts With 160 Level Again
- USDJPY trades with weak momentum slightly below critical 160 level
- Overbought conditions detected; sellers wait below 158.35-159.00
- BoJ intervention is possible; US core PCE inflation due on Friday at 12:30 GMT
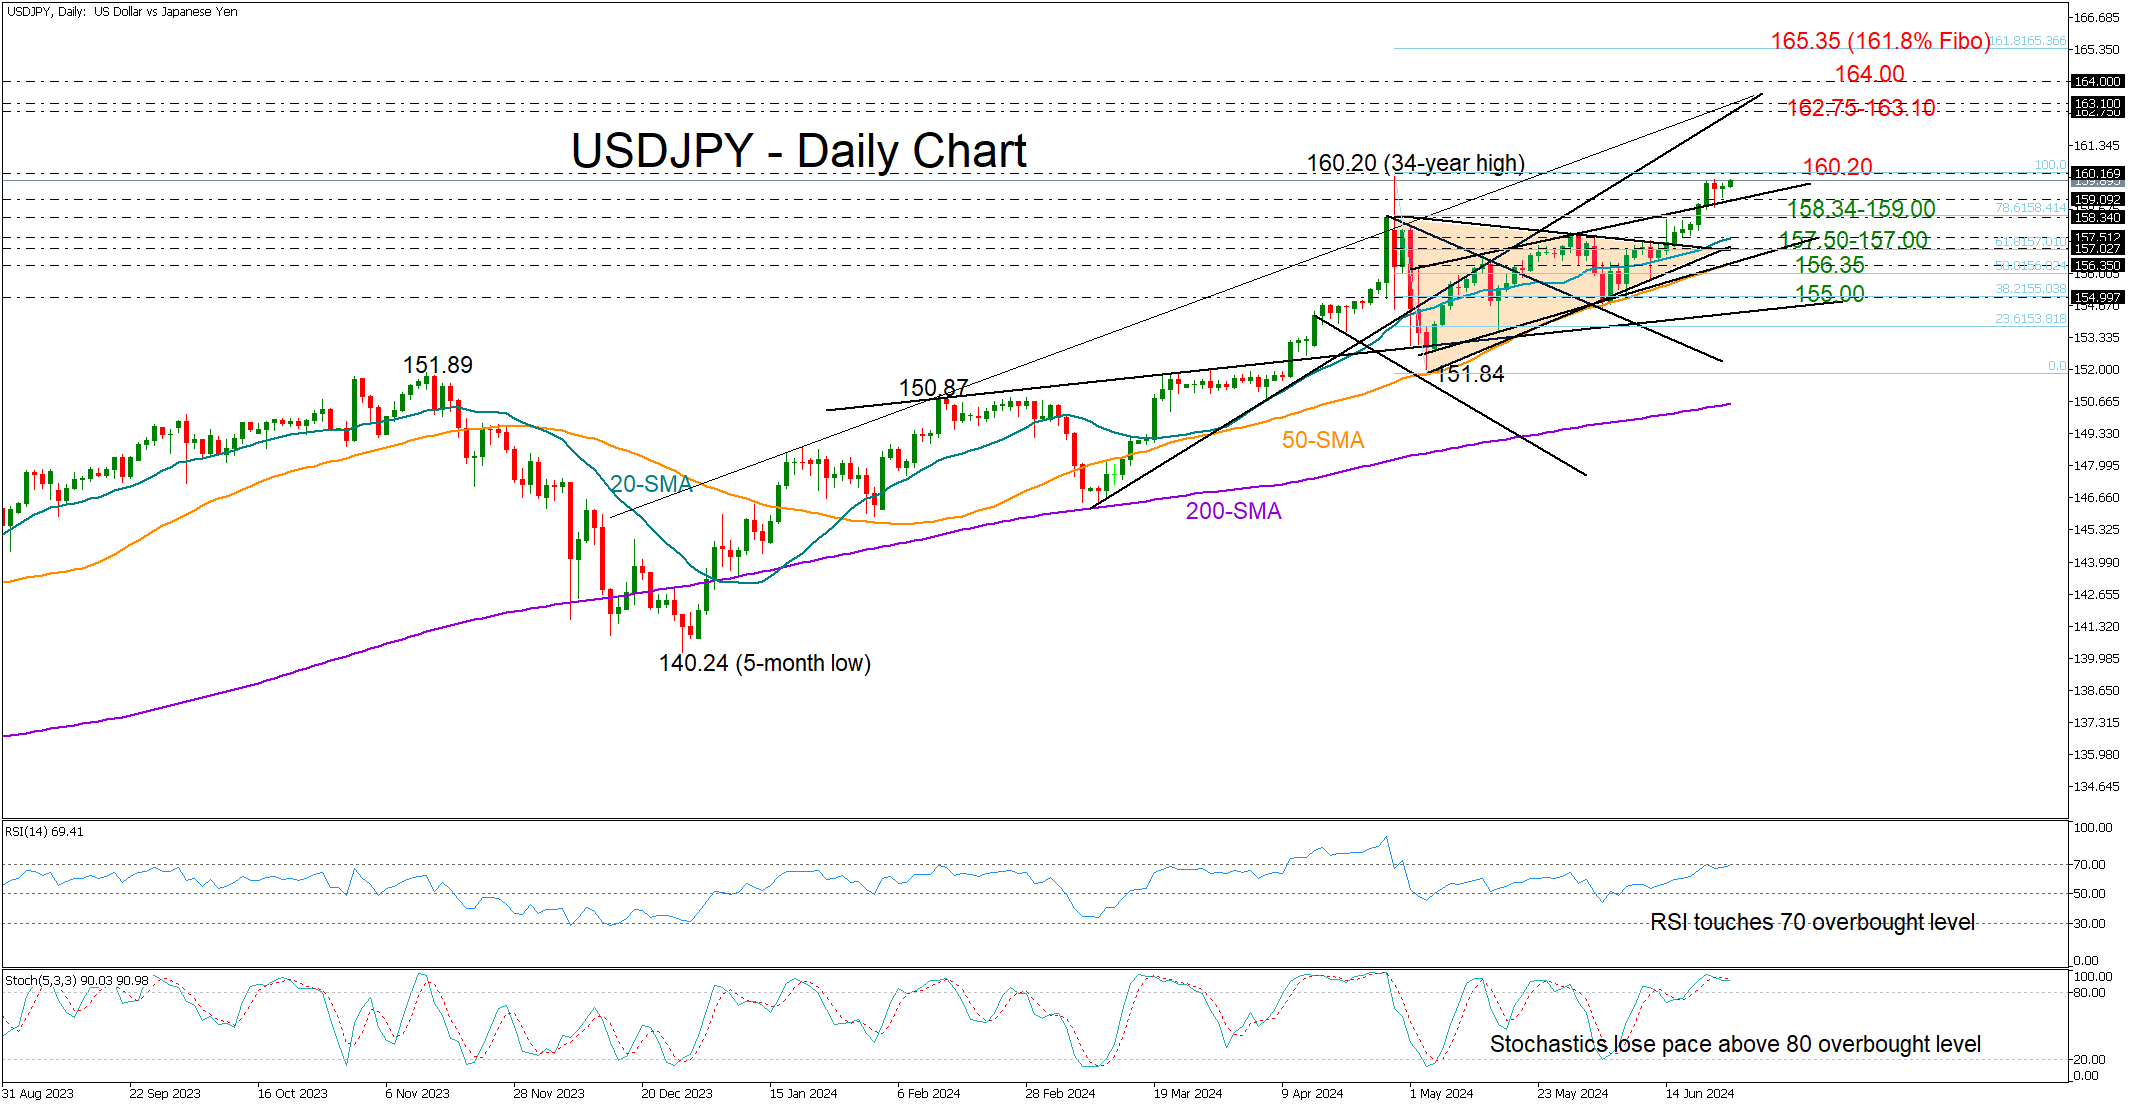
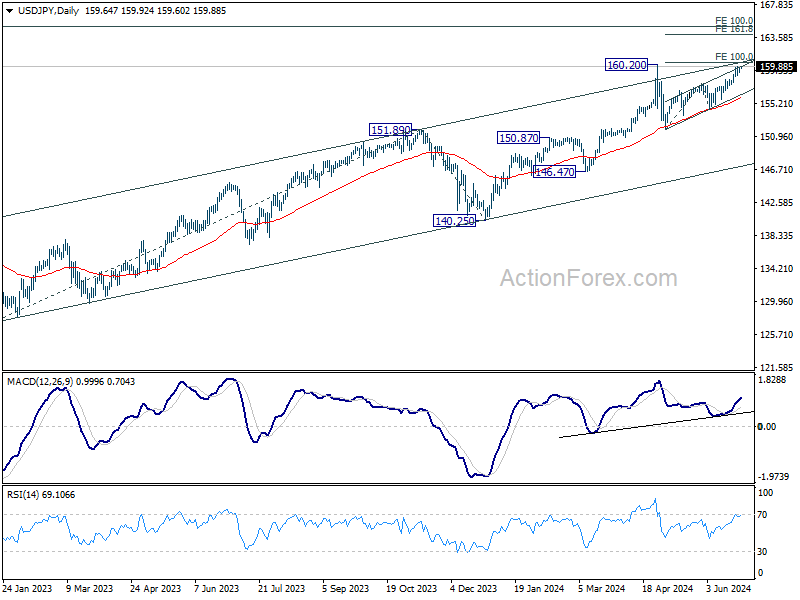
Following a constructive week, USDJPY is now hovering just below its 34-year high of 160.20, having surpassed April’s limit of 158.34 and a crucial resistance line.
The price has been facing resistance near 159.80 over the past couple of days and with the technical indicators sending overbought signals, the bulls might experience a tough session ahead. However, if the pair continues to defend itself around the 159.00 round level, hopes for another upturn may not completely fade.
A decisive move above the 160.20 peak could last till the 162.75-163.10 region, where the rising constraining lines from January and March are located. Then the door could open for the 164.00 psychological mark or the 161.8% Fibonacci extension of May’s downfall around 165.35.
Conversely, a drop below 159.00 could potentially lead to a retest of April’s limit at 158.34. A violation there would change the short-term outlook from bullish to neutral and likely force a decline towards the 20-day simple moving average (SMA) at 157.50. The 157.00 trendline zone could next challenge the bears, while lower, the 50-day SMA and the ascending trendline from May could prevent a sharp downfall to 156.35.
Overall, USDJPY has entered a caution zone, increasing the likelihood of a downside correction. Yet, the outlook would only be downgraded if the price falls below 158.34-159.00.
EUR/USD Daily Outlook
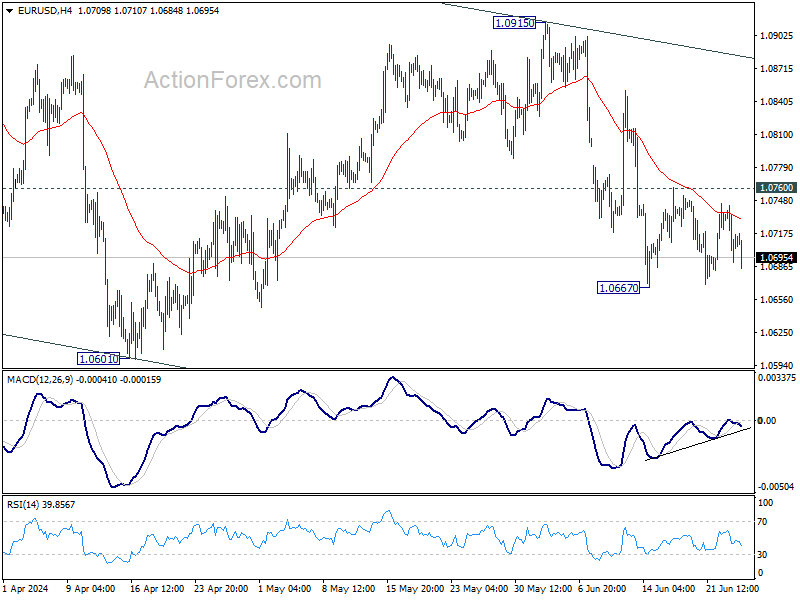
Daily Pivots: (S1) 1.0689; (P) 1.0716; (R1) 1.0742; More....
Intraday bias in EUR/USD remains neutral and outlook stays bearish with 1.0760 resistance intact. Decline from 1.0915 is seen as another leg in the larger corrective pattern. Break of 1.0667 will target 1.0601 and below. However, firm break of 1.0760 will turn intraday bias back to the upside for stronger rebound.
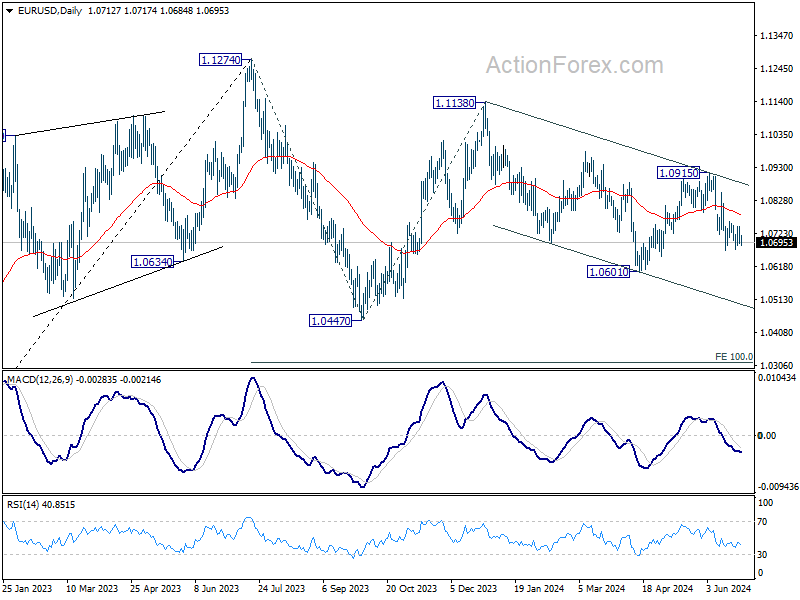
In the bigger picture, price actions from 1.1274 are viewed as a corrective pattern that's still in progress. Break of 1.0601 will target 1.0447 support and possibly further to 100% projection of 1.1274 to 1.0447 from 1.1138 at 1.0311. For now, this will remain the favored case as long as 1.0915 resistance holds, in case of rebound.
GBP/USD Daily Outlook
Daily Pivots: (S1) 1.2666; (P) 1.2685; (R1) 1.2704; More...
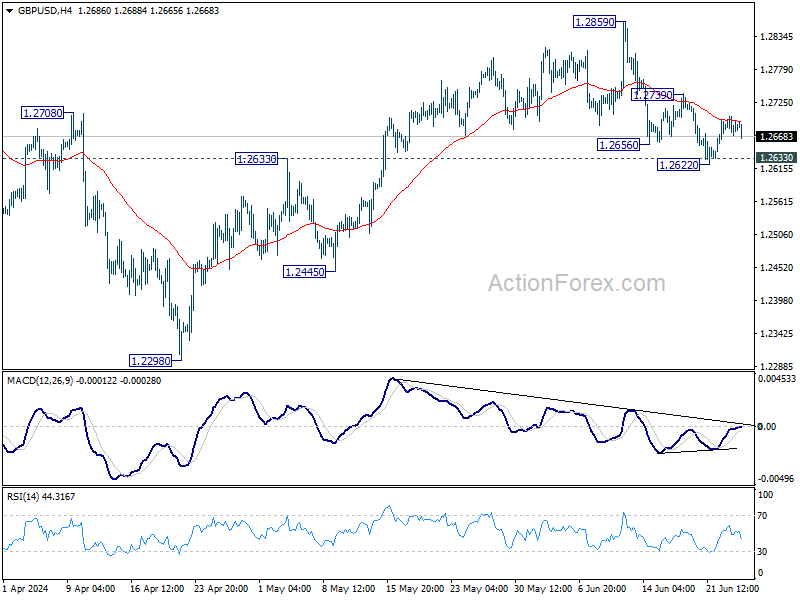
Intraday bias remains neutral for the moment, and further decline is expected in GBP/USD as long as 1.2739 resistance holds. Break of 1.2622, and sustained trading below 1.2633 resistance turned support will argue that whole rise from 1.2298 has completed, and target 1.2445 and below. However, firm break of 1.2739 will argue that pull back from 1.2859 has completed, and bring retest of this high instead.
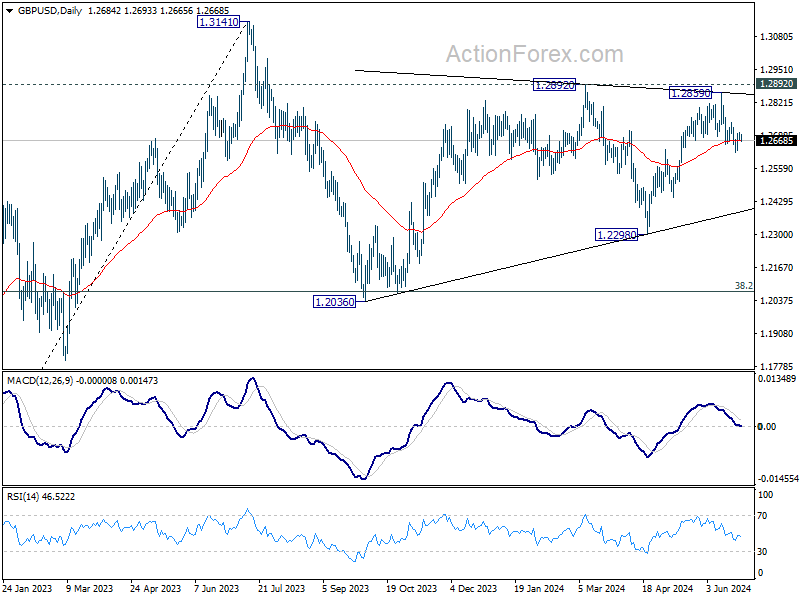
In the bigger picture, price actions from 1.3141 medium term top are seen as a corrective pattern that is still in progress. Break of 1.2445 support will confirm that another falling leg has started and target 1.2036 cluster support again (38.2% retracement of 1.0351 (2022 low) to 1.3141 at 1.2075. Nevertheless, break of 1.2892 resistance will argue that larger up trend from 1.0351is ready to resume through 1.3141.
USD/CHF Daily Outlook
Daily Pivots: (S1) 0.8923; (P) 0.8938; (R1) 0.8964; More….
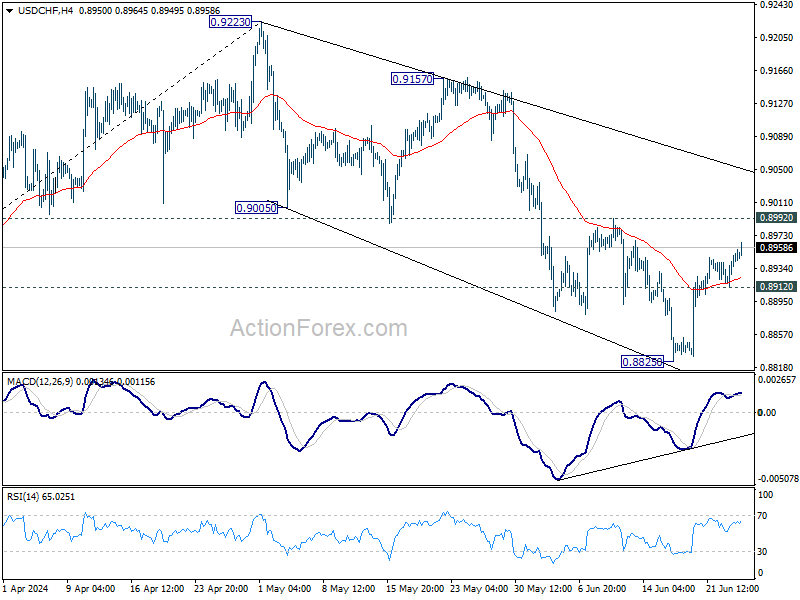
Intraday bias in USD/CHF remains neutral for the moment. While recovery from 0.8825 might still extend, near term outlook will stay bearish with 0.8992 resistance intact. Below 0.8912 minor support will bring retest of 0.8825 low. Firm break there will resume the fall from 0.9223 to 61.8% retracement of 0.8332 to 0.9223 at 0.8672.
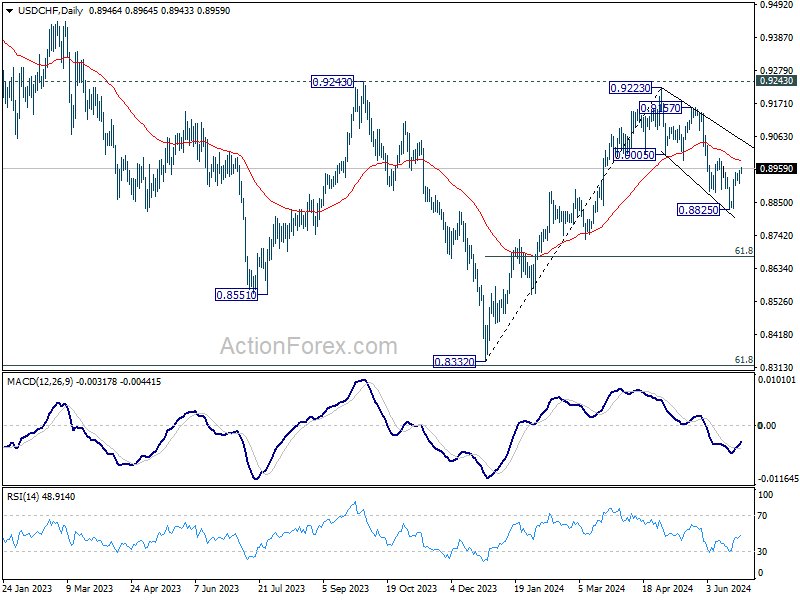
In the bigger picture, price actions from 0.8332 medium term bottom are seen as developing into a corrective pattern to the down trend from 1.0146 (2022 high). Rejection by 0.9243 resistance affirms this case, and maintains medium term bearishness. While more range trading could be seen between 0.8332/0.9243 first, downside break out is mildly in favor at a later stage.
USD/JPY Daily Outlook
Daily Pivots: (S1) 159.33; (P) 159.55; (R1) 159.90; More...
Outlook in USD/JPY remains unchanged and intraday bias stays neutral first. Further rise will remain in favor as long as 157.70 resistance turned support holds. Sustained break of 106.20 and 100% projection of 151.86 to 157.70 from 154.53 at 160.37 will confirm long term up trend resumption, and pave the way to 161.8% projection at 163.97. Nevertheless, firm break of 157.70 will turn bias back to the downside for channel support (now at 156.41) first.
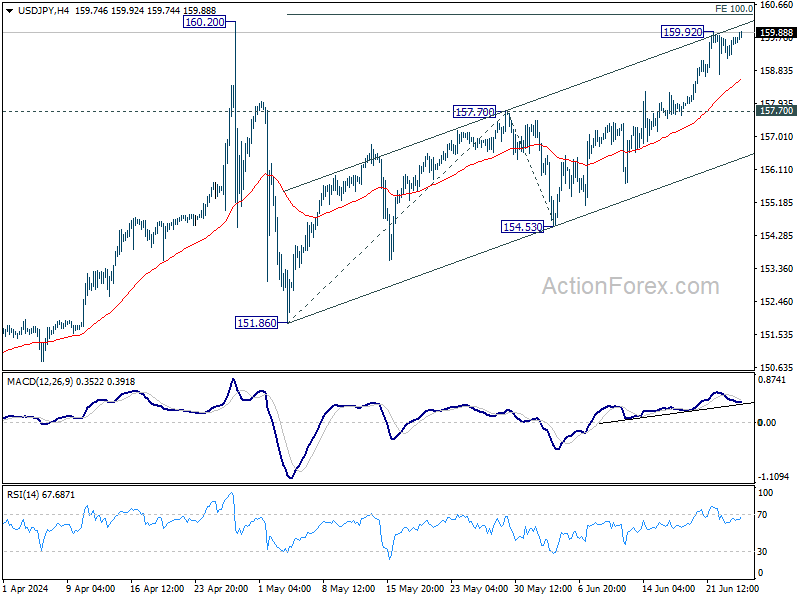
In the bigger picture, there is no sign of long term trend reversal yet. Further rally is expected as long as 150.87 resistance turned support holds. Decisive break of 160.02 will target 100% projection of 127.20 to 151.89 from 140.25 at 164.94.
GBPUSD Bounces Off 50-Day SMA
- GBPUSD rebounds from a 1-month low
- But the price trades flat in past couple of sessions
- Momentum indicators improve but remain neutral
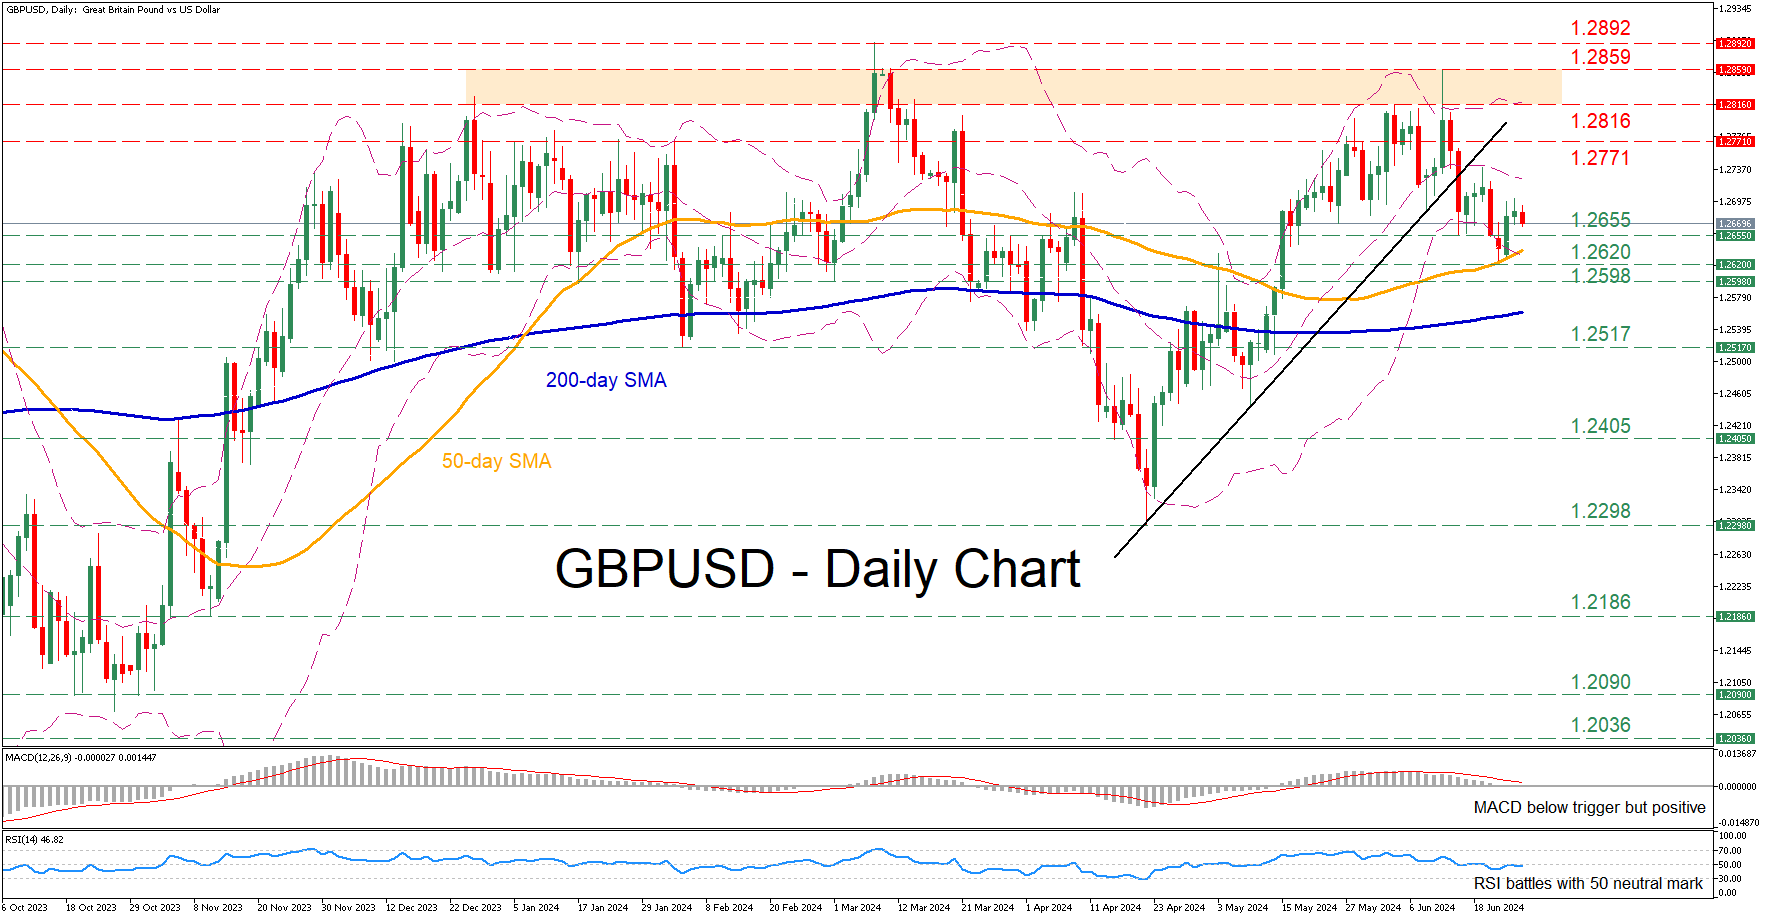
GBPUSD came under some selling pressure following its recent three-month peak of 1.2859, breaking below the short-term ascending trendline that connects its higher lows since April. Moreover, the pair fell to a fresh one-month low last week, but the 50-day simple moving average (SMA) prevented further retreats.
Should the short-term pullback extend, the June support of 1.2655 could act as the first line of defence. Sliding beneath that floor, the price could descend towards the recent one-month bottom of 1.2620. Failing to halt there, the pair might challenge 1.2598, a region that held strong both in January and March.
Alternatively, if the bulls regain the upper hand, the January-February resistance region of 1.2771 may come under examination. A violation of that zone could pave the way for the 1.2816-1.2859 range, defined by the recent three-month peak and the December 2023 high. Jumping above that range, the pair could revisit its 2024 high of 1.2892.
Overall, GBPUSD managed to pause its decline at the 50-day SMA, but its rebound does not look very promising. For that bearish sentiment to alter, the pair needs to break its short-term structure of lower lows.
EURGBP Lacks Clear Direction in Short-Term
- EURGBP fails to recoup the negative gap
- RSI ticks down but MACD stands above its trigger line
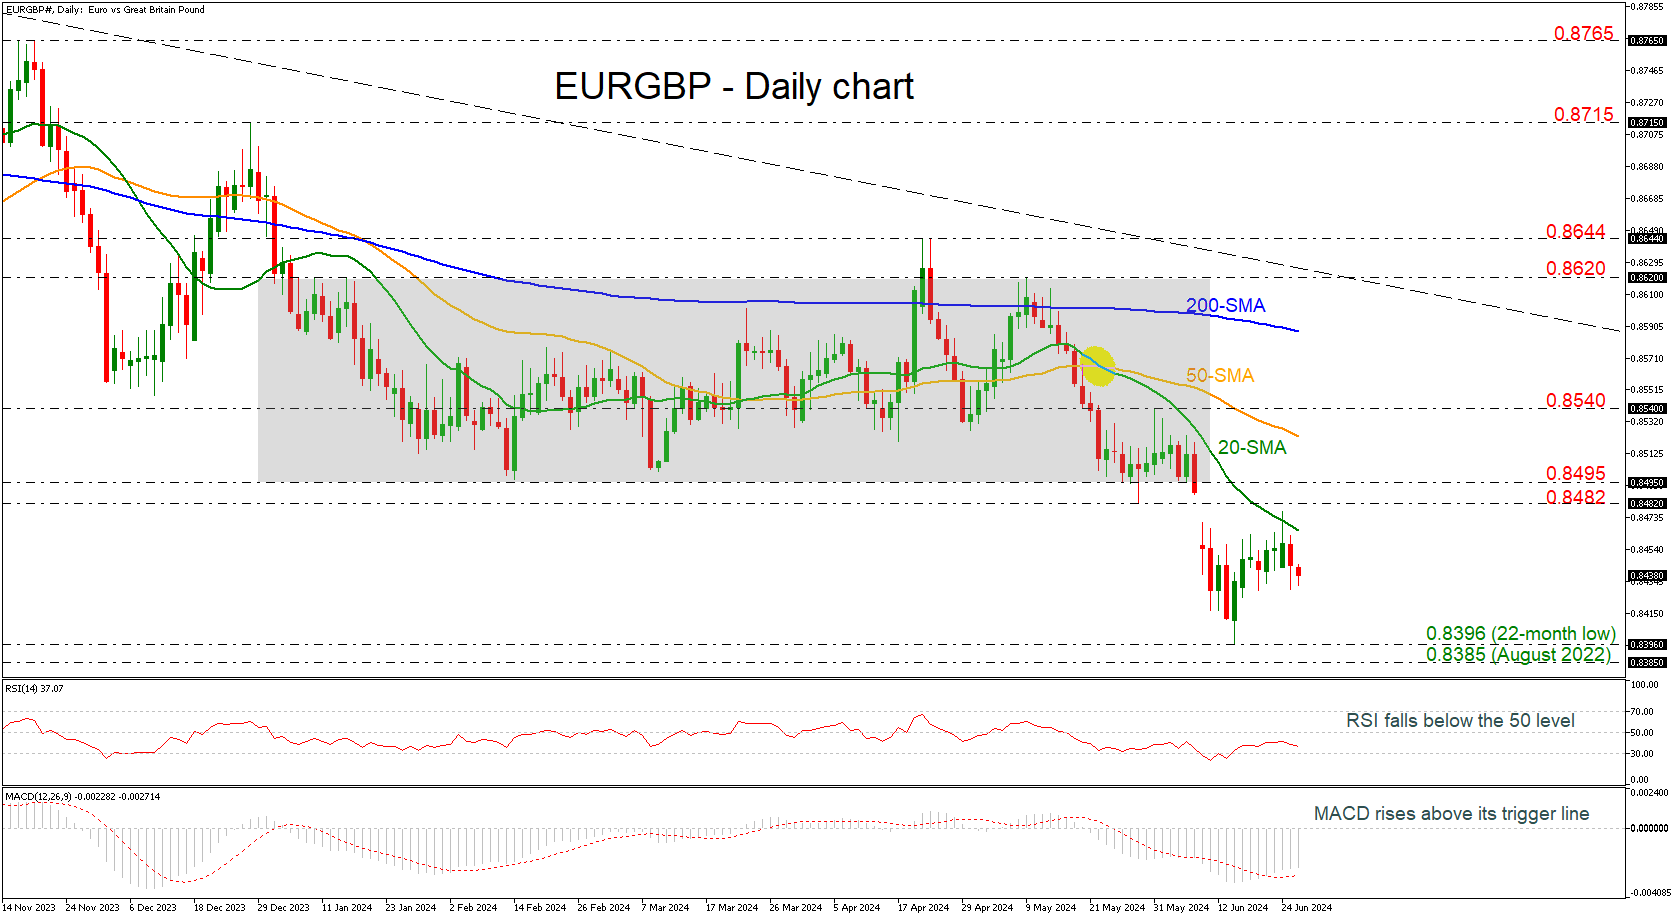
EURGBP is heading south after the pullback off the 20-day simple moving average (SMA) around 0.8465. The pair is moving sideways after the European elections and the negative gap that was posted back on June 10.
Technically, the momentum oscillators indicate mixed signals. The RSI is sloping down beneath the neutral threshold of 50; however, the MACD oscillator is holding above its trigger line beneath the zero level.
If prices continue to move lower, support should come from the 22-month low of 0.8396 ahead of the August 2022 bottom at 0.8385.
However, should an upside reversal take form, immediate resistance will likely come from the 20-day SMA at 0.8465 ahead of recouping the gap and meeting the 0.8482-0.8495 restrictive region. A break higher could switch the outlook back to neutral one, testing the 50-day SMA at 0.8520.
In the medium-term, the outlook remains negative since prices hold below all the moving average lines and the bearish cross between the 20- and the 50-day SMA stays in place.
AUD/USD: Jumps on Higher Than Expected Australian Inflation
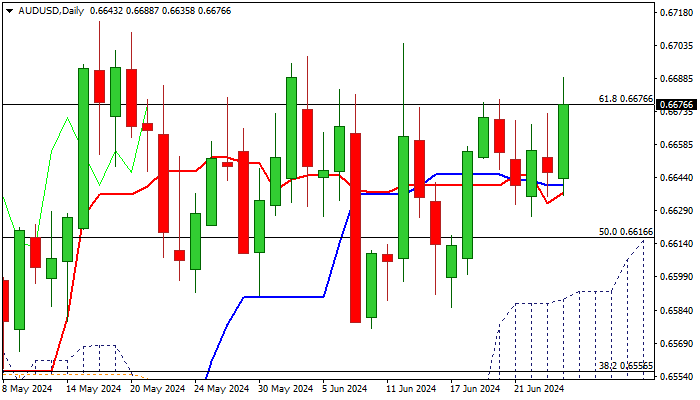
Australian dollar rose 0.6% in early Wednesday, lifted by higher than expected inflation (May 4.0% vs 3.6% in April and 3.8% f/c), which hit the highest in six months.
Fresh rise in consumer prices adds to RBA’s hawkish stance, with jump in bets for August rate hike making the Aussie dollar more attractive.
Near-term action remains underpinned by rising and thickening daily Ichimoku cloud, Ma’s in bullish setup and 14-d momentum ascending above the centreline.
Fresh bulls probe again through pivotal Fibo barrier at 0.6676 (61.8% of 0.6871/0.6362) where a number of attacks in past three weeks failed and guards key barriers at 0.6691/94 (2024 peaks), break of which to signal continuation of larger uptrend from 0.6362 (2024 low).
Initial supports lay at 0.6646/43 (converging 10/20DMA’s) and 0.6626 (June 26 low) guarding daily cloud top (0.6592).
Res: 0.6694; 0.6714; 0.6728; 0.6750.
Sup: 0.6653; 0.6626; 0.6616; 0.6592.
Aussie Forming Bullish Triangle, Looking for a Break Higher
The Australian dollar is still sideways against the US dollar, trapped in a range for more than a month. However, the price is now moving towards the upper side of thE pattern, suggesting a greater chance that this could be a bullish triangle rather than a deeper corrective move that would take us back to 0.6570. If this analysis is correct, we are currently in a subwave d, meaning there could still be some intraday weakness down to the 0.6620 to 0.6640 potential support levels. This leg down, would be wave "e" then, the final piece of this bullish structure, which should eventually take the price higher.
However, if the price closes above 0.6700 today or tomorrow, the triangle is most likely already finished, and we should expect a straight move higher, possibly even to the 0.6780 area.
I also covered Aussie in our video below.
https://www.youtube.com/watch?v=egoDOIBDzME&t=706s