Sample Category Title
EUR/GBP: At New Multi-Month Low But Bears May Pause on Oversold Conditions
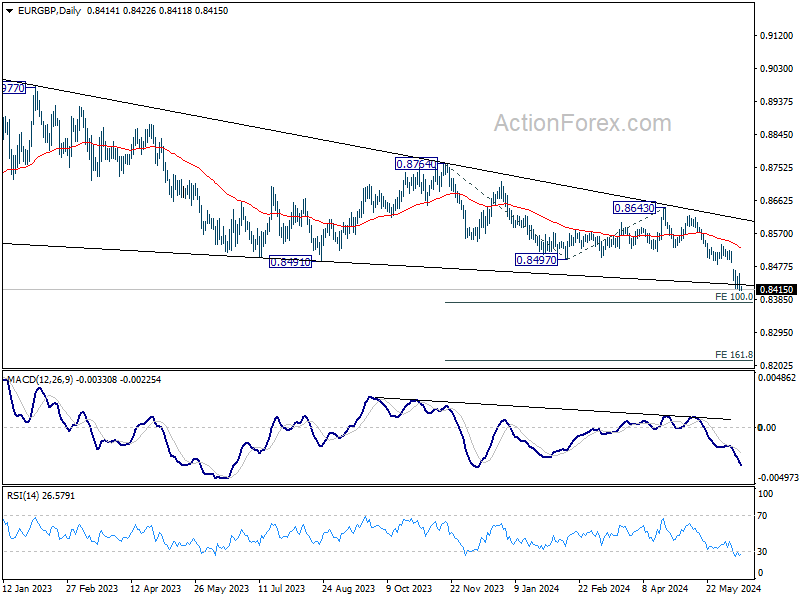
EURGBP hits new multi-month low (the lowest since early Aug 2022) on Friday and is on track for the biggest weekly loss since the first week of January, after starting to trade this week with gap lower, weighed by growing political uncertainty in France.
Bears cracked psychological 0.8400 support and eye target at 0.8339 (2 Aug 2022 low), but oversold daily studies suggest that consolidation / limited correction may precede.
Upticks should be capped under falling 10DMA (0.8468) to keep larger bears intact.
Only stronger bounce which would fill this week’s gap, would put bears on hold and allow for stronger correction.
Res: 0.8423; 0.8450; 0.8468; 0.8492.
Sup: 0.8397; 0.8339; 0.8276; 0.8211.
XTIUSD: Bearish and Bullish Scenarios, Key Levels, and Market Insights
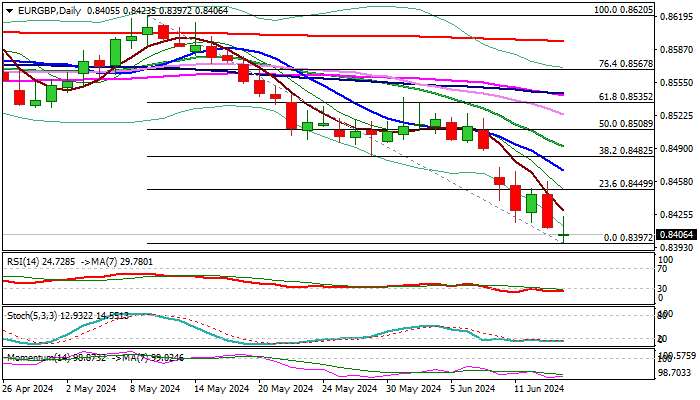
Bearish Scenario: Sell below 77.50/77.81 with TP1: 77.36, TP2: 76.91, TP3: 76.26, and TP4: 76.00, with S.L. above 78.53 or at least 1% of account capital.
Bullish Scenario: Buy above 78.70 with TP1: 79.00 and TP2: 79.90, with S.L. below 78.00 or at least 1% of account capital. Apply trailing stop.
Fundamental Analysis:
The price of crude oil marked a significant drop on Wednesday following a substantial increase in crude inventories reported by the U.S. International Energy Agency (IEA) after hitting a key selling zone on May 30.
Subsequently, in a recent report, the IEA indicated that it believes oil demand will peak in early 2029 at around 106 million bpd, after projecting a peak for 2030. This report was supported by a similar one published by OPEC, which led to a recovery in prices on Thursday, a move that was almost completely discounted shortly after.
This optimism is supported by the seasonality of crude oil, where the summer months tend to be bullish due to increased fuel demand driven by higher travel and tourism.
However, there is still a bearish price trend, given the current higher supply, with countries like Russia reporting that their oil production in May exceeded the quotas agreed upon by the OPEC+ alliance.
Additionally, after the Fed left a perspective of higher rates for a longer period with just one rate cut, it is inferred that higher interest rates hinder economic growth, which in turn negatively impacts oil demand, a current driver that can keep prices under pressure.
Technical Analysis:
XTIUSD
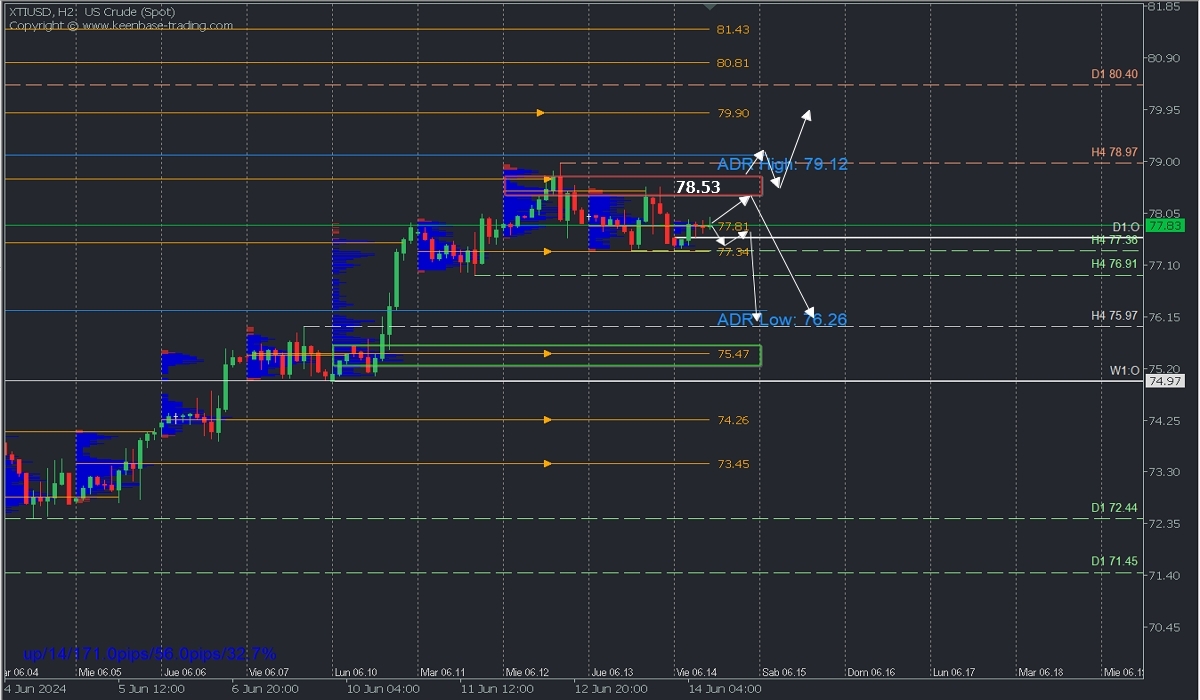
- Average Daily Range High (ADR High): 79.12
- Average Daily Range Low (ADR Low): 76.26
- Supply Zones (Sells): 78.46
- Demand Zones (Buys): 77.34
The price rally shows signs of exhaustion after forming a failure below the 78.97 resistance and creating a supply zone between 78.53 and 78.68, where the price is expected to rise to seek liquidity during the European morning before a new price decline is anticipated.
The continuation of the bearish price trend should follow two basic patterns:
1. Stay below the indicated supply zone marked with a red rectangle.
2. Decisively break, at least on a second touch, the demand zone around 77.34, opening the possibility to continue bearish towards 76.91 and the average daily range low at 76.26 intraday, the support at 75.97, and the demand zone around 75.47.
The anticipated bearish scenario will activate with the price below 77.81, the POC of the early sessions, and the break of the 77.36 support.
This scenario will be invalidated if the quotations decisively break the supply zone around 78.53, indicating a bullish continuation towards 79.00 and more extended to the supply zone at 79.90.
*Uncovered POC (Point of Control): POC = Point of Control: This is the level or zone where the highest volume concentration occurred. If there was a prior bearish movement from it, it is considered a sell zone and forms a resistance zone. Conversely, if there was a prior bullish movement, it is considered a buy zone, usually located at lows, thus forming support zones.
Crypto Bears in Charge
Market picture
Crypto market capitalisation fell 0.5% to $2.44 trillion as Thursday’s growth attempt failed to gain traction due to a new wave of dollar strength. Risk demand is gradually diminishing, forming a sequence of declining intraday highs. However, horizontal support remains in the 2.42 trillion area, where the market also stabilised from May 17th to 20th.
Bitcoin has pulled back below $67K, losing 0.7% in 24 hours. It continues to test the strength of the 50-day moving average, but it doesn’t find enough reason to dive lower. Such persistent testing of the lows sets the bears up for quick success with their next target at $60K.
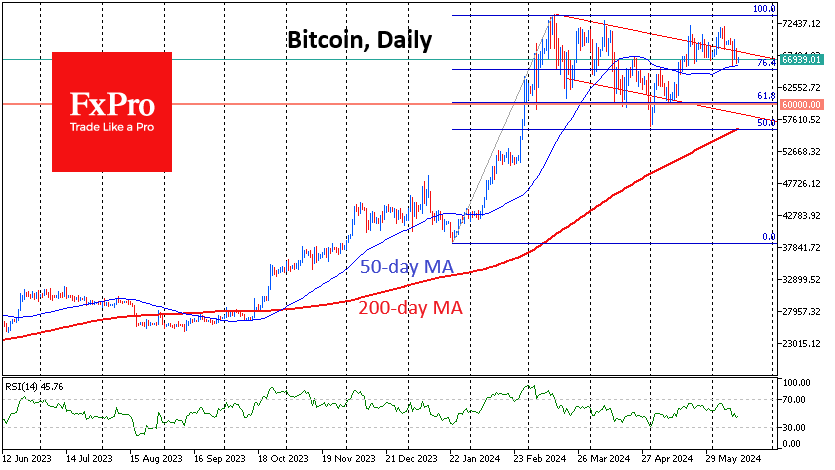
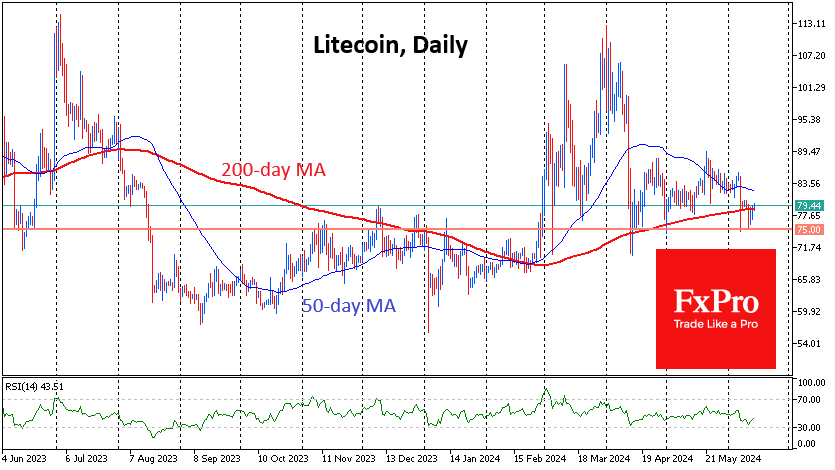
Litecoin is trying to cling to the 200-day moving average near $79.4. There has been support around $75 since March, which has been actively playing the role of resistance from November to January. A failure below promises to be a significant trend reversal signal, with next supports near $67 and $60.
News background
JPMorgan questioned the sustainability of the inflow of funds into spot bitcoin-ETFs. According to the bank’s experts, “the high rate of BTC both in relation to the cost of its mining and to the price of gold” may lead to a slowdown in investment growth.
According to on-chain analyst Ali Martinez, the reduced profitability of bitcoin mining due to the April halving has triggered a “wave of capitulation” by miners. Thus, it has simply not been profitable for most miners to mine Bitcoin lately.
Terraform Labs and its co-founder Do Kwon will pay the SEC $4.47bn after settling the ecosystem collapse. Terraform Labs will cease operations and hand over management of the network to the community.
MicroStrategy will place $500 million in eight-year convertible unsecured notes to “acquire additional bitcoins and fund general corporate purposes.”
The Block estimated that funds distributed through airdrops have exceeded $4bn since the beginning of the year. The top three largest airdrops were Jupiter, StarkNet, and Notcoin. Based on the number of tokens issued and average quotes in the following months, each project distributed about $1 bn. Airdrops from Wormhole, Ether follow them.fi, Friend.Tech, and Wen.
Australian authorities have banned the use of cryptocurrencies for online casino gambling. Companies that do not comply with the rules face fines of more than A$230K.
NZD/USD Exchange Rate Falls from Nearly 5-Month High
The NZD/USD exchange rate has dropped from its highest level in nearly five months. On Wednesday, following the release of US inflation data, the NZD/USD rate exceeded 0.6220 for the first time since 15 January 2024.
However, today the rate has fallen approximately 1.3% from Friday’s peak, suggesting that the market's reaction to the US inflation news was overly emotional.
According to Reuters:
→ Fed Chair Jerome Powell indicated a readiness to keep rates steady until clearer economic signals suggest a need for cuts.
→ Traders have reduced the likelihood of a Fed rate cut at the September meeting.
Meanwhile, the Reserve Bank of New Zealand does not plan to cut rates at all in 2024. According to Trading Economics, any rate cuts are unlikely before mid-2025.
Thus, the policies of the two central banks are balanced, and the current drop from nearly a 5-month high may be a return to a more balanced valuation after an emotional surge into overbought territory.
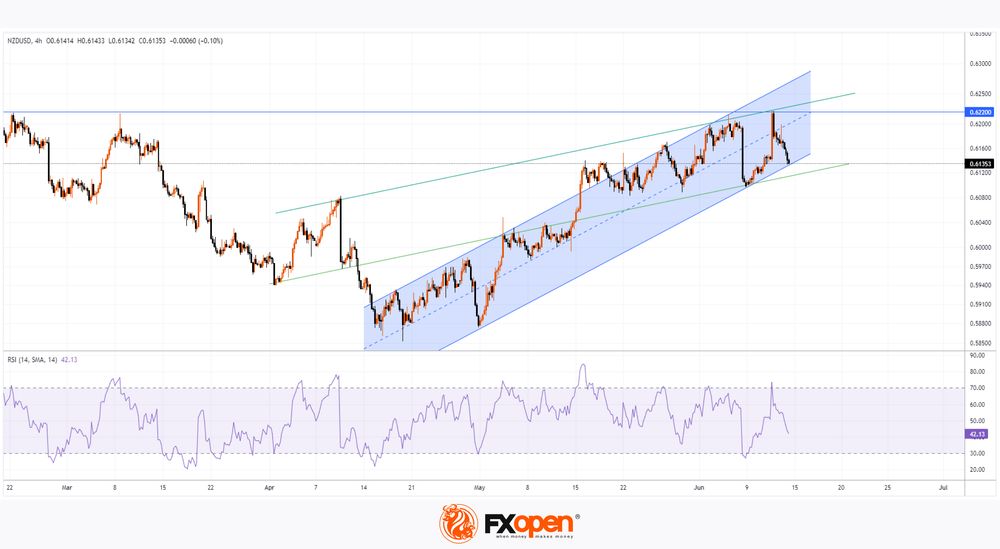
The RSI indicator supports this view.
Further technical analysis of the NZD/USD chart provides more valuable insights:
→ Since mid-April, the market has been in an ascending channel (shown in blue);
→ The June peak appears to be a false breakout of the April-March highs;
→ This week, the price failed to reach the upper boundary of the channel and fell sharply to the lower boundary – a bearish sign.
The lower boundary may provide support after Thursday's decline, but if this only leads to a weak rebound, the channel could become more vulnerable to a bearish breakout.
Trade over 50 forex markets 24 hours a day with FXOpen. Take advantage of low commissions, deep liquidity, and spreads from 0.0 pips. Open your FXOpen account now or learn more about trading forex with FXOpen.
This article represents the opinion of the Companies operating under the FXOpen brand only. It is not to be construed as an offer, solicitation, or recommendation with respect to products and services provided by the Companies operating under the FXOpen brand, nor is it to be considered financial advice.
Market Analysis: GBP/USD and EUR/GBP Poised For More Losses
GBP/USD failed to climb above 1.2860 and trimmed all gains. EUR/GBP is declining and trading below the 0.8410 support level.
Important Takeaways for GBP/USD and EUR/GBP Analysis Today
- The British Pound is showing bearish signs below 1.2800.
- There is a key bearish trend line forming with resistance near 1.2765 on the hourly chart of GBP/USD at FXOpen.
- EUR/GBP is declining and showing bearish signs below 0.8460.
- There is a major declining channel forming with support at 0.8410 on the hourly chart at FXOpen.
GBP/USD Technical Analysis
On the hourly chart of GBP/USD at FXOpen, the pair started a fresh decline from the 1.2860 zone. As mentioned in the previous analysis, the British Pound struggled to extend gains and declined below the 1.2800 support level against the US Dollar.
There was a clear move below the 61.8% Fib retracement level of the upward move from the 1.2706 swing low to the 1.2860 high. The pair even settled below the 1.2765 level and the 50-hour simple moving average.

The pair tested the 1.2740 support zone and the 76.4% Fib retracement level of the upward move from the 1.2706 swing low to the 1.2860 high.
It is now consolidating losses above the 1.2740 level. On the upside, the GBP/USD chart indicates that the pair is facing resistance near 1.2765 and a connecting bearish trend line. The next major resistance is near the 50-hour simple moving average at 1.2780.
A close above the 1.2780 resistance zone could open the doors for a move toward 1.2825. Any more gains might send it toward 1.2860. If not, the pair could resume its decline below 1.2740. On the downside, there is a key support forming near 1.2710.
If there is a downside break below the 1.2710 support, the pair could accelerate lower. The next major support is near the 1.2690 zone, below which the pair could test 1.2650. Any more losses could lead the pair toward the 1.2550 support.
EUR/GBP Technical Analysis
On the hourly chart of EUR/GBP at FXOpen, the pair struggled to gain pace for a move above 0.8520. The Euro settled below 0.8490 and started a fresh decline against the British Pound.
There was a clear move below the 0.8470 pivot level. The EUR/GBP chart suggests that the pair settled below the 50-hour simple moving average and 0.8460. A low is formed near 0.8412 and the pair is now consolidating losses.

Immediate resistance is near the 50% Fib retracement level of the downward move from the 0.8457 swing high to the 0.8412 low at 0.8435 and the 50-hour simple moving average.
The next major resistance could be near the 76.4% Fib retracement level of the downward move from the 0.8457 swing high to the 0.8412 low at 0.8445. A close above the 0.8445 level might accelerate gains. In the stated case, the bulls may perhaps aim for a test of 0.8470. Any more gains might send the pair toward the 0.8490 level.
Immediate support sits near 0.8410. There is also a major declining channel forming with support at 0.8410. The next major support is near 0.8380. A downside break below the 0.8380 support might call for more downsides. In the stated case, the pair could drop toward the 0.8350 support level.
Trade over 50 forex markets 24 hours a day with FXOpen. Take advantage of low commissions, deep liquidity, and spreads from 0.0 pips. Open your FXOpen account now or learn more about trading forex with FXOpen.
This article represents the opinion of the Companies operating under the FXOpen brand only. It is not to be construed as an offer, solicitation, or recommendation with respect to products and services provided by the Companies operating under the FXOpen brand, nor is it to be considered financial advice.
Japanese Yen Fell to a Six-Week Low after Bank of Japan Ended Its Meeting
The Japanese yen exchange rate paired with the US dollar looks unimpressive by the end of this week. The USD/JPY pair rose to almost 158.00 immediately after the end of the June meeting of the Bank of Japan, which left the interest rate unchanged. Everything went according to expectations.
In March, the BoJ raised the rate for the first time in seven years, moving it from negative territory to zero.
In its comments, the regulator noted that it will continue to buy Japanese government bonds at the same pace as agreed in March until its July meeting. Thus, market expectations were ignored, which worked against the JPY. Investors hoped that the BoJ would at least carefully consider gradually reducing its balance sheet through government bonds as part of a smooth monetary policy transition from quantitative easing to tightening.
Previously, Bank of Japan Governor Kazuo Ueda confirmed the regulator's intention to gradually reduce its substantial balance sheet in the future. However, the timing of this action remains uncertain.
USD/JPY Technical Analysis
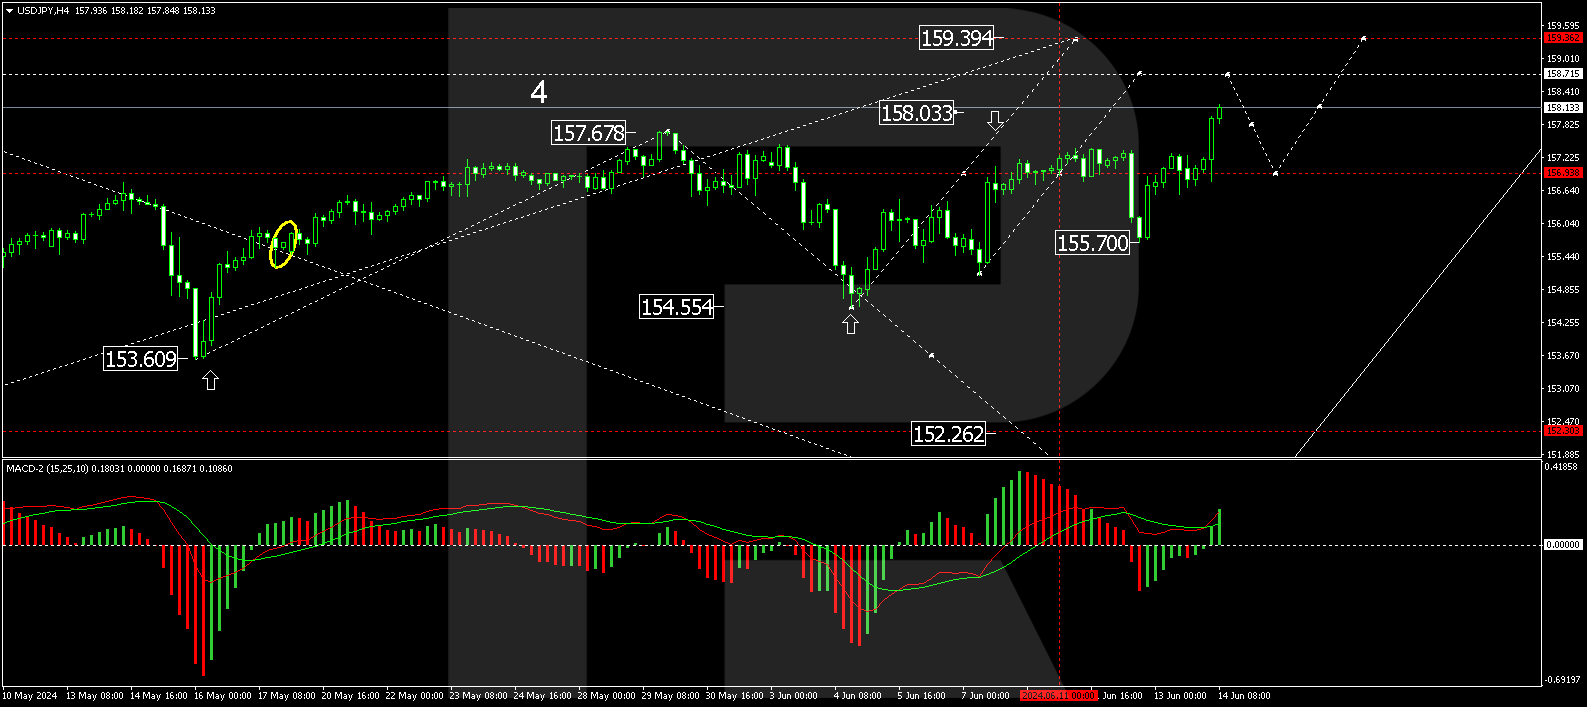
On the H4 USD/JPY chart, the market has breached 157.47 upwards and is continuing to develop a growth wave towards 158.74. After reaching this level, a correction down to the level of 157.47 is a possibility (test from above). We will then assess the probability of continuing the growth wave to 159.36. Technically, this scenario is supported by the MACD indicator, with its signal line above the zero level and pointing upwards.
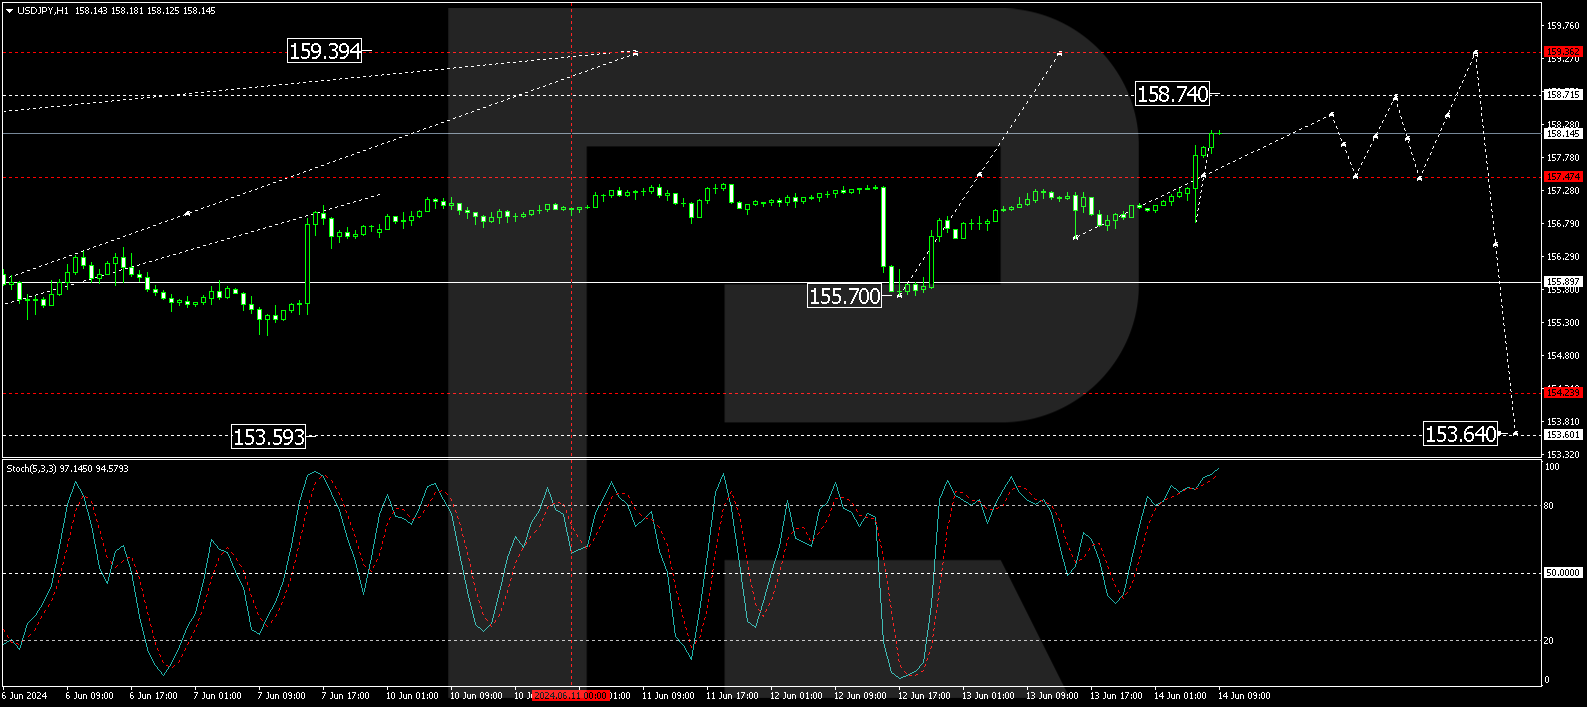
On the H1 USD/JPY chart, the market continues to develop a wave of growth to the level of 158.40. Further, a correction wave to 157.47 is possible, followed by growth to 158.74, the local target. Technically, this scenario is confirmed by the Stochastic oscillator, with its signal line above level 80 and preparing to decline to level 20.
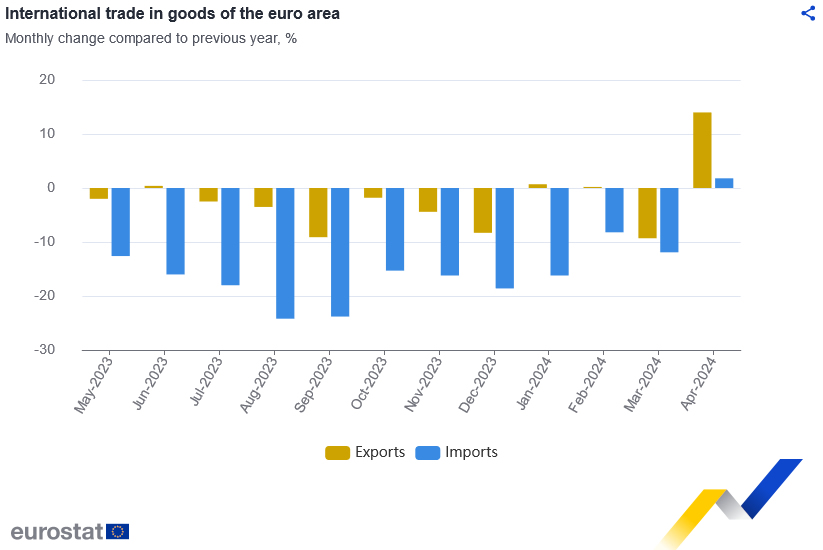
Eurozone exports rises 14.0% yoy, imports up 1.8% yoy in Apr
Eurozone goods exports rose 14.0% yoy to EUR 247.6B in April. Goods imports rose 1.8% yoy to EUR 232.5B. Trade balance showed EUR 15.0B surplus. Intra-Eurozone trade rose 5.8% yoy to EUR 222.89B.
In seasonally adjusted term, goods exports rose 3.1% mom to EUR 245.3B. imports rose 2.3% mom to EUR 225.9B. Trade balance reported EUR 19.4B surplus, above expectation of EUR 17.0B. Intra-Eurozone trade rose 1.5% mom to EUR 217.7B.
GBPJPY Bounces to 14-Year High; Eyes on 201 Resistance
- GBPJPY unlocks a new high after the Bank of Japan defies expectations of reduced bond purchases
- Technical signs are positive, but the bulls need to breach the 201 obstacle
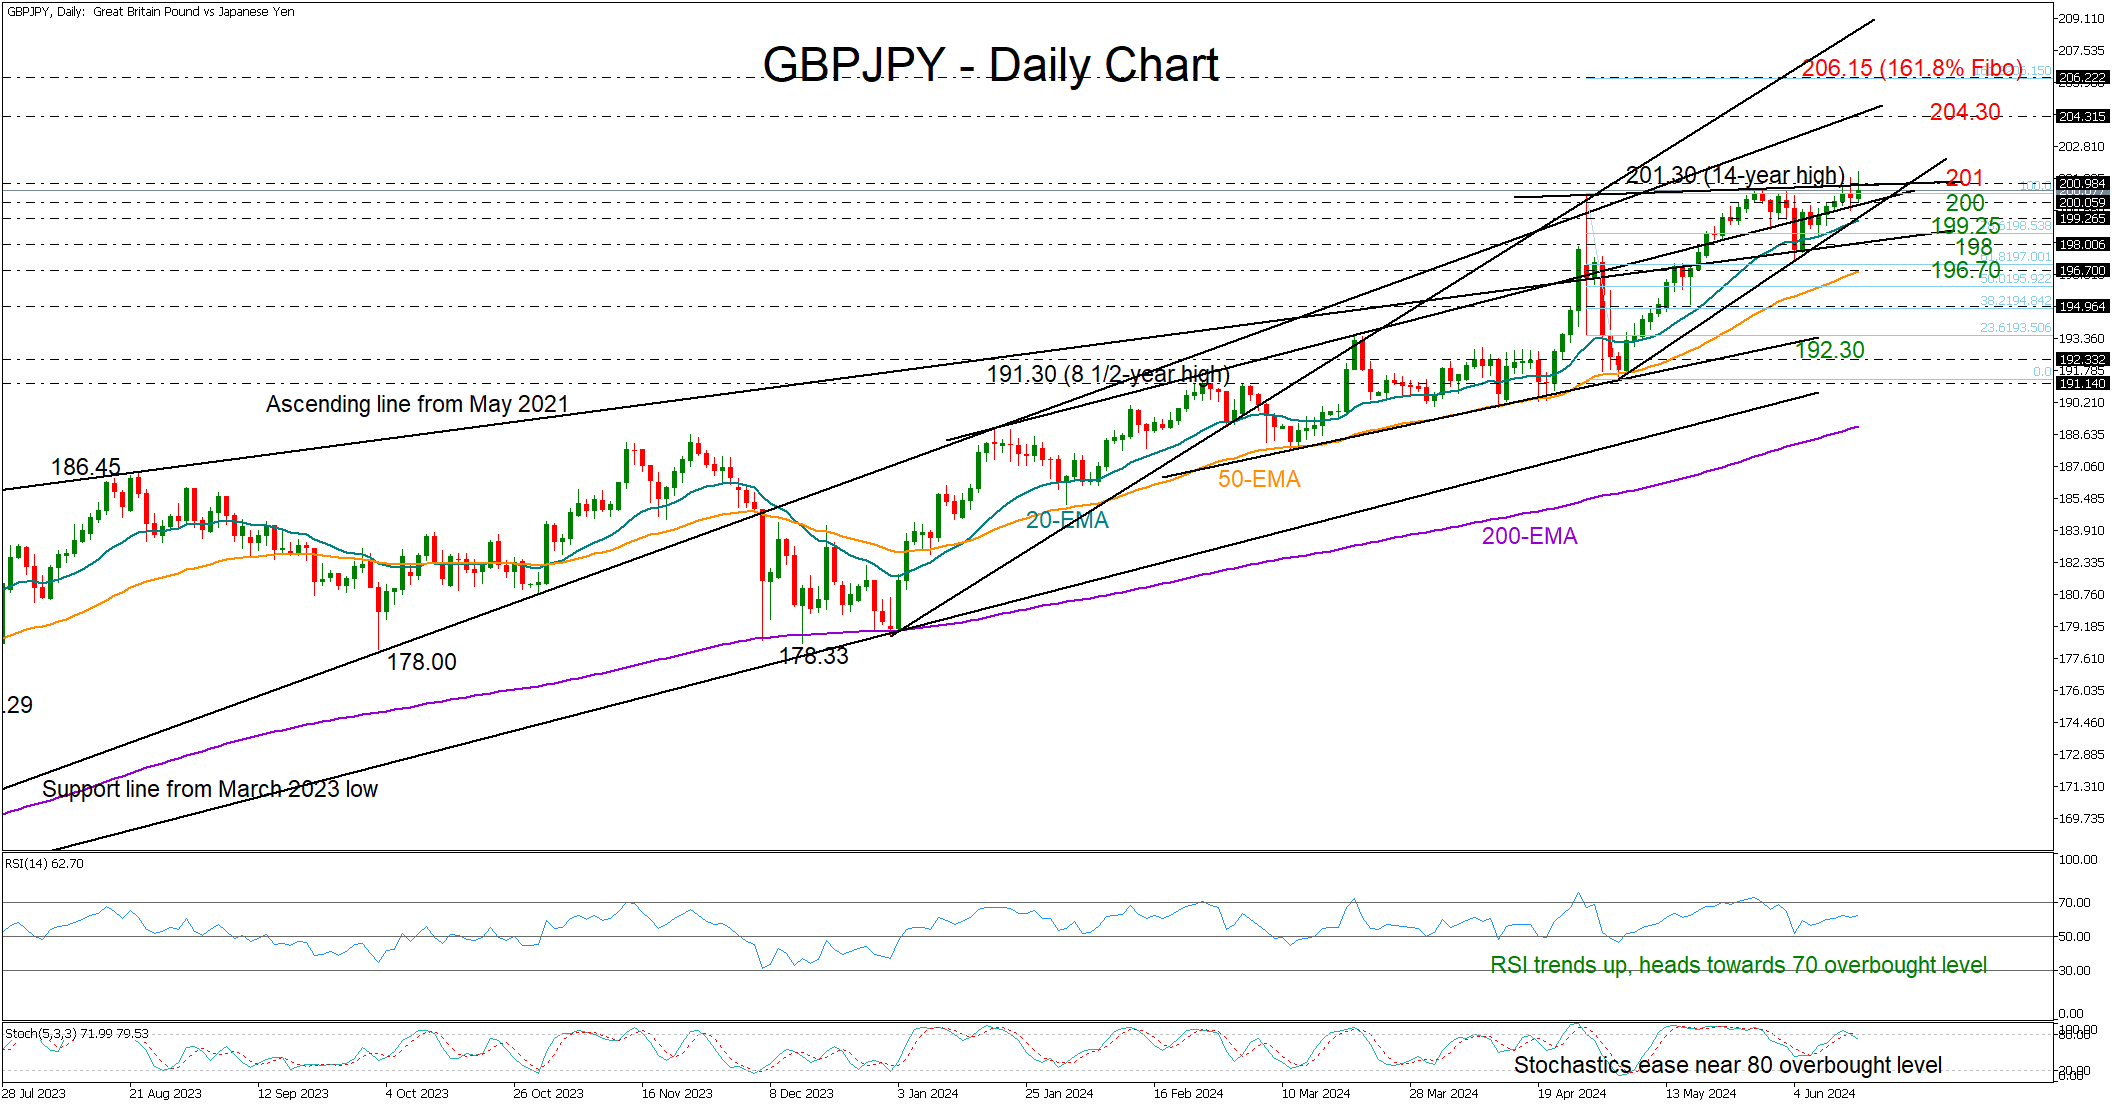
GBPJPY stepped on the long-term ascending line at 200 and jumped to a new 14-year high of 201.59 in the BoJ aftermath on Friday with scope to continue its long-term positive trend.
The short-term risk is more on the upside than on the downside. Specifically, the exponential moving averages (EMAs) are sloping upwards, promoting the bullish trajectory in the market. In technical indicators, the RSI keeps strengthening above its 50 neutral mark and towards its 70 level, although the stochastic oscillator is already hovering near its 80 overbought level.
Buyers would like to see a clear close above the 201 number in order to stage an exciting rally towards the constraining line from March 2023 at 204.30. Even higher, the pair could target the 161.8% Fibonacci extension of May’s downfall at 206.15.
Alternatively, a pullback could retest the 200 level and perhaps seek support near the 20-day EMA at 190.25 before heading for the key 198.00 area. If a slide occurs below the latter, it could indicate a bearish reversal and potentially lead to a sharp correction towards the 50-day EMA at 196.70.
In summary, GBPJPY remains bullish in the short-term, and traders are looking for a close above 201 to drive additional buying.
USDCAD Remains Bullish With Weak Momentum
- USDCAD fails to extend above 1.3785
- Stochastics suggest bearish retracement
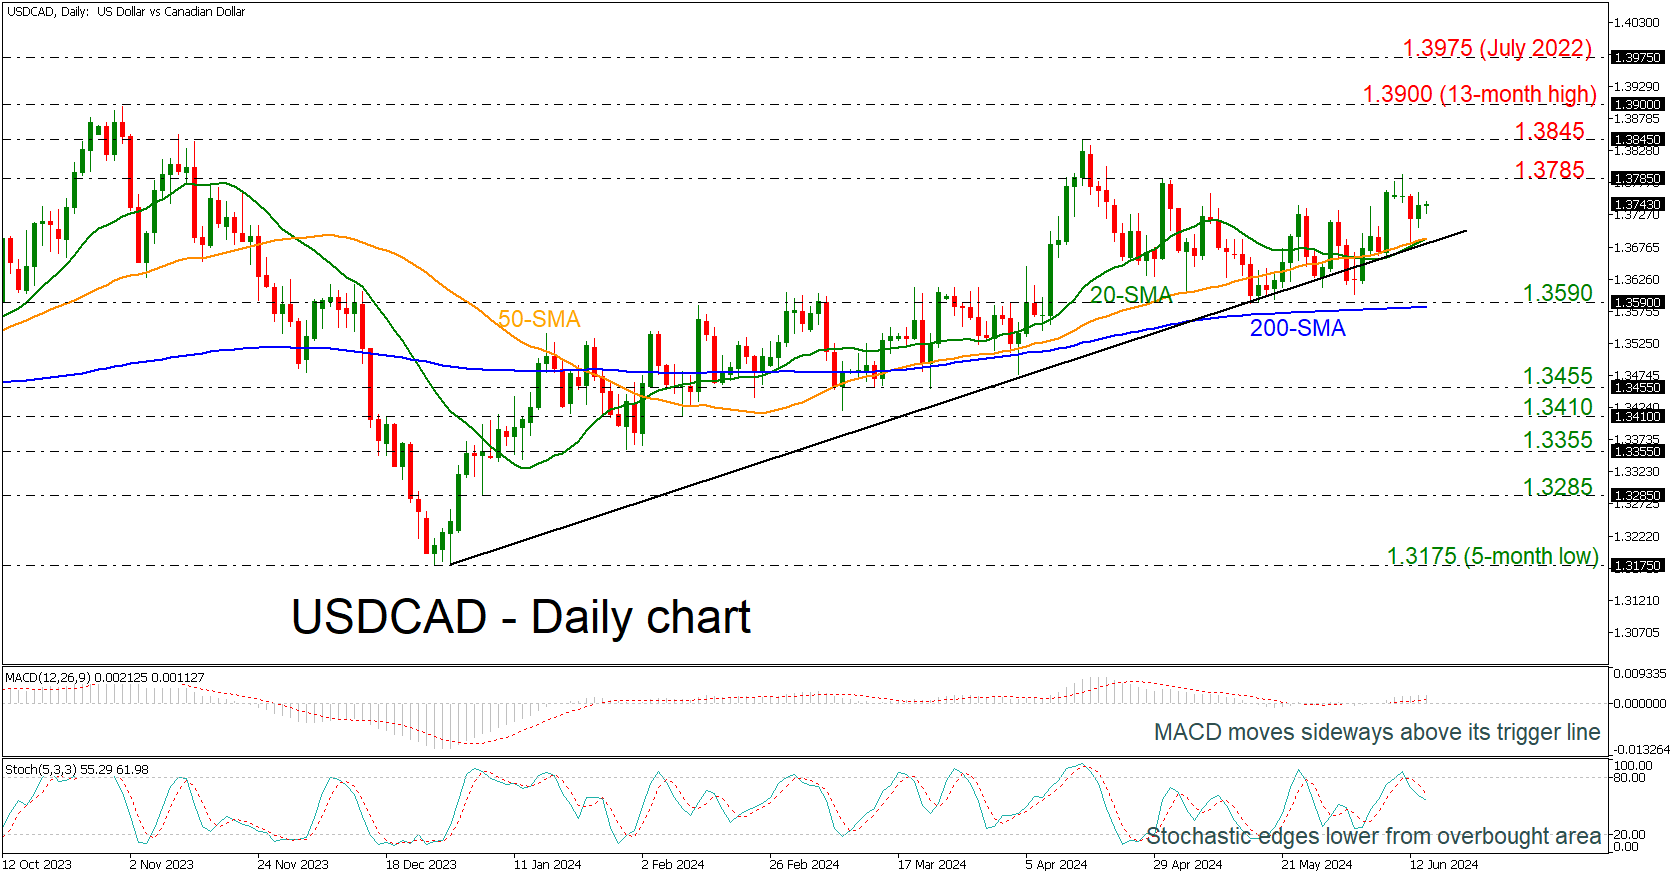
USDCAD is still developing above the short-term simple moving averages (SMAs), which are ready for a bullish crossover, and above the medium-term uptrend line.
Technically, the MACD oscillator is moving sideways above the zero level; however, the stochastic oscillator is indicating a negative movement as it posted a bearish cross with %K and %D lines in the overbought region.
If there are some negative retracements, immediate support could come from the uptrend line at 1.3685 ahead of the strong 200-day SMA near the 1.3590 barrier. A dive beneath this obstacle could switch the bias to a more bearish one, hitting 1.3455.
On the other hand, a climb beyond the 1.3785 resistance could meet immediate resistance at 1.3845 before challenging the 13-month peak of 1.3900. Even higher, the July 2022 top at 1.3975 could endorse the longer-term bullish structure.
All in all, USDCAD is showing some signs of weakening momentum, but the broader outlook remains positive.
EUR/GBP Daily Outlook
Daily Pivots: (S1) 0.8399; (P) 0.8428; (R1) 0.8444; More...
EUR/GBP's fall resumed after brief recovery and intraday bias is back on the downside. Current down trend should target 0.8376 projection level next. For now, risk will remain on the downside as long as 0.8457 resistance holds, in case of another recovery.
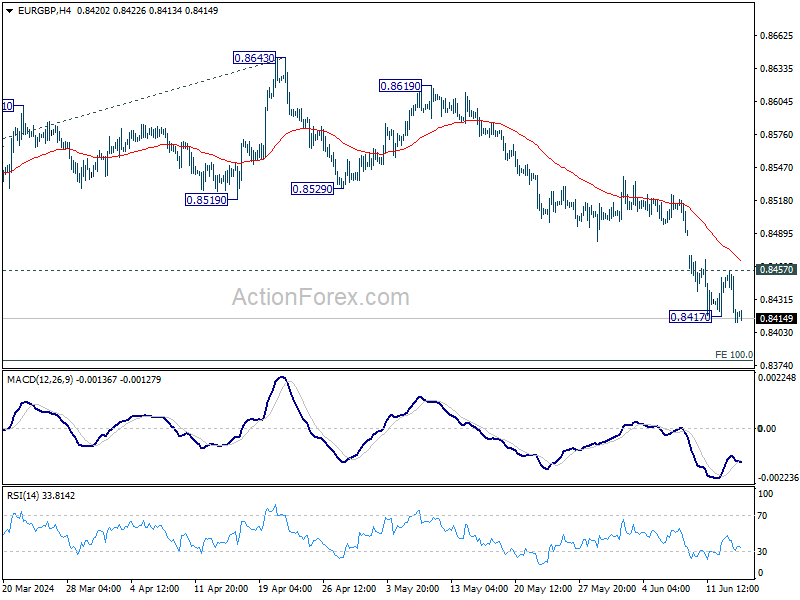
In the bigger picture, down trend from 0.9267 (2022 high) is in progress. Next target is 100% projection of 0.8764 to 0.8497 from 0.8643 at 0.8376. Sustained break there will target 161.8% projection at 0.8211 next. For now, outlook will remain bearish as long as 0.8643 resistance holds, even in case of stronger rebound.