

Sample Category Title
A Growing Divergence
Market sentiment was once again very different on both sides of the Atlantic. The European markets remained under the pressure of tense political environment in France and a 3% slump in April manufacturing production across the Eurozone. The CAC40 dropped 2%, the Stoxx 600 fell 1.30%, the EU bonds were sold off, as well, after MSCI said that it won’t add them to it government indices, the spread between the German and French 10-year papers widened past 70bp – the highest since 2017, and the EURUSD retraced back below its 50, 100 and 200-DMA – after spending just one session above these levels.
And even a softer-than-expected PPI read from the US couldn’t prevent the EURUSD’s decline yesterday. But on the other side of the Atlantic Ocean, the producer prices fell on a monthly basis – the first monthly decline since January and the yearly figure eased to 2.2% while analysts were prepared for a rebound to 2.5%. Cherry on top, the jobless claims jumped to the highest levels in 9 months. Both data played in favour of the Fed doves a day after the Federal Reserve (Fed) hinted that they see little progress regarding inflation instead of ‘none’ at their previous communication and should’ve pulled the US dollar lower – in theory, but the selloff in the euro against the greenback weighed heavier, and the Bank of Japan (BoJ) decided not to reduce its JGB holdings until the July meeting – and that also fueled a yen selloff and sent the USDJPY toward the 158 this morning. In summary, the US dollar bears couldn’t take advantage of softer data yesterday due to contradictory dynamics elsewhere.
But the US yields eased, the US 2-year yield tipped a toe below the 4.70% for the second consecutive session and the 10-year yield fell all the way down to 4.22%. Both yields rebounded since then, but this week’s softer-than-expected inflation updates maintained the expectation of a rate cut alive for the end of the year. The probability of a September rate cut rose to 65%, the probability of a November cut stands at around 80%, while a December cut is now given around 95% chance. Many investors are still skeptical regarding the feasibility of a 2024 cut – and inflation figures haven’t been appetizing so far this year, but the latest figures are encouraging. Yesterday’s PPI for example also hint that declines in some categories in the PPI like airfare and prices for portfolio management services which also feed into the Fed’s favourite gauge of inflation – the PCE index - hint that we could see the PCE index show the slowest advance since November when released later this month.
As such, sentiment in the US equities remains quite cheery. The stock rally slowed yesterday, but the S&P500 eked out a small gain near its ATH level, while Nasdaq advanced to a fresh record. Apple advanced another 0.55%, Super Micro Computer jumped 12% and Tesla advanced nearly 3% after shareholders’ backed Elon Musk’s $56 billion pay deal and his proposal to move the company’s jurisdiction to Texas. Adobe jumped nearly 15% in the afterhours trading after giving a strong outlook for its products as its customers adopt new AI-based tools.
Zooming out, we started seeing a clear divergence between sentiment regarding the European and the US stocks this week and the latter has room to widen. While dark clouds are gathering near the peaks of the Stoxx 600, appetite for the US stocks remains solid – especially for the technology stocks. This positive divergence in favour of the US stocks will likely continue but for this rally to sit on a solid ground, we need gains to widen toward the non-technology names – which is not yet the case; the S&P500’s equal weight index is sitting still and watching the normal-weight index – heavy in tech stocks – travel through uncharted territories. The softening Fed expectations is supportive of such widening of the rally, but investors should show a minimum envy. For now, that’s not necessarily the case. The energy stocks for example continue to be sold off; the SPDR’s energy fund is down by more than 10% since the April peak, financials and utilities are down nearly 5% since May while industrials are down by 3%. Only technology is carrying the rally higher and the rally, there, looks overstretched.
In energy, US crude eased after failure to clear a major Fibonacci resistance at $78.30pb level. That’s the major 38.2% Fibonacci retracement and clearing this resistance should in theory allow the price of a barrel to step into a medium-term bullish consolidation zone. And that’s certainly why we see a solid resistance. The softer Fed expectations as a result of soft inflation reads remains supportive of a further rise, but the rise should be soft and sweet to not awaken the inflation worries, otherwise it would jeopardize the soft Fed expectations.
USD/JPY Mid-Day Outlook
Daily Pivots: (S1) 155.84; (P) 156.61; (R1) 157.49; More...
No change in USD/JPY's outlook as range trading continues. Intraday bias remains neutral. On the downside, break of 154.53 will turn bias to the downside for 151.86 support and possibly below, as the third leg of the corrective pattern from 160.20. On the upside, break of 157.70 will resume the whole rise from 151.86 and target 160.20 high.
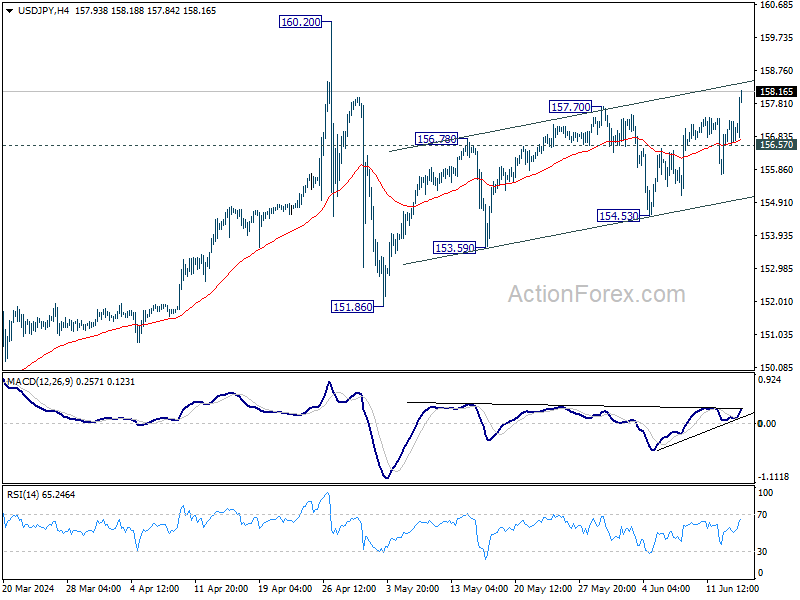
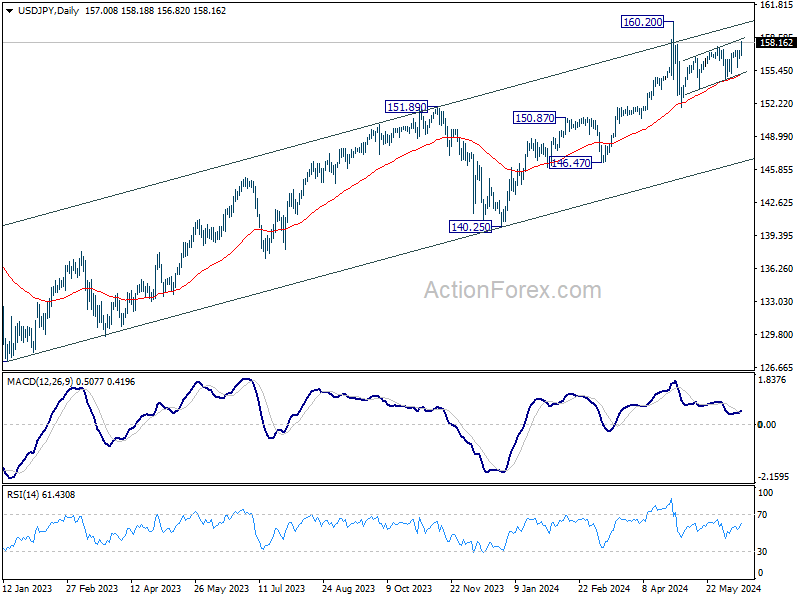
In the bigger picture, a medium term top should be formed at 160.20. As long as 55 W EMA (now at 147.77) holds, fall from 160.20 is seen as correcting the rise from 140.25 only. However, sustained break of 55 W EMA will argue that larger correction is possibly underway, and target 146.47 support next.
BoJ Decision Sends Yen Plummeting as Taper Plan Delayed
The Japanese Yen has taken a significant hit today, losing ground against all major currencies after BoJ refrained from detailing an immediate plan to taper its bond purchases. In the lead-up to the announcement, expectations were high among traders and investors that BoJ would begin tapering soon, fueled by multiple media reports. However, the central bank only indicated an intention to taper, deferring detailed discussions until its July meeting.
BoJ's cautious stance underscores its strategy to wait for the new economic outlook and projections due in July before making any firm decisions. And that's understandable. However, this delay has left the market in a state of uncertainty and unease, prompting speculation on whether there will eventually be a definitive cut in purchase amounts...
Simultaneously, Dollar is continuing to rebound and reverse the losses incurred after the recent CPI data release. Canadian Dollar is emerging as the day's second strongest performer at this point, followed by Euro and Swiss Franc. In contrast, New Zealand and Australian Dollars are underperforming, marginally better than Yen, with British Pound also showing some weakness.
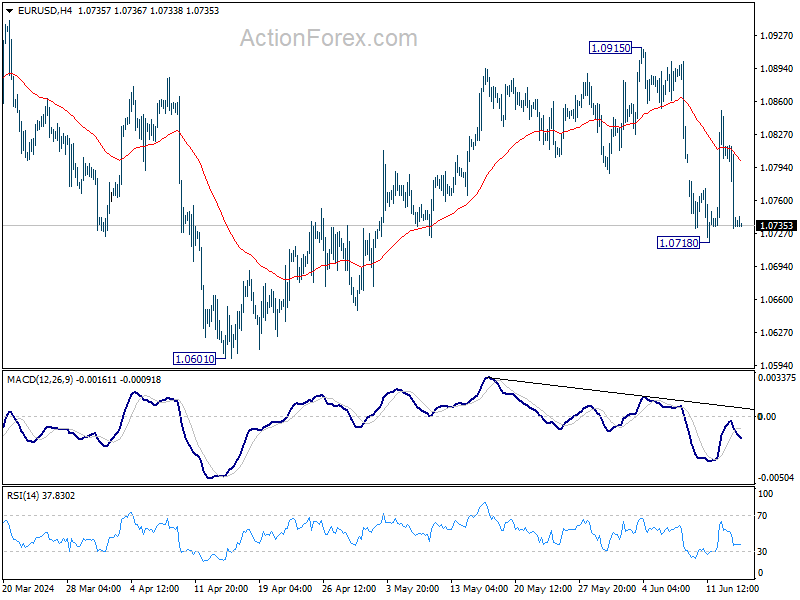
Technically, Euro is a focus today as the near term decline in both EUR/GBP and EUR/CHF resumed after brief recovery. Now, break of 1.0718 support in EUR/USD will also indicate resumption of fall from 1.0915. That would strengthen the case that whole rise from 1.0601 has completed at 1.0915, and bring retest of this low.
In Asia, at the time of writing, Nikkei is up 0.39%. Hong Kong HSI is down -0.47%. China Shanghai SSE is up 0.06%. Singapore Strait Times is down -0.49%. Japan 10-year JGB yield is down -0.034 at 0.937. Overnight, DOW fell -0.17%. S&P 500 rose 0.23%. NASDAQ rose 0.34%. 10-year yield fell -0.057 to 4.238.
BoJ holds interest rates, prepares for bond purchase reduction plan in next month
BoJ left uncollateralized overnight call rate unchanged at 0-0.10% as widely expected. In addition, BoJ will continue its asset purchase program until the end of June. The central bank, by an 8-1 majority vote, has also decided to reduce its JBG purchase amounts afterward.
The detailed plan for the reduction in JGB purchases, which will cover the next one to two years, is set to be determined by at next meeting. Apparently, BoJ would likely to have access to the new economic and price output report before laying out the plan.
BoJ is optimistic about Japan's economic prospects, projecting that the economy will grow at a rate above its potential growth rate. Core CPI is expected to increase through fiscal 2025 due to factors such as the waning effects of government economic measures. Furthermore, underlying inflation is predicted to gradually rise as the output gap improves and medium-to long-term inflation expectations climb.
NZ BNZ manufacturing falls to 47.2 in 15th month of contraction
New Zealand's BusinessNZ Performance of Manufacturing Index dropped from 48.8 to 47.2 in May, marking the sector's 15th consecutive month of contraction.
Looking as some details, production plummeted from 50.3 to 44.5, indicating a sharp return to contraction. Employment showed a slight decline from 50.9 to 50.6. New orders fell further from 45.4 to 44.4, maintaining their contraction for the 21st straight month. Finished stocks rose from 50.7 to 52.4, but deliveries fell from 48.1 to 45.2.
Despite the decline in the overall index, the proportion of negative comments decreased to 63.5% from 69% in April and 65% in March. Most negative feedback highlighted the general economic slowdown and the current recessionary pressures.
Looking ahead
Eurozone trade balance will be released in Euroepan session. Later in the data, Canada manufacturing sales and wholesale sales, and US import prices and U of Michigan consumer sentiment will be published.
USD/JPY Daily Outlook
Daily Pivots: (S1) 156.62; (P) 156.97; (R1) 157.35; More...
USD/JPY's choppy rise from 151.86 resumed by breaking through 157.70 resistance and intraday bias back on the upside. Further rise should be seen to retest 160.20 high but strong resistance could be seen there to limit upside. On the downside, below 156.57 minor support will turn intraday bias neutral first.
In the bigger picture, a medium term top should be formed at 160.20. As long as 55 W EMA (now at 147.77) holds, fall from 160.20 is seen as correcting the rise from 140.25 only. However, sustained break of 55 W EMA will argue that larger correction is possibly underway, and target 146.47 support next.
Economic Indicators Update
| GMT | Ccy | Events | Actual | Forecast | Previous | Revised |
|---|---|---|---|---|---|---|
| 22:30 | NZD | Business NZ PMI May | 47.2 | 48.9 | 48.8 | |
| 03:23 | JPY | BoJ Interest Rate Decision | 0.10% | 0.10% | 0.10% | |
| 04:30 | JPY | Tertiary Industry Index M/M Apr | 1.90% | 0.40% | -2.40% | -2.30% |
| 04:30 | JPY | Industrial Production M/M Apr F | -0.90% | -0.10% | -0.10% | |
| 09:00 | EUR | Eurozone Trade Balance (EUR) Apr | 17.0B | 17.3B | ||
| 12:30 | CAD | Manufacturing Sales M/M Apr | 1.30% | -2.10% | ||
| 12:30 | CAD | Wholesale Sales M/M Apr | 2.50% | -1.10% | ||
| 12:30 | USD | Import Price Index M/M May | 0.10% | 0.90% | ||
| 14:00 | USD | Michigan Consumer Sentiment Index Jun P | 73 | 69.1 |
Cliff Notes: Cautious Steps Towards Easing
Key insights from the week that was.
In Australia, headline results from the May Labour Force Survey were in line with Westpac’s forecasts. Growth in employment was solid in the month, up +39.7k (+0.3%), in part due to an unwind of a seasonal dynamic from last month – more people than usual entering employment in May after lining up a job in April. Consequently, the unemployment rate edged lower, from 4.1% to 4.0%. At 2.6%yr, employment growth continues to ease gradually from October 2022’s high of 6.4%yr towards the 2.0%–2.5%yr pre-pandemic range (note these figures use three-month averages). Employment growth continues to keep pace with population growth, leaving the employment-to-population ratio little-changed over the month, near its historic high.
Growth in total hours worked has been much softer than employment, down –0.5% in May to be up just 0.6% from a year ago. The juxtaposition between these two indicators suggests employers are still eager to maintain or expand their capacity, and are using hours to balance current output with demand. This dynamic will be important moving into the second half of the year when we anticipate demand conditions will begin to improve in response to tax cuts and as cost-of-living pressures continue to ease.
Before moving offshore, a final note on the business sector. The latest NAB business survey confirmed that the easing in business conditions over the past two years persisted into May, the index posting another modest decline to be slightly below long-run average levels (–1pt to +6). Having experienced eight consecutive months of forward order declines, businesses are understandably circumspect over the outlook, with confidence moving sharply lower in the month (down 5pts to –3). The uptick in the survey’s cost and price gauges (1.9% and 1.1% respectively) bears close monitoring over the next few months given the RBA aim to maintain an appropriate pace of disinflation and eventually bring inflation sustainably back within the target band.
Over in the US, at the June FOMC meeting, the fed funds rate was held steady and there were minimal changes to projections. The Committee now expects to deliver just one rate cut in 2024 versus three back in March. Four cuts are now expected in 2025 (from three); while the end-2026 forecast is unchanged at 3.125%. The FOMC does not anticipate inflation will improve further in 2024 and also expects it to remain above target through 2025. On the labour market, the unemployment rate is expected to peak at 4.2% by end-2025 from 4.0% today after which it edges down to 4.1% at end-2026 – a figure consistent with full employment based on the Committee’s 4.2% ‘longer run’ view. This assessment of the labour market underpins an above trend GDP growth outlook, at 2.1%yr in 2024 then 2.0%yr in 2025 and 2026.
In the press conference, Chair Powell set a cautious tone regarding the durability of the FOMC’s forecasts. The projections were referenced as 'conservative' and Chair Powell noted that further inflation outcomes like May would lead to a more benign profile. Indeed, it seems most Committee members did not incorporate the below-expectations flat May CPI print into their forecasts, Chair Powell noting in the press conference that, when significant data is released during the meeting, participants are reminded they have the opportunity to revise their forecasts, but “most people generally don’t”. Westpac places greater weight on the recent evidence of decelerating momentum in prices and activity, leading us to expect two rate cuts in 2024 followed by four in 2025, the latter view in line with the FOMC’s expectation. Conversely, we see greater upside risk for inflation in 2026 and beyond, leading to a higher terminal rate of 3.375% in mid-2026 compared to the FOMC's 3.1% end-2026 and their ‘longer run’ estimate of 2.8%.
In the UK, the unemployment rate rose to 4.4% in April as employment fell 139k following a string of declines since the start of 2024. Weekly earnings growth excluding bonuses held around 6% for a fourth consecutive month. However, declining employment looks to be dampening wage expectations, the Bank of England’s Decision Maker Panel survey reporting wage growth expectations for the year ahead has come down from 5.2% a year ago to 4.1% in the latest reading. GDP meanwhile was flat in April as gains in the services sector were offset by declines in industrial production and construction. The BoE’s meeting next week will provide guidance on their assessment of incoming data and the likely timeline to a first cut.
In China, the CPI rose by 0.3%yr in May matching April's outcome. Services inflation remains the primary driver of consumer prices, though consumer demand is unlikely to support a material acceleration in inflation in services or goods for the foreseeable future. Producer prices fell -1.4%yr in May despite an increase in raw material prices (0.9%mth, 0.5%mth), potentially due, in part, to recent strength in shipping costs.
BoJ holds interest rates, prepares for bond purchase reduction plan in next month
BoJ left uncollateralized overnight call rate unchanged at 0-0.10% as widely expected. In addition, BoJ will continue its asset purchase program until the end of June. The central bank, by an 8-1 majority vote, has also decided to reduce its JBG purchase amounts afterward.
The detailed plan for the reduction in JGB purchases, which will cover the next one to two years, is set to be determined by at next meeting. Apparently, BoJ would likely to have access to the new economic and price output report before laying out the plan.
BoJ is optimistic about Japan's economic prospects, projecting that the economy will grow at a rate above its potential growth rate. Core CPI is expected to increase through fiscal 2025 due to factors such as the waning effects of government economic measures. Furthermore, underlying inflation is predicted to gradually rise as the output gap improves and medium-to long-term inflation expectations climb.
USD/JPY’s Upward Trajectory: Can the Pair Hit New Peaks?
Key Highlights
- USD/JPY is holding gains above the 156.20 support zone.
- A major bullish trend line is forming with support at 156.50 on the 4-hour chart.
- Gold prices are again slipping lower toward the $2,280 level.
- EUR/USD failed to recover above the 1.0850 resistance zone.
USD/JPY Technical Analysis
The US Dollar remained well-supported above the 155.50 level against the Japanese Yen. After the Fed decision, USD/JPY started another increase above 156.20.
Looking at the 4-hour chart, the pair cleared the 156.50 resistance and settled above the 100 simple moving average (red, 4-hour) and the 200 simple moving average (green, 4-hour). The pair surpassed the 76.4% Fib retracement level of the downward move from the 157.40 swing high to the 155.72 low.
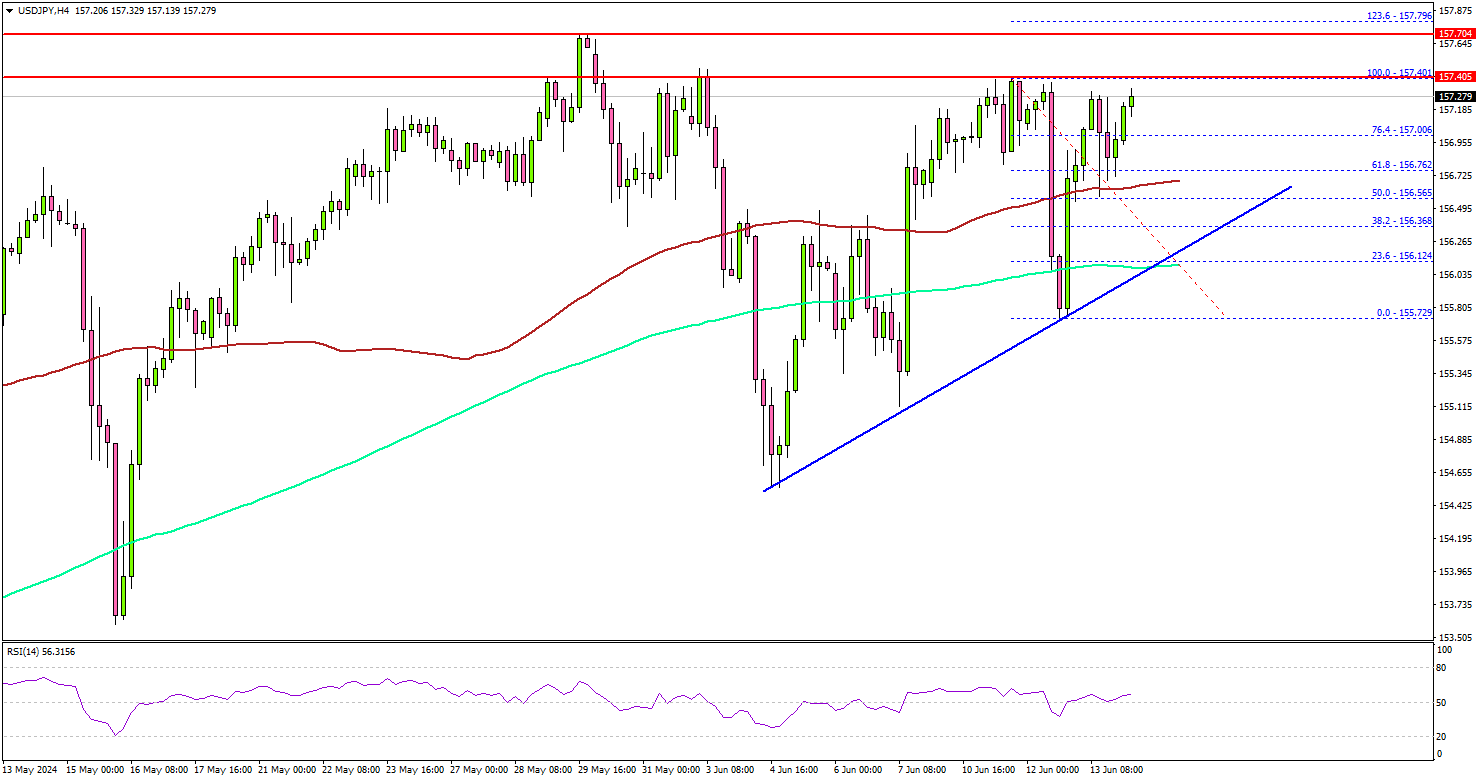
Therefore, there is a high chance of a move above the 157.40 resistance. The first major resistance is near the 158.00 level.
A clear move above the 158.00 resistance might send it toward the 159.20 level. Any more gains might call for a move toward the 160.00 level in the near term.
If not, the pair might correct gains. Immediate support is near the 156.75 level. The next major support is near the 156.50 zone. There is also a major bullish trend line forming with support at 156.50 on the same chart.
A downside break and close below the 156.50 support zone could open the doors for a larger decline. In the stated case, the pair could decline toward the 155.20 level.
Looking at gold, the bears are in again and they might aim for a move toward the $2,280 support in the near term.
Economic Releases
- Michigan Consumer Sentiment Index for June 2024 (Prelim) – Forecast 72, versus 69.1 previous.
- Fed's Goolsbee speech.
NZ BNZ manufacturing falls to 47.2 in 15th month of contraction
New Zealand's BusinessNZ Performance of Manufacturing Index dropped from 48.8 to 47.2 in May, marking the sector's 15th consecutive month of contraction.
Looking as some details, production plummeted from 50.3 to 44.5, indicating a sharp return to contraction. Employment showed a slight decline from 50.9 to 50.6. New orders fell further from 45.4 to 44.4, maintaining their contraction for the 21st straight month. Finished stocks rose from 50.7 to 52.4, but deliveries fell from 48.1 to 45.2.
Despite the decline in the overall index, the proportion of negative comments decreased to 63.5% from 69% in April and 65% in March. Most negative feedback highlighted the general economic slowdown and the current recessionary pressures.

NZD: A Few Swing Trade Ideas to Consider
The NZDUSD pair climbed to a peak of 0.6217 before settling at 0.6170. The pair has faced resistance around the 0.6220 level, with attempts to break through being unsuccessful. On the daily chart, the Relative Strength Index (RSI) is at 56 and trending downwards, indicating a slight drop in buying pressure. This is supported by the flat red bars on the Moving Average Convergence Divergence (MACD), which suggest a continuing consolidation pattern. Overall, the NZDUSD pair is experiencing resistance and consolidation after a brief rise.
NZDUSD – H3 Timeframe
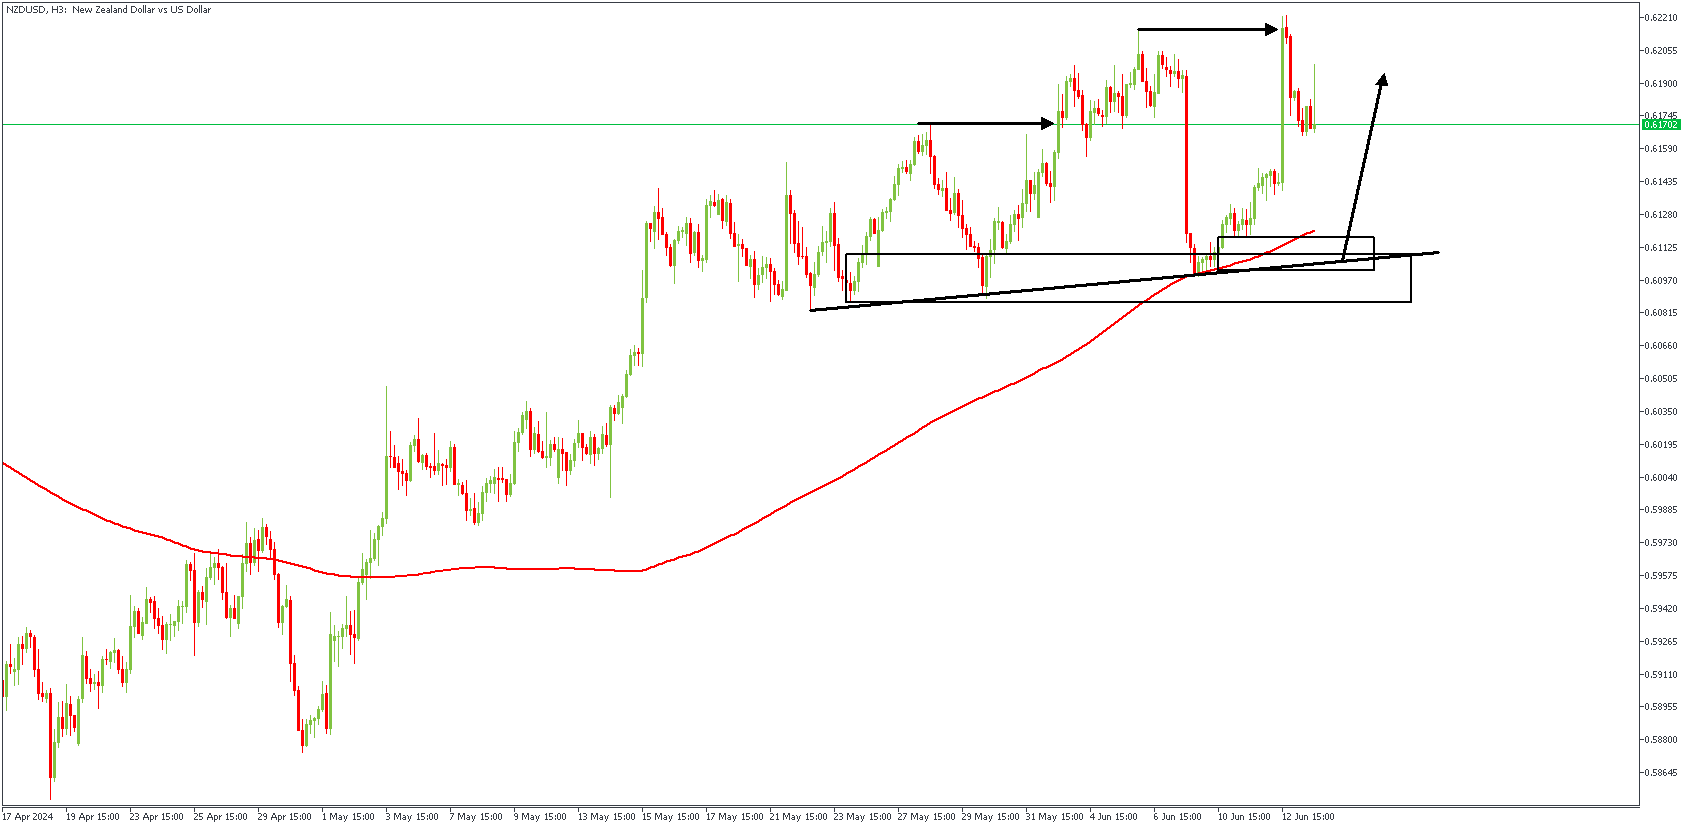
NZDUSD on the 3-hour timeframe chart broke two previous highs; creating a formidable demand zone that has already been tested once before. The addition of the 200-period moving average support into the mix adds the much-needed flavour in support of a bullish sentiment. Finally, the trendline support and the fact that all of these converge around the 88% of the Fibonacci retracement seems reason enough for a bullish reaction from the highlighted zone.
Analyst’s Expectations:
- Direction: Bullish
- Target: 0.61993
- Invalidation: 0.60937
NZDCHF – H4 Timeframe
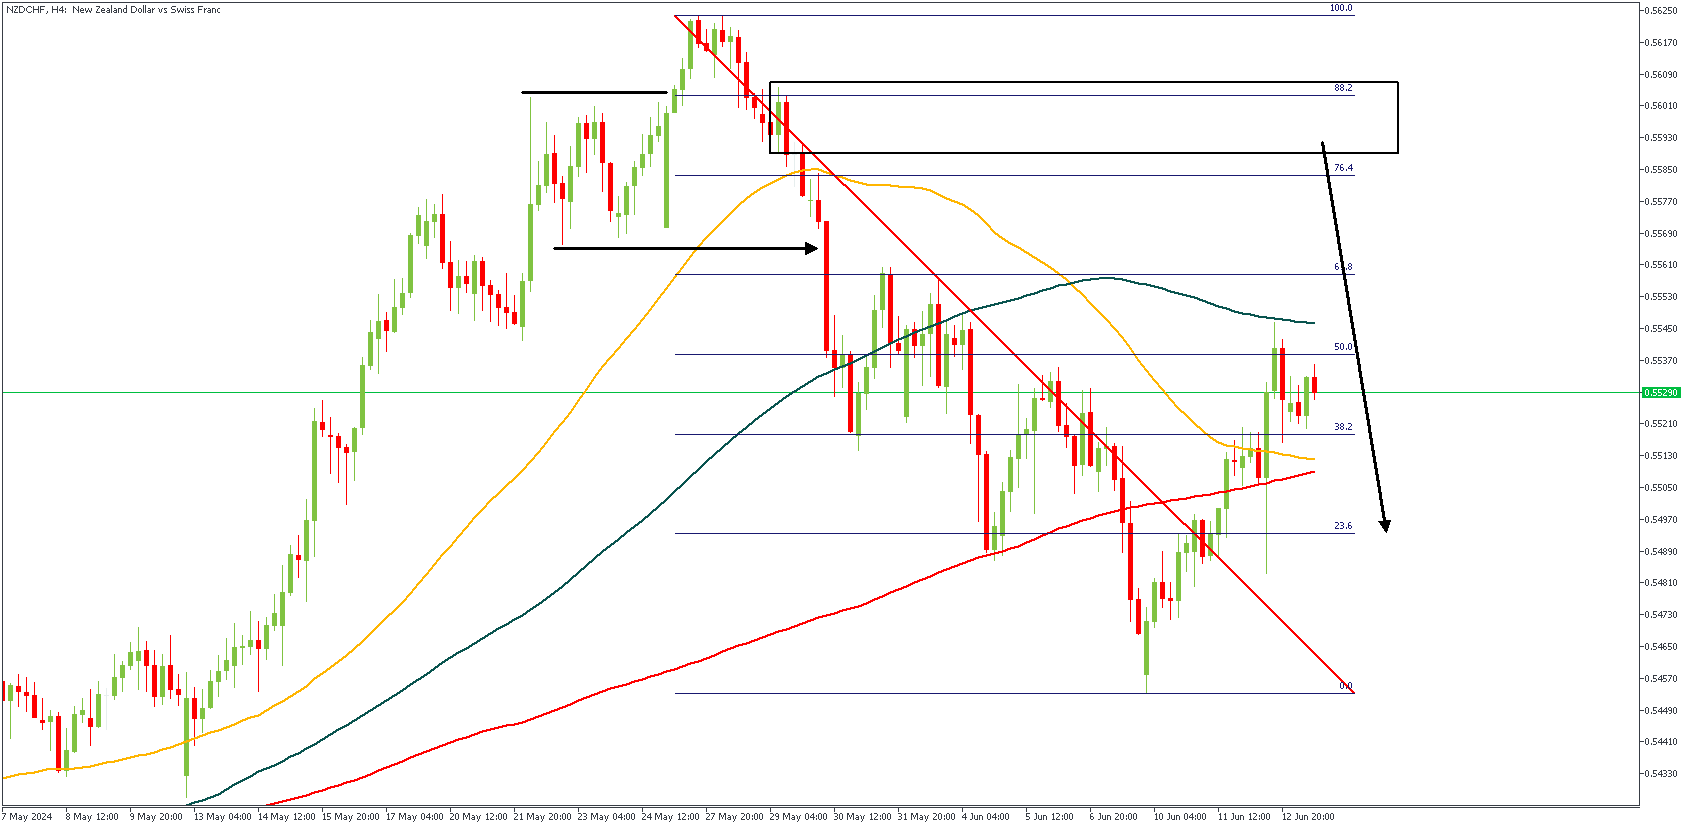
In my usual flow, I spotted this sweet trade idea on the 4-hour timeframe chart of NZDCHF. Breaking down the highlights on the chart, you would notice the previous high being swept clean of liquidity, after which the proper break of structure occurred. It is my expectation that the retracement of price into the supply zone area that aligns with the 88% of the Fibonacci retracement tool would yield the next bearish impulse.
Analyst’s Expectations:
- Direction: Bearish
- Target: 0.54846
- Invalidation: 0.56183
NZDJPY – H2 Timeframe
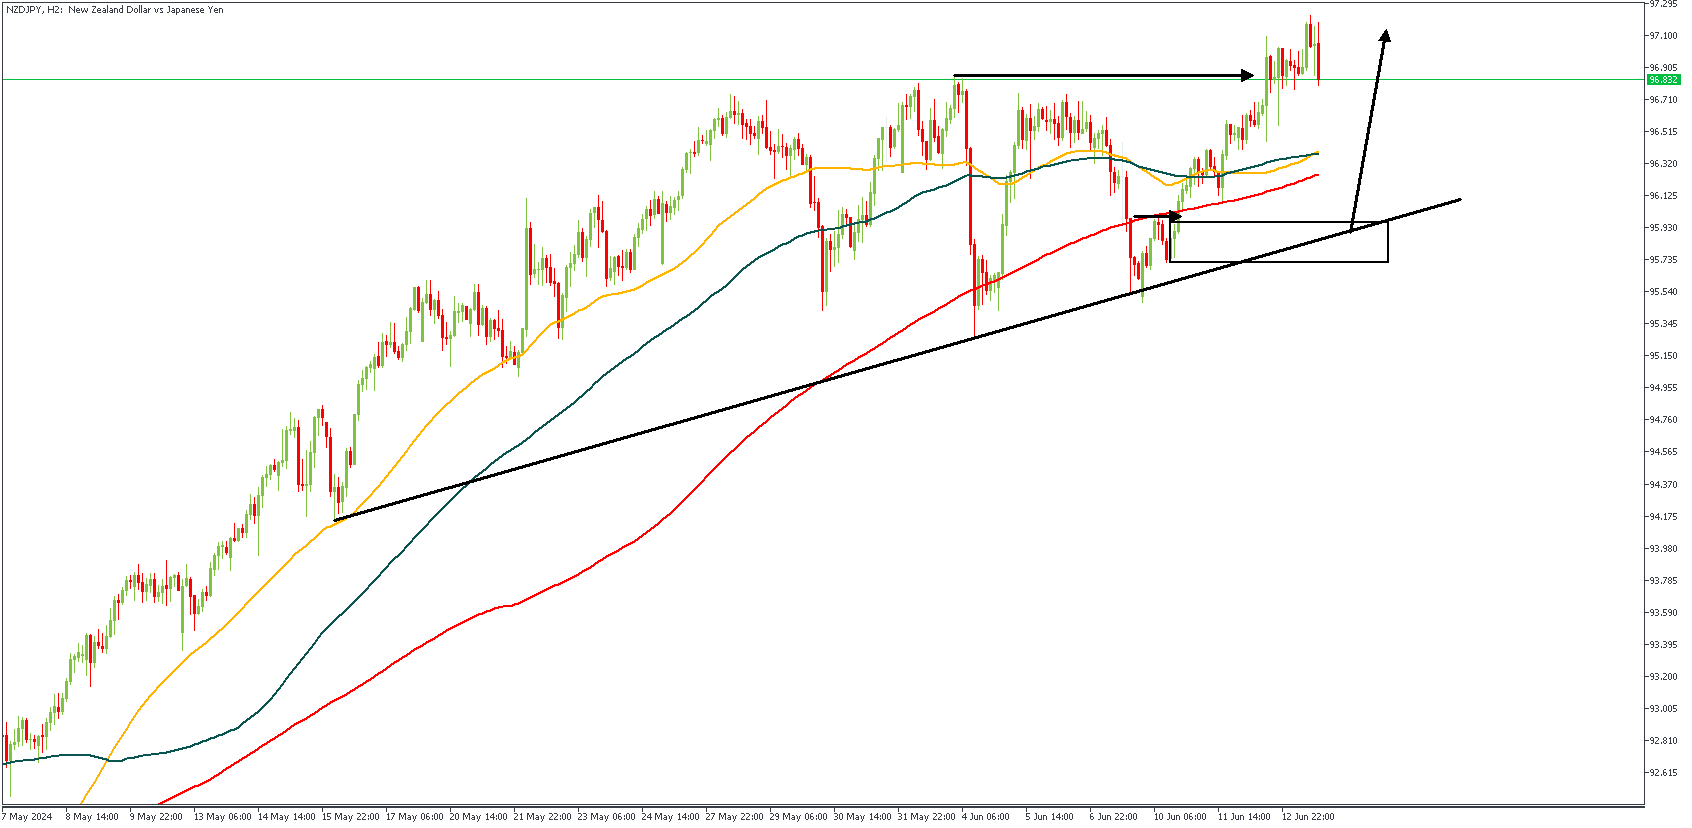
After making a clean breakout on the 2-hour timeframe chart, we see the price action on NZDJPY slowly grinding downwards in possible search of an area of demand from which new buyers could be lured in. The highlighted demand zone fits perfectly within the 88% Fibonacci retracement level, as well as the trendline support, thereby increasing my confluences in favor of a bullish sentiment.
Analyst’s Expectations:
- Direction: Bullish
- Target: 96.879
- Invalidation: 95.483
CONCLUSION
The trading of CFDs comes at a risk. Thus, to succeed, you have to manage risks properly. To avoid costly mistakes while you look to trade these opportunities, be sure to do your due diligence and manage your risk appropriately.
NZDUSD Wave Analysis
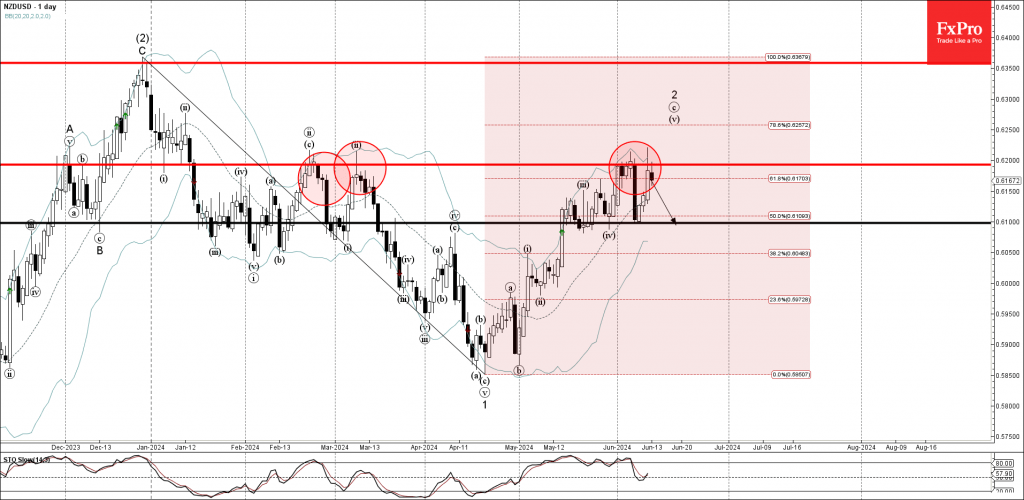
- NZDUSD reversed from key resistance level 0.6200
- Likely to fall to support level 0.6100
NZDUSD currency pair recently reversed down from the key resistance level 0.6200 (which has been reversing the price from February).
The resistance level 0.6200 was strengthened by the upper daily Bollinger Band and by the 61.8% Fibonacci correction of the previous downward impulse 1 from December.
Given the strength of the resistance level 0.6200, NZDUSD currency pair can be expected to fall further to the next support level 0.6100, low of the previous minor correction iv.
Elliott Wave Intraday Analysis on DAX Looking for Support Soon
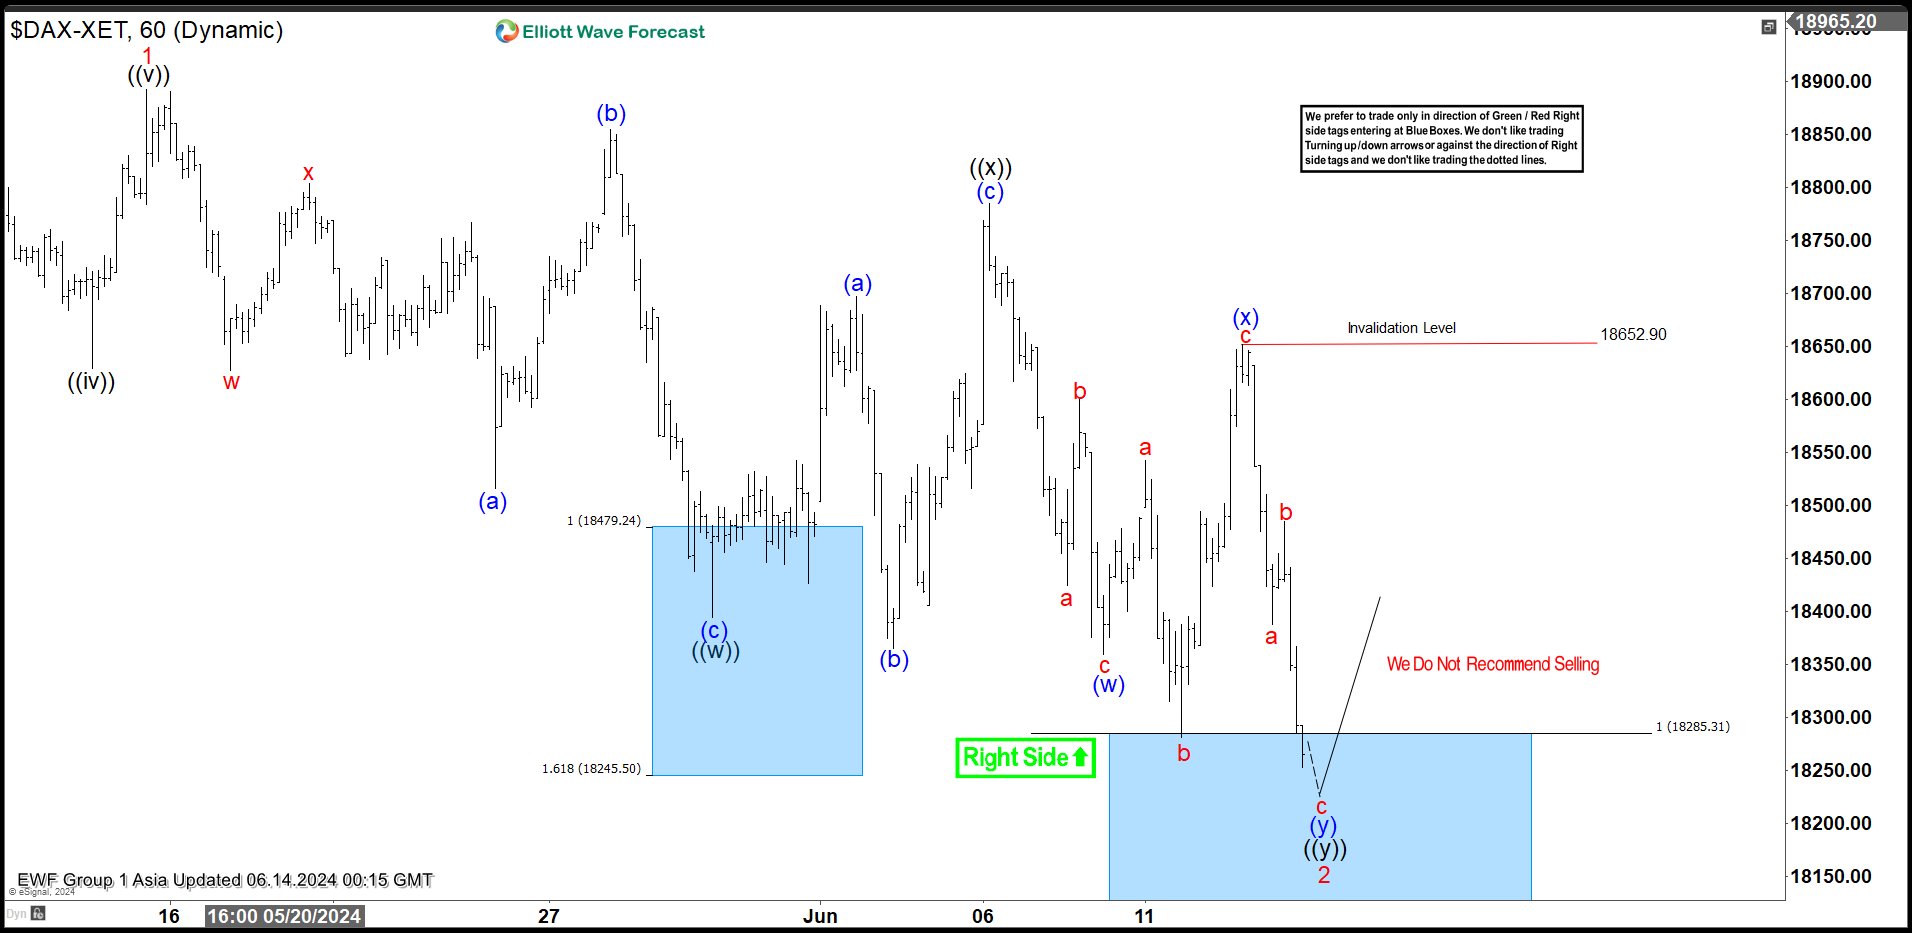
Short Term Elliott Wave in DAX suggests the Index is correcting cycle from 4.19.2024 low. The rally from 4.19.2024 low ended wave 1 at 18892.92. Wave 2 pullback is currently in progress as a double three Elliott Wave structure. Down from wave 1, wave (a) ended at 18515.84 and wave (b) ended at 18855.05. Wave (c) lower ended at 18394.43 which completed wave ((w)) in higher degree. Wave ((x)) unfolded as an expanded flat Elliott Wave structure. Up from wave ((w)), wave (a) ended at 18697.09 and wave (b) ended at 18365.53. Wave (c) higher ended at 18784.65 which completed wave ((x)) in higher degree.
The Index has resumed lower in wave ((y)). Down from wave ((x)), wave (w) ended at 18359.42 and wave (x) rally ended at 18652.90. Wave (y) lower is now in progress to complete wave ((y)) of 2 in higher degree. The Index has reached the extreme area from wave 1 peak. This area of support is at 100% – 161.8% Fibonacci extension of wave ((w)), which comes at 17981 – 18287.2. From this area, the Index should turn and resume higher or at minimum rally in 3 waves.
DAX 60 Minutes Elliott Wave Chart
DAX Elliott Wave Video
https://www.youtube.com/watch?v=IF9XAi9KmWk