Sample Category Title
AUDUSD: Buying The Dips at the Blue Box Area
In this technical article we’re going to take a quick look at the Elliott Wave charts of AUDUSD Forex pair , published in members area of the website. As our members know, AUDUSD has recently given us correction against the 0.63618 low. The pair reached our target zone and completed correction right at the Equal Legs zone ( Blue Box Area) . In further text we’re going to explain the Elliott Wave pattern and trading setup.
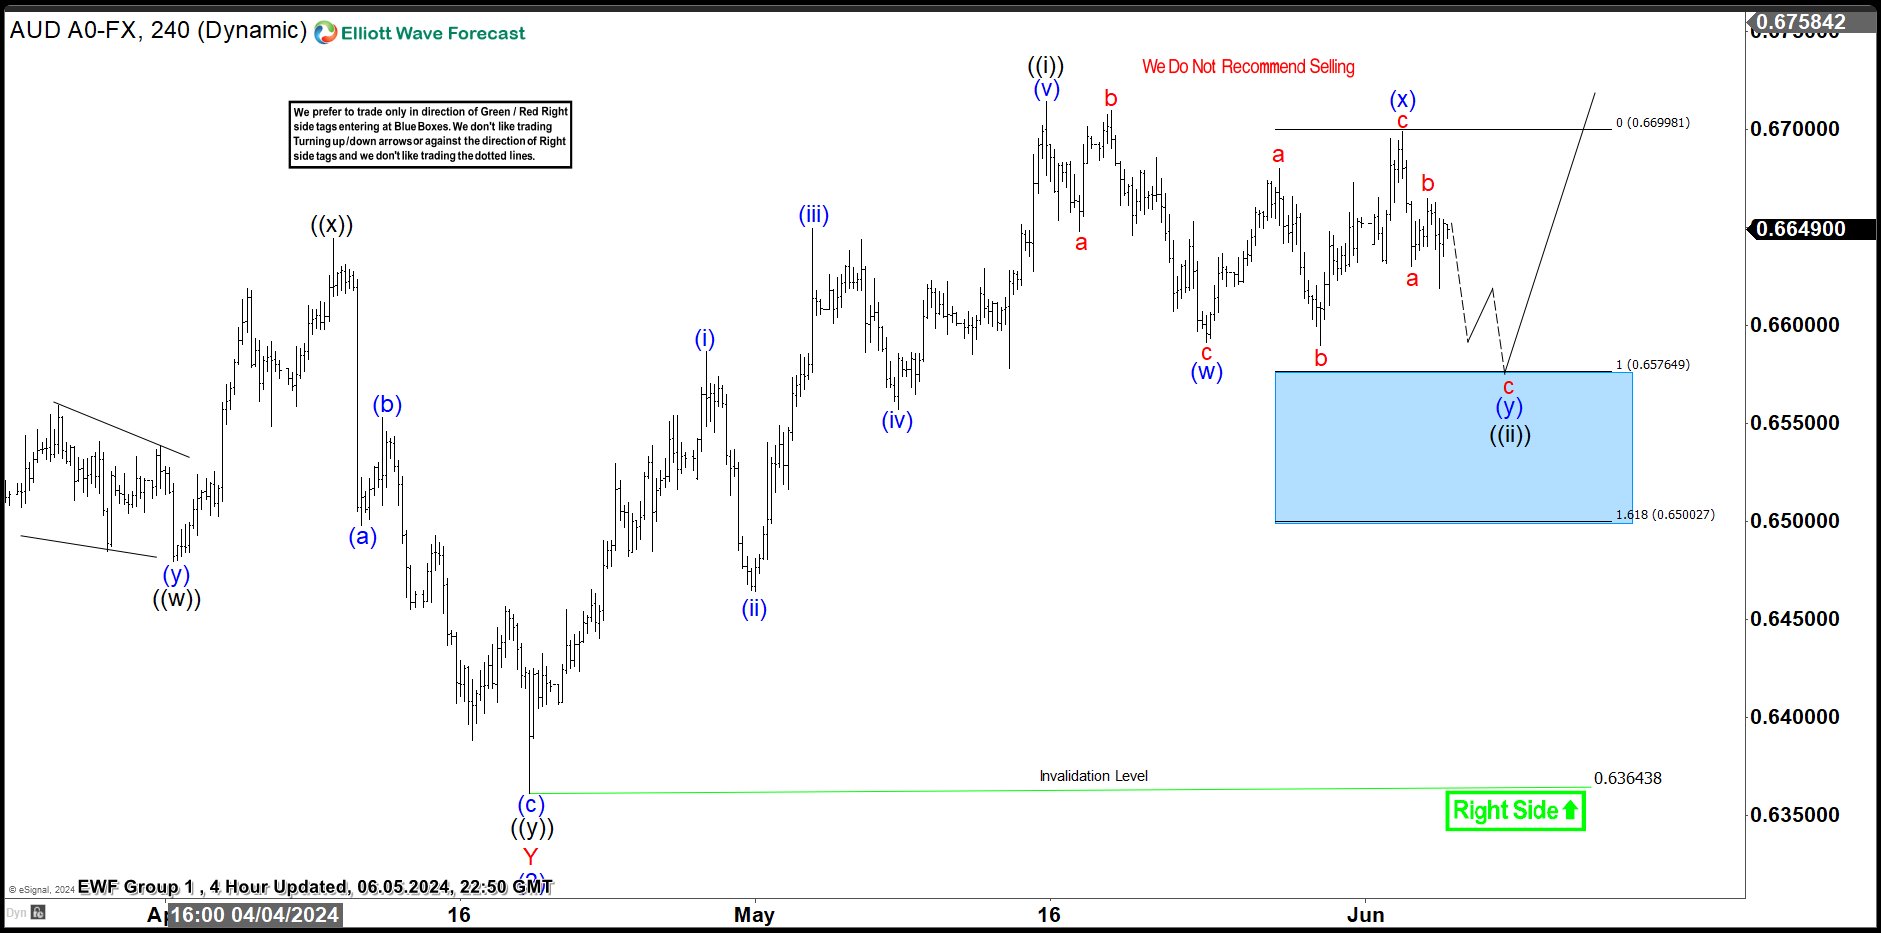
AUDUSD H4 London Update 06.05.2024
The pair is correcting cycle from the 0.63618 low low. The pull back looks incomplete at the moment. As far as the price stays below (x) blue peak: 0.6699, our analysis forecasts further downside in AUDUSD toward the 0.6576-0.65002 area ( blue box).
Despite the expected extension lower, we advise against selling AUDUSD. Once the pair reaches this blue box area, we expect it to attract buyers. We can see either rally towards new highs or a corrective bounce in three waves at least. Once the bounce reaches the 50% Fibonacci retracement level against the connector high -(X) blue, we’ll secure our position by moving the stop-loss to breakeven. To safeguard our trade, we’ll closely monitor for any break below the marked invalidation level :0.65002 .
A quick reminder:
Our charts are designed for simplicity and ease of trading:
Red bearish stamp + blue box = Selling Setup
Green bullish stamp + blue box = Buying Setup
Charts with Black stamps are deemed non-tradable. 🚫
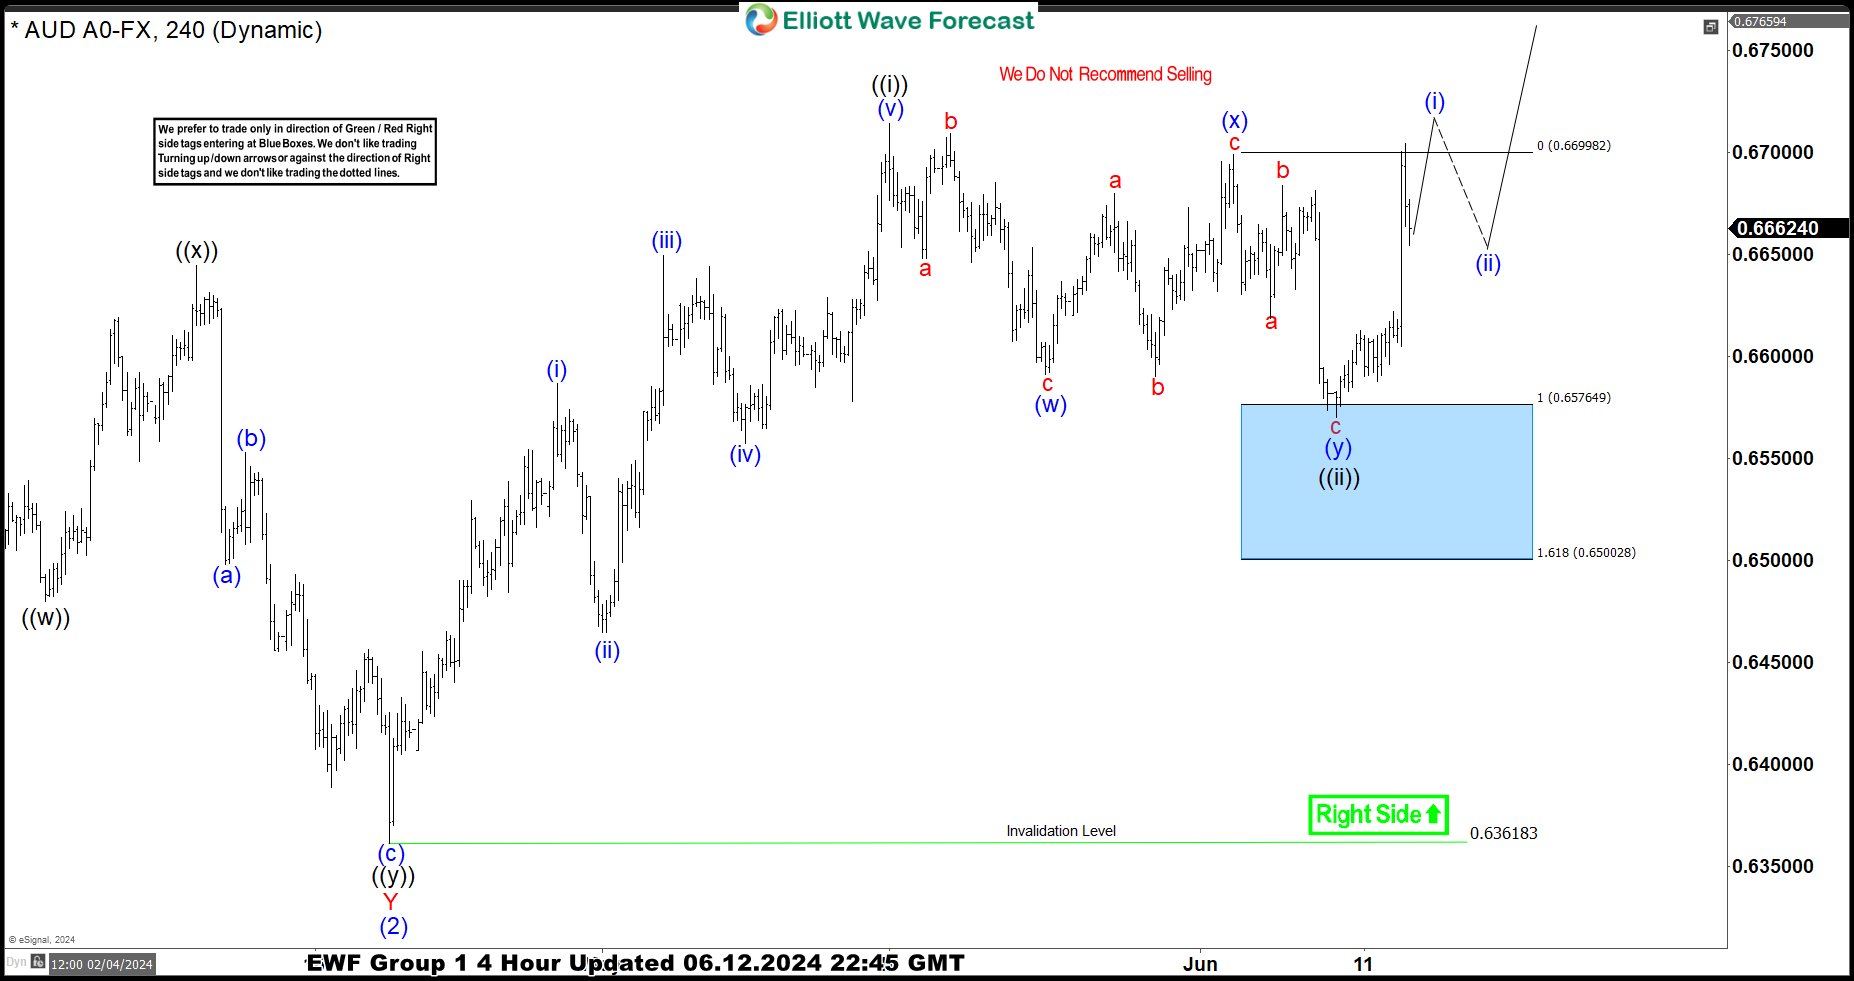
 AUDUSD H4 London Update 06.13.2024
The pair found buyers within the Blue Box area as expected. We got a nice rally from our buying zone, counting pull back completed at the 0.65697 low. The bounce has exceeded the 50% Fibonacci retracement level against the connector peak. As a result, traders who entered long positions are now enjoying risk-free profits. With the price holding above the 0.65697 low, we believe the next leg up can be in progress. For confirmation on the next leg up, we’re looking for a break above the May 16th peak.
ECB’s Vasle: Further rate cuts possible this year if data remains favorable
ECB Governing Council member Bostjan Vasle has hinted at the possibility of further rate cuts this year, provided the baseline scenario holds and economic data supports such a move.
Speaking to Finance newspaper, Vasle said, "If the baseline scenario is realized and the data are favorable, then we can probably expect further rate cuts already this year, and then also next year."
However, he cautioned that if the economic conditions are not as supportive, it would be prudent to "wait some more time with further steps."
Vasle also highlighted several risks that could slow down the disinflation process, pointing to "relatively strong" momentum in wages, ongoing economic growth, and geopolitical uncertainties. These factors could impact the ECB's decision-making process regarding future rate cuts.
EUR/GBP Daily Outlook
Daily Pivots: (S1) 0.8425; (P) 0.8439; (R1) 0.8459; More...
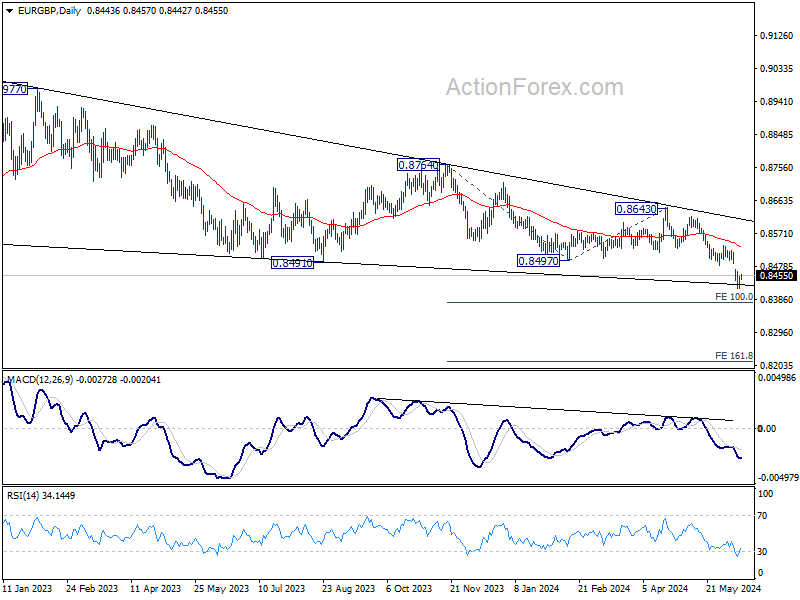
Intraday bias in EUR/GBP is turned neutral with current recovery, and some consolidations would be seen first. Further decline is expected as long as 0.8482 support turned resistance holds. Below 0.8417 will resume larger down trend to 0.8376 projection level next. On the upside, firm break of 0.8482 will bring stronger rebound instead.
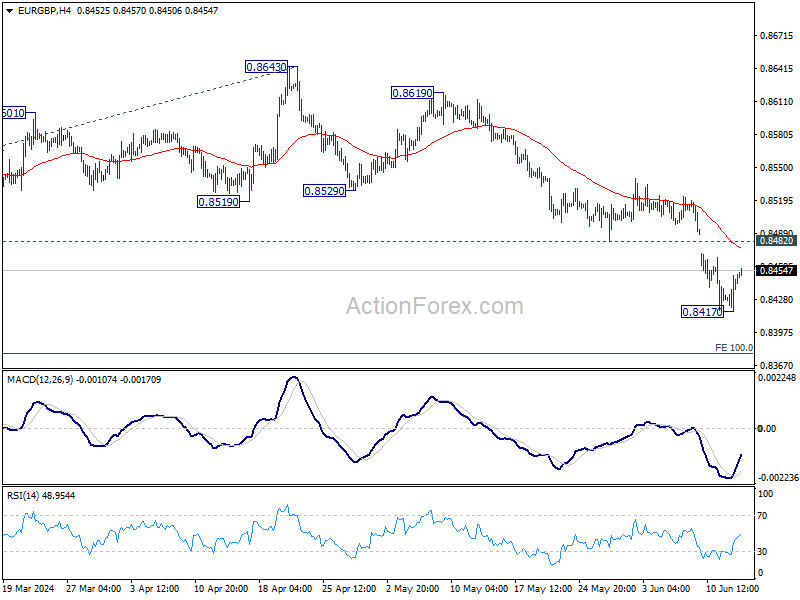
In the bigger picture, down trend from 0.9267 (2022 high) is in progress. Next target is 100% projection of 0.8764 to 0.8497 from 0.8643 at 0.8376. Sustained break there will target 161.8% projection at 0.8211 next. For now, outlook will remain bearish as long as 0.8643 resistance holds, even in case of stronger rebound.
EUR/AUD Daily Outlook
Daily Pivots: (S1) 1.6167; (P) 1.6231; (R1) 1.6286; More...
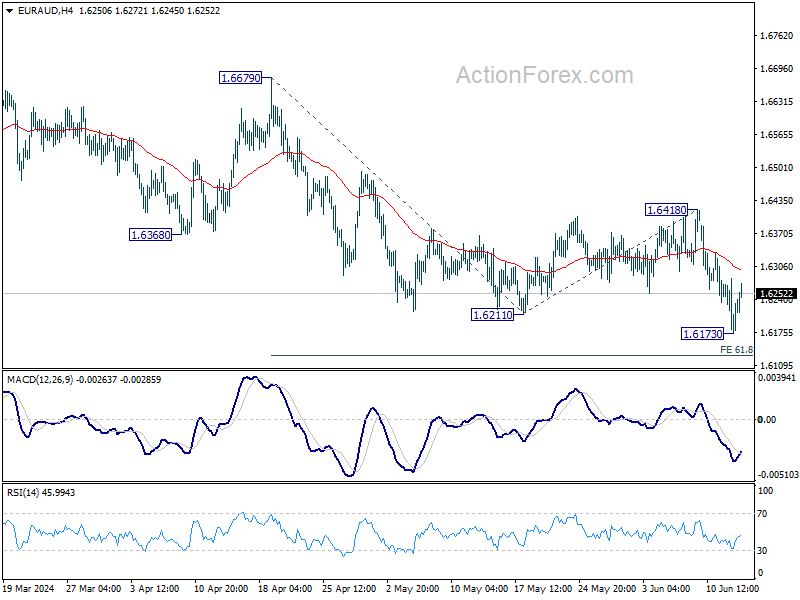
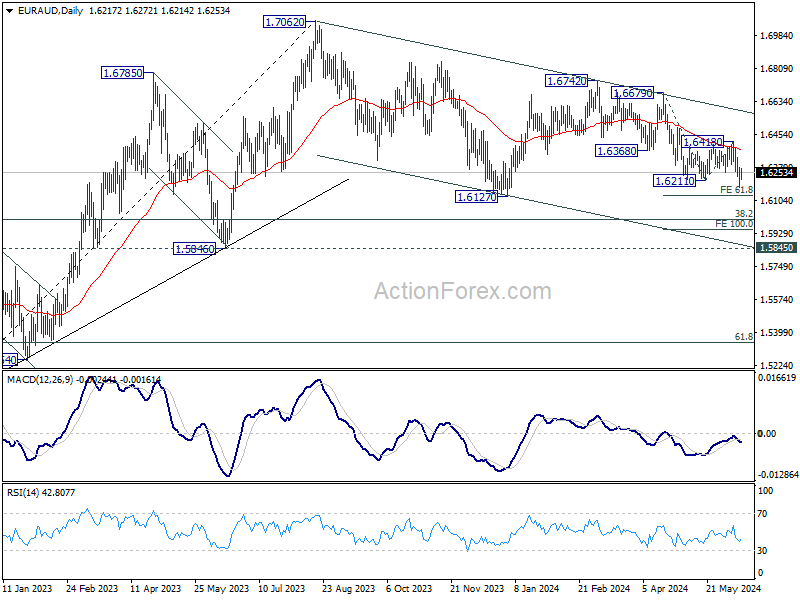
EUR/AUD recovered after dipping to 1.6173 and intraday bias is turned neutral first. But outlook will stay bearish as long as 1.6418 resistance holds. Break of 1.6173 will resume the decline from 1.6742, as the third leg of the correction from 1.7062. Next target is 61.8% projection of 1.6679 to 1.6211 from 1.6418 at 1.6129.
In the bigger picture, fall from 1.7062 medium term top is seen as a correction to the up trend from 1.4281 (2022 low). In case of deeper fall, strong support is expected around 1.5846 and 38.2% retracement of 1.4281 to 1.7062 at 1.6000 to bring rebound. Break of 1.7062 is in favor as a later stage.
EUR/JPY Daily Outlook
Daily Pivots: (S1) 168.84; (P) 169.22; (R1) 169.78; More...
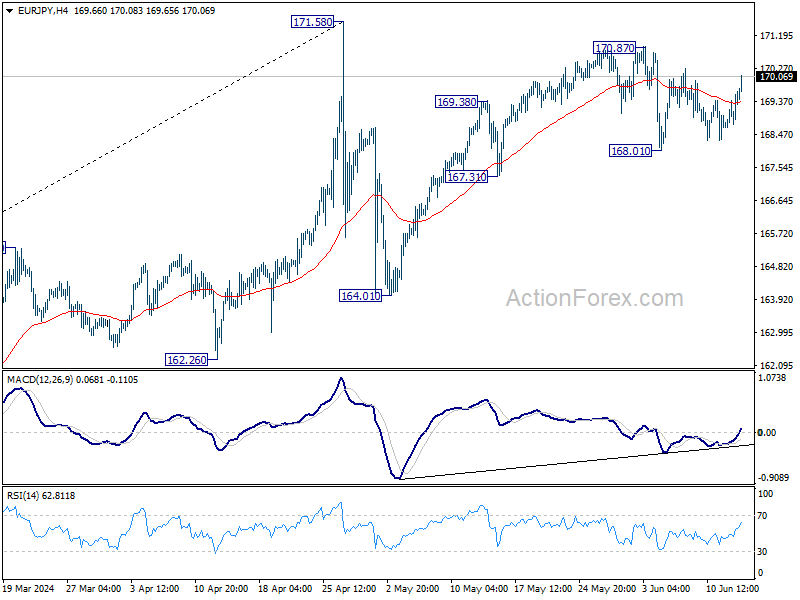
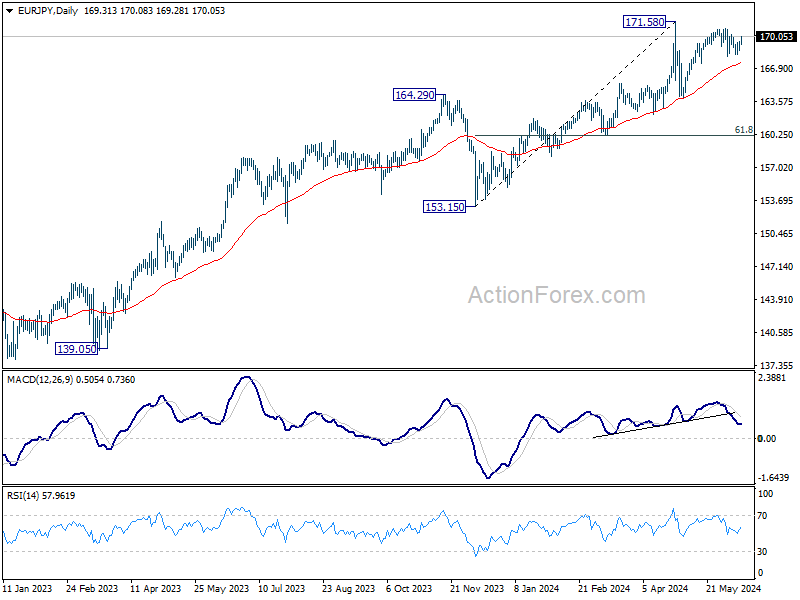
Intraday bias in EUR/JPY remains neutral for the moment. On the downside, break of 168.01 support will strengthen the case that rise from 164.31 has completed at 170.78 already. Intraday bias will be back on the downside for 167.31 support, and then 164.01. Nevertheless, break of 170.87 will resume the rally to retest 171.58 high instead.
In the bigger picture, a medium top was formed at 171.58 after brief breach of 169.96 (2008 high). But as long as 55 W EMA (now at 159.51) holds, price actions from there is seen as correcting the rise from 153.15 only. That is, larger up trend remains in favor to continue. However, sustained break of 55 W EMA will argue that larger scale correction is underway and target 153.15 support.
GBP/JPY Daily Outlook
Daily Pivots: (S1) 199.96; (P) 200.46; (R1) 201.08; More...
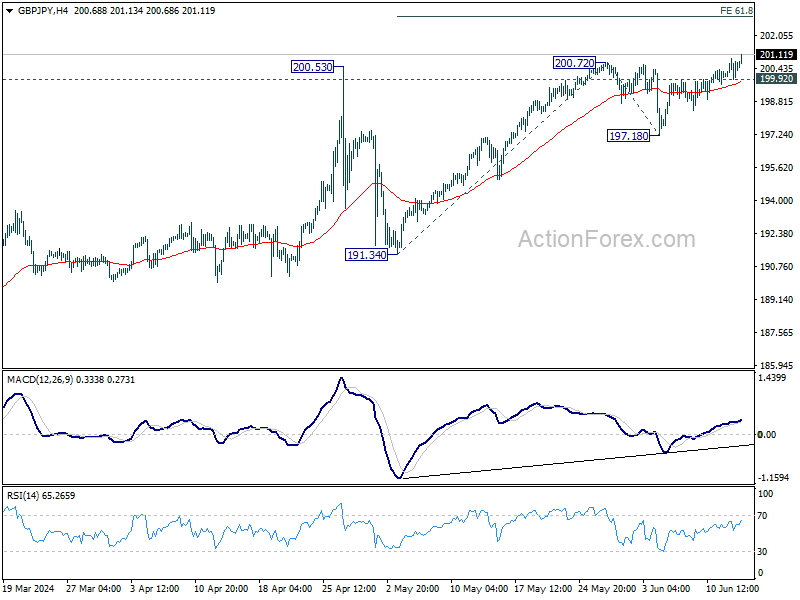
Intraday bias in GBP/JPY is back on the upside as up trend resumes. Next target is 61.8% projection of 191.34 to 200.72 from 197.18 at 202.97. On the downside, below 199.92 minor support will turn intraday bias neutral and bring consolidations first, before staging another rally.
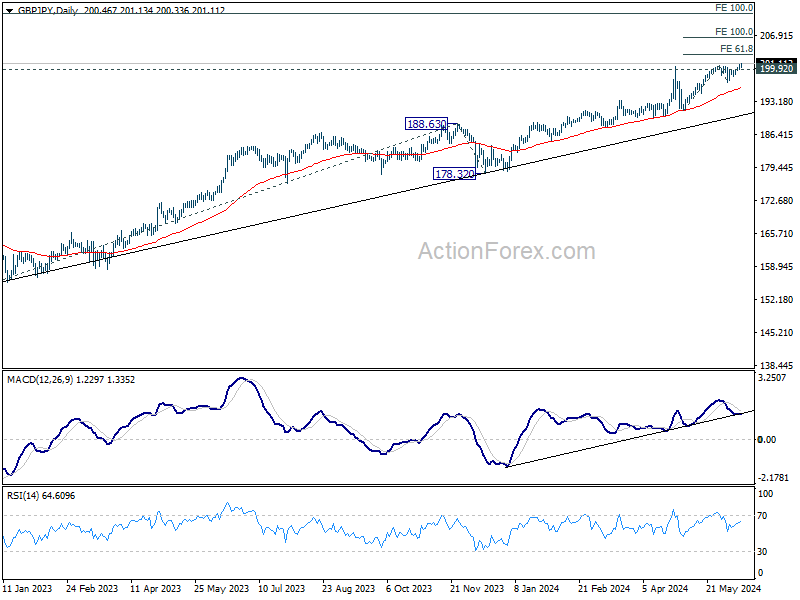
In the bigger picture, as long as 188.63 resistance turned support holds, long term up trend is expected to continue. Next target is 100% projection of 155.33 to 188.63 from 178.32 at 211.62.
EUR/CHF Daily Outlook
Daily Pivots: (S1) 0.9633; (P) 0.9654; (R1) 0.9690; More....
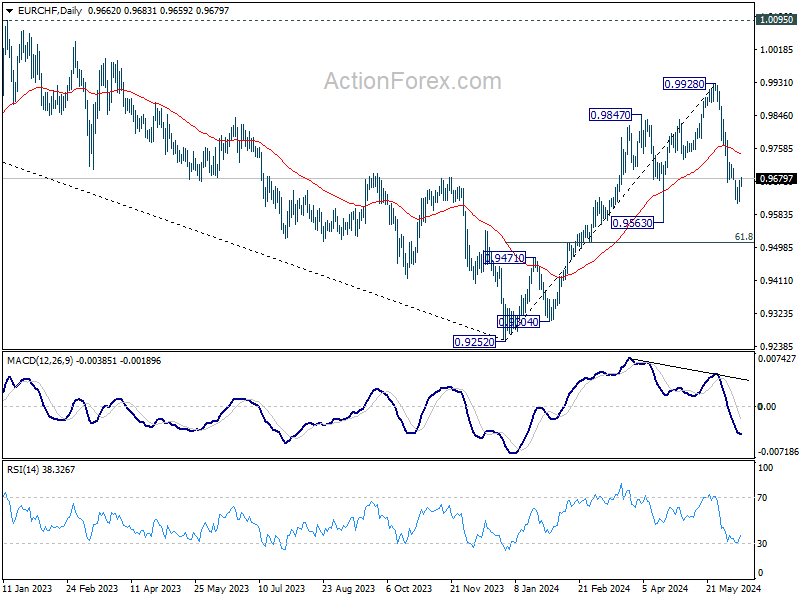
Intraday bias in EUR/CHF is turned neutral with current recovery. Some consolidations could be seen, but another fall is expected as long as 55 D EMA (now at 0.9747) holds. Below 0.9613 will target 0.9563 support. Decisive break there will argue that whole rise from 0.9252 has completed, and bring deeper fall to 61.8% retracement of 0.9252 to 0.9928 at 0.9510.
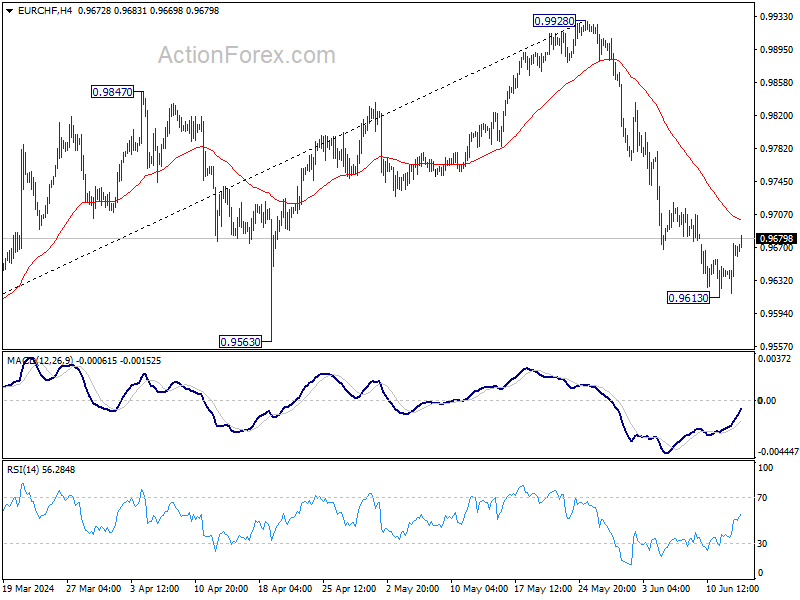
In the bigger picture, as long as 0.9563 support holds, rise from 0.9252 medium term bottom is still in favor to continue. Next target is 38.2% retracement of 1.2004 (2018 high) to 0.9252 (2023 low) at 1.0303, even just as a correction to the down trend from 1.2004. However, firm break of 0.9563 will suggest that the rally has completed and retain medium term bearishness.
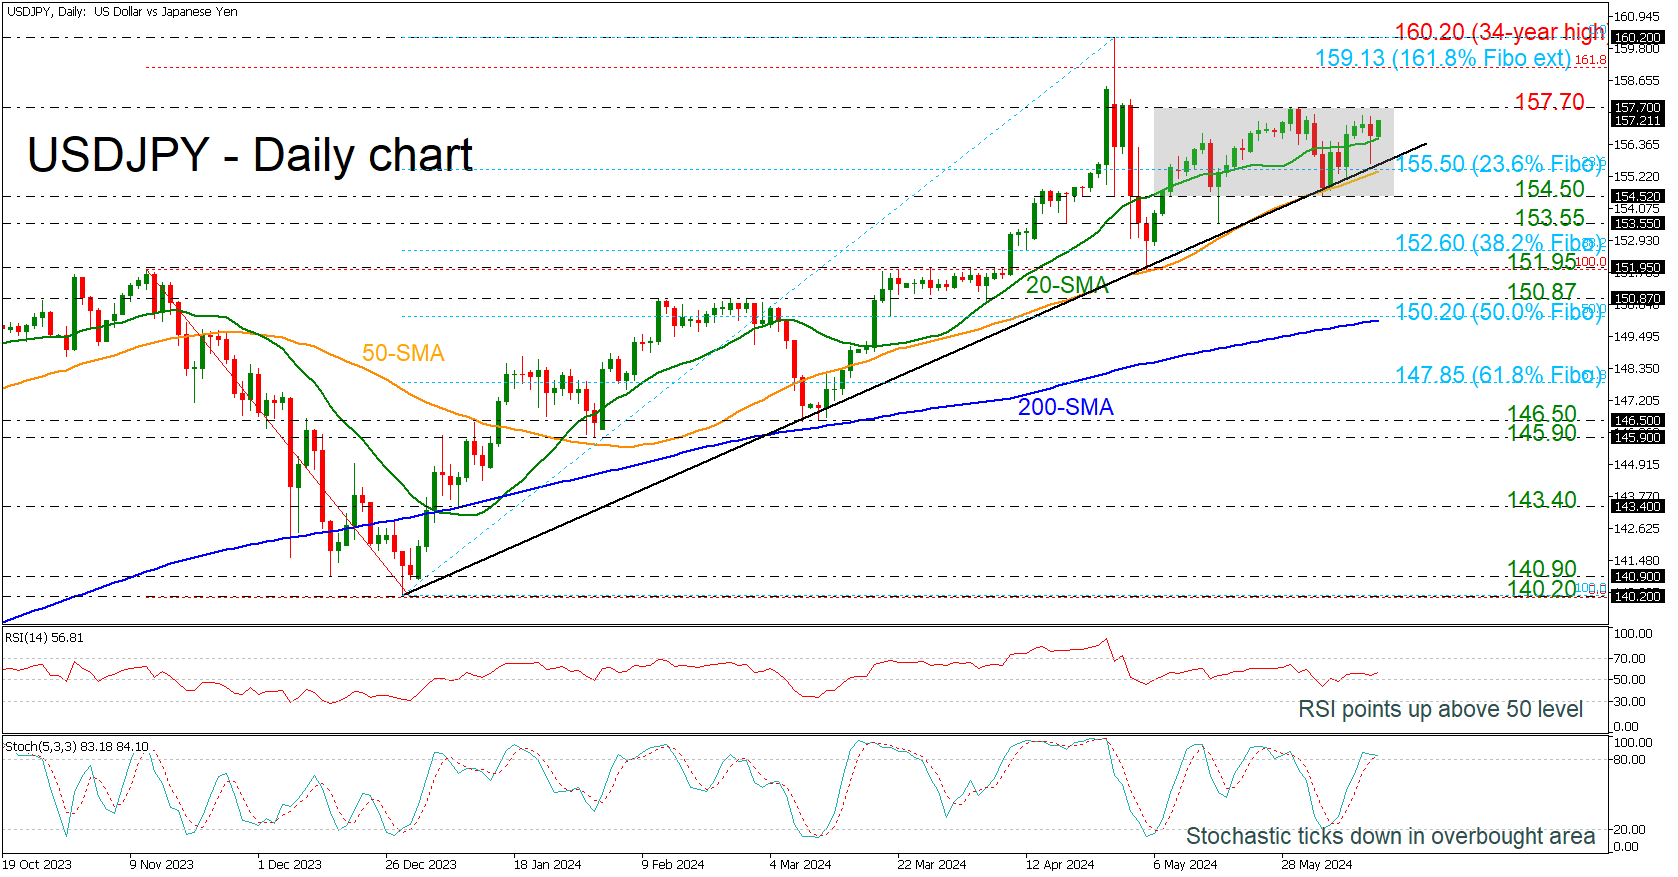
USDJPY Holds Within Narrow Range in Near Term
- USDJPY remains below 157.70
- Uptrend line acts as strong support
- Momentum oscillators show contradicting signs
USDJPY is still developing below the 157.70 resistance level and well above the medium-term ascending trend line, failing to have a notable movement after the US CPI data and the Fed decision on Wednesday.
The technical oscillators are showing some mixed signals. The RSI is pointing upwards above the neutral threshold of 50, while the stochastic is heading south, posting a bearish crossover within its %K and %D lines in the overbought area, suggesting an overstretched market.
A successful jump above the 157.70 barrier could open the way for a test of the 159.13 level, which is the 161.8% Fibonacci extension level of the down leg from 151.95 to 140.20. Even higher, the 160.00 round number could be a crucial resistance zone for traders as the market failed to have a closing session above this level, but it recorded a spike towards 160.20.
Alternatively, a drop below the 20-day simple moving average (SMA) could send the pair until the immediate 23.6% Fibonacci retracement level of the upward move from 140.20 to 160.20 at 155.50, which overlaps with the 50-day SMA. Steeper decreases may take the market until the 154.50 and 153.55 levels.
All in all, USDJPY is looking neutral in the near term as it has been moving sideways within 154.50-157.70 over the last month. In the broader outlook the pair is still positive as long as it stands above the uptrend line.
Dollar Falls After Inflation Data: Is a Change in Medium-Term Trends on the Horizon?
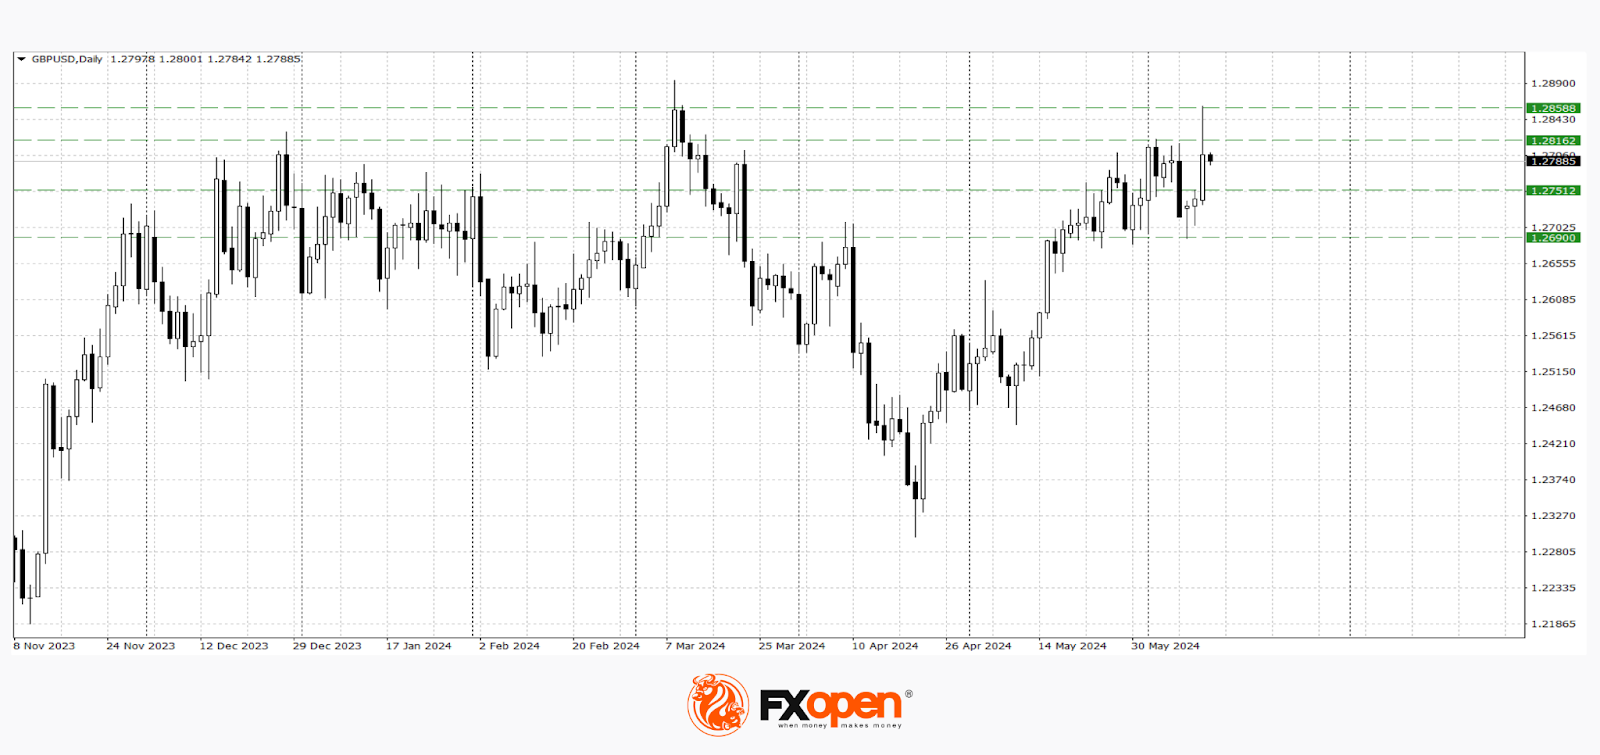
The second consecutive decline in the US core consumer price index caused a sharp drop in the American currency across the board. For instance, the GBP/USD pair rose by 120 points within a couple of hours, attempting to strengthen above 1.2800. The EUR/USD pair closed Monday's “price gap” and tested 1.0850, while the USD/JPY pair briefly traded below 156.00. However, a change in medium-term trends remains highly uncertain. The Fed meeting and the publication of an updated economic forecast by the US regulator allowed the dollar to quickly recover some losses.
From yesterday's Fed statement:
- The target range for the federal funds rate remains at 5.25–5.50%;
- The median forecast by FOMC members suggests one and a half rate cuts for the federal funds rate (compared to three in the March forecast).
From the published data, it can be inferred that the Fed maintains a fairly hawkish stance, which could support buyers of the US currency.
GBP/USD
The GBP/USD pair fell just short of updating the current year's high at 1.2895 by several dozen points. Technical analysis of the GBP/USD pair indicates that the price has returned to the multi-day flat corridor of 1.2820-1.2700. If GBP buyers fail to hold 1.2800 as support, the price may drop to 1.2750-1.2700. Updating the yearly highs could lead to a test of 1.3000. Factors that may influence the pair’s price include:
- Today at 15:30 (GMT +3:00) - Initial US jobless claims;
- Today at 19:00 (GMT +3:00) - Speech by US Treasury Secretary Janet Yellen;
- Today at 15:30 (GMT +3:00) - US Producer Price Index (PPI).
 USD/JPY
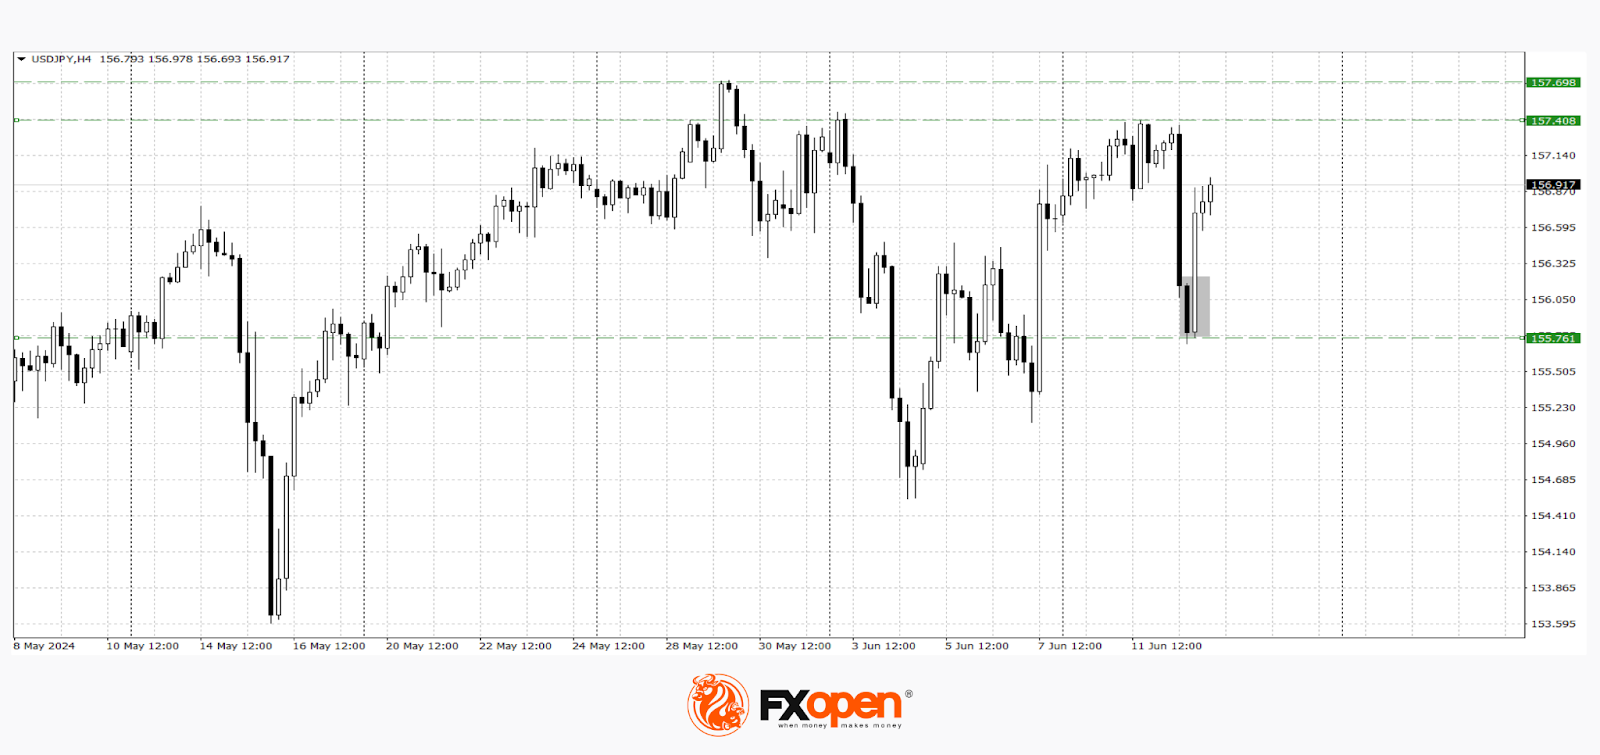
The pair almost tested the announced levels yesterday and is trading near 157.00 again. Technical analysis of the USD/JPY pair on the H4 timeframe shows the formation of a “bullish engulfing” pattern, which may lead to a test of the 157.70-157.40 range. This pattern would be invalidated if the price drops below yesterday's low of 155.70.
Prepare for increased volatility in the pair tomorrow morning: at 06:00 (GMT +3:00), the Bank of Japan will announce its rate decision.
Trade over 50 forex markets 24 hours a day with FXOpen. Take advantage of low commissions, deep liquidity, and spreads from 0.0 pips. Open your FXOpen account now or learn more about trading forex with FXOpen.
This article represents the opinion of the Companies operating under the FXOpen brand only. It is not to be construed as an offer, solicitation, or recommendation with respect to products and services provided by the Companies operating under the FXOpen brand, nor is it to be considered financial advice.
EUR/USD Daily Outlook
Daily Pivots: (S1) 1.0745; (P) 1.0799; (R1) 1.0862; More....
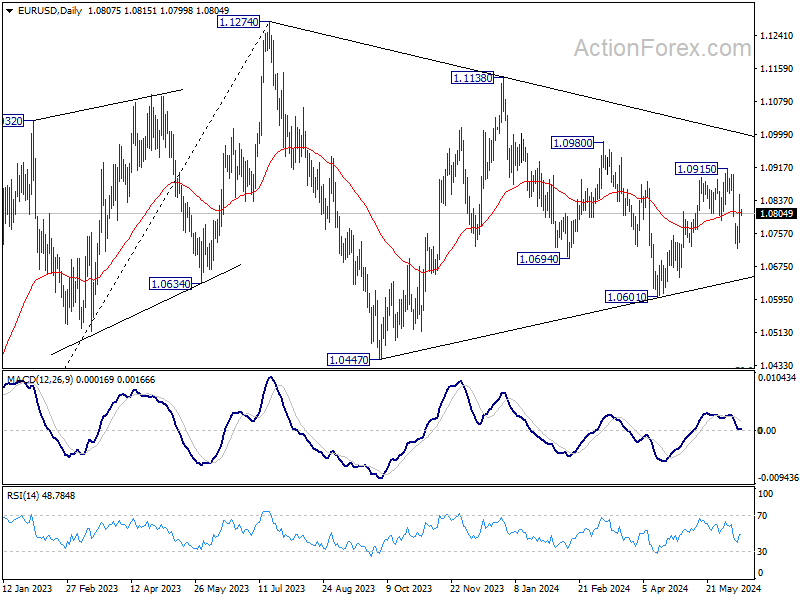
Intraday bias in EUR/USD is turned neutral again first with current retreat. On the upside, firm break of 1.0915 will resume whole rise from 1.0601. On the downside, break of 1.0718 will resume the fall from 1.0915 instead.
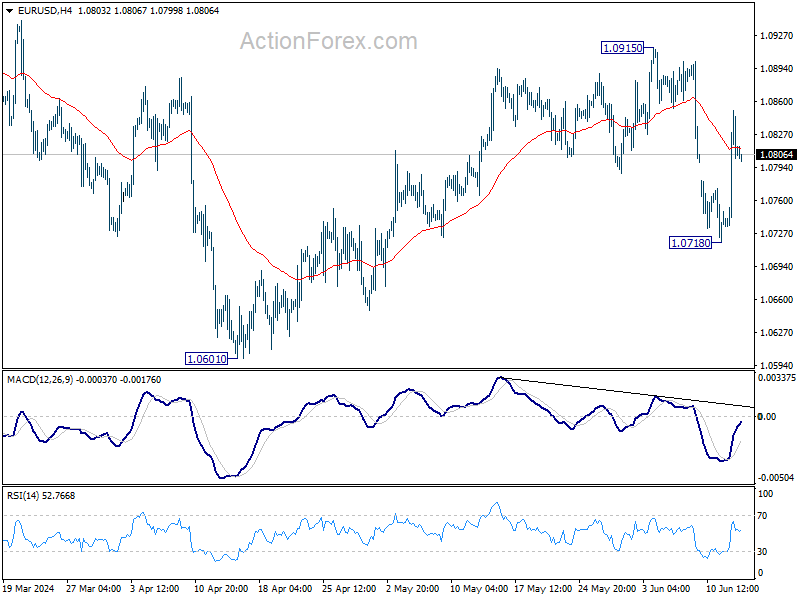
In the bigger picture, price actions from 1.1274 are viewed as a corrective pattern, which might still be in progress. Break of 1.0601 will target 1.0447 support and possibly below. Nevertheless, on the upside, firm break of 1.1138 will argue that larger up trend from 0.9534 (2022 low) is ready to resume through 1.1274 high.