Sample Category Title
Pound Edges Lower, Markets Eye FedSpeak
The British pound is down slightly on Friday. GBP/USD is down 0.14%, trading at 1.2648 in the European session at the time of writing.
It has been a good week for the pound, which has gained 1% against the US dollar. Wednesday’s inflation release showed CPI dipping in April, reversing the trend of the past several months. The unexpected stickiness in inflation had delayed a rate cut from the Federal Reserve and the drop in April inflation raised expectations for a rate cut, sending equity markets higher and the US dollar lower, with GBP/USD jumping 0.75% on Wednesday.
The Federal Reserve has been cautious about shifting its “higher for longer” policy, which has kept rates on hold for six straight times. The unexpected rise in inflation in the first quarter and strong US economic data has delayed plans to lower rates. The Fed signaled in January that it was planning to cut rates three times this year but is now looking at one or perhaps two rate cuts before the end of the year.
There are no key economic releases out of the US today but three FOMC members, Waller, Daly and Kugler, will deliver speeches which could provide some insights into future US rate policy. FOMC members have sounded rather hawkish, saying that restrictive policy is working and there is no rush to lower rates.
The Bank of England is under pressure to lower rates as inflation has fallen to 3.2%. The path to achieving the 2% target is likely to be bumpy but the labour market is showing signs of cooling down, which supports a rate cut. The June meeting promises to be interesting, with the markets pricing in a 50/50 probability of a rate cut or a hold.
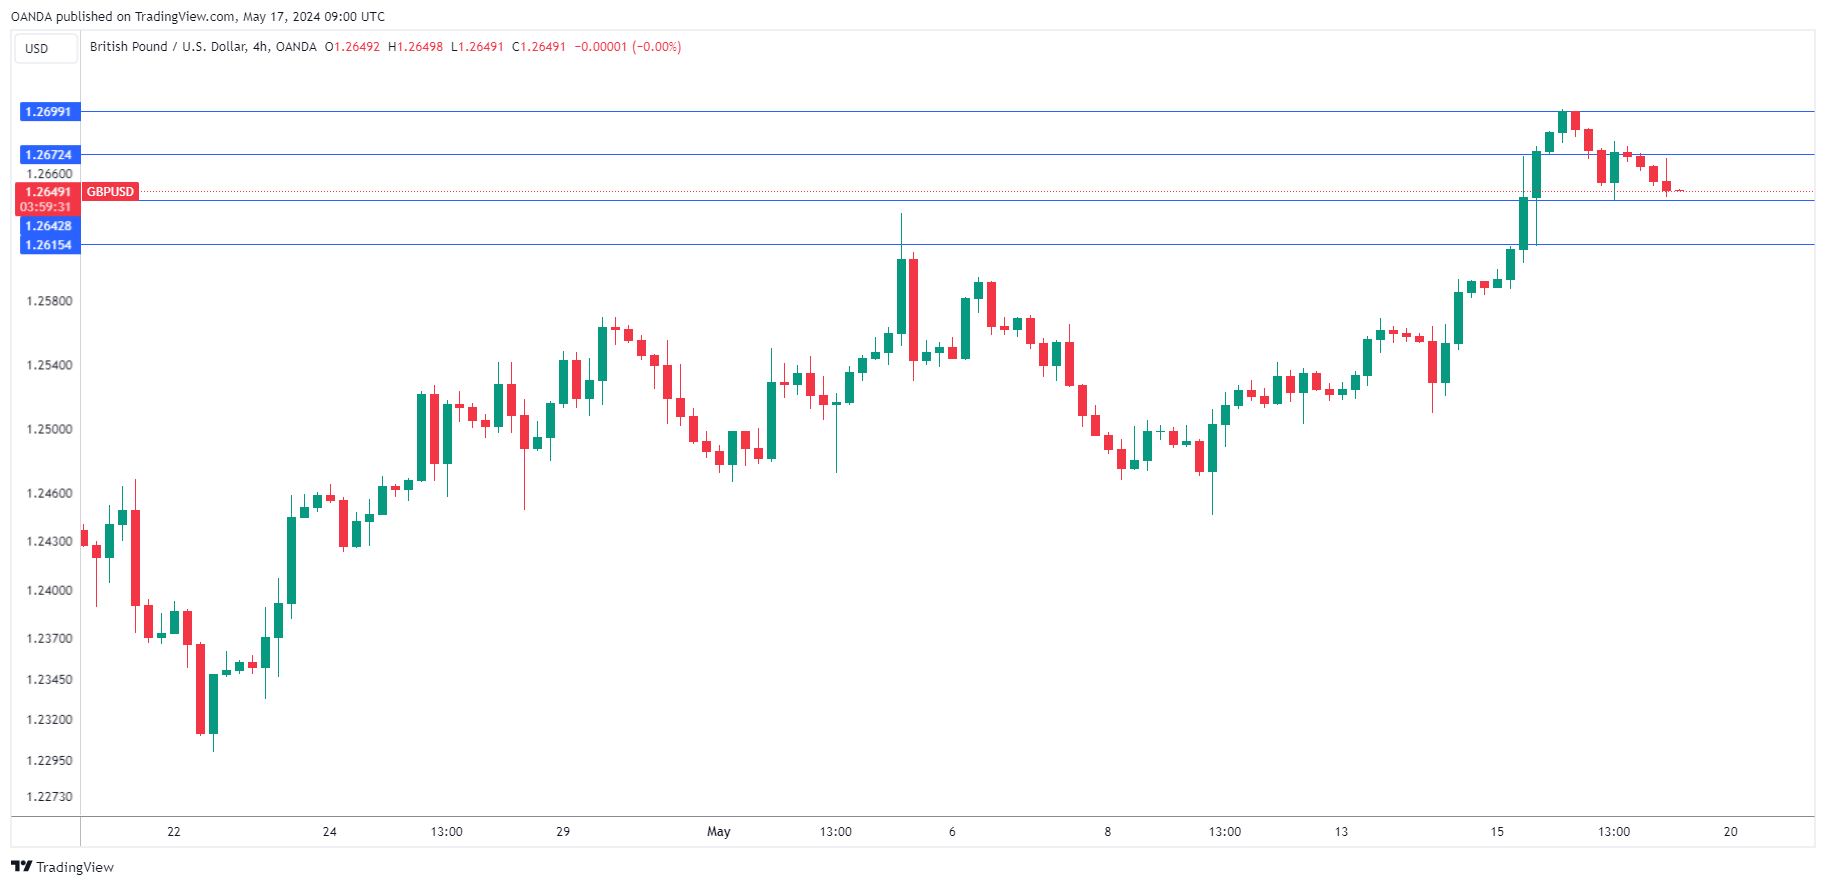
GBP/USD Technical
- GBP/USD is putting pressure on support at 1.2642. Below, there is support at 1.2615
- 1.2672 and 1.2699 are the next resistance lines
Australian Dollar Hits 4-month High
The Australian dollar is lower on Friday. AUD/USD is currently trading at 0.6658 in the European session, down 0.31% on the day.
The Aussie touched a high of 0.6714 on Thursday, its highest level since January 10th. This followed a massive 1% surge on Wednesday after the US inflation report indicated that April CPI ticked lower, raising expectations of a Federal Reserve rate cut.
Australian dollar after mixed Chinese data
Chinese data was a mix on Friday. Industrial production expanded by 6.7% y/y in April, compared to 4.5% in March and well above the market estimate of 5.5%. Manufacturing has shown stronger activity as the government has provided stimulus to the economy which has had a bumpy recovery from Covid.
Chinese consumers have cut spending due to the uncertain economic conditions and April retail sales was a major disappointment, dropping to 2.3% y/y. This was down from 3.1% in March and short of the market consensus of 3.8%. Retail sales remain in positive territory but the April release was the lowest in15 months and that is sure to get the attention of policy makers. China is Australia’s largest trading partner and a downtrend in domestic demand in China would spell trouble for the Australian export sector and could weigh on the Australian dollar.
The Reserve Bank of Australia meets next on June 18th. At last week’s meeting, there was no surprise as the RBA held the cash rate at 4.35% for a fourth straight time. The central bank discussed the possibility of a rate hike at the meeting, which was not the case at the March meeting. This indicates that that policy makers are concerned that the path to the 2% inflation target will be bumpy and are hesitant to start lowering rates until they see evidence of sustainable price stability.
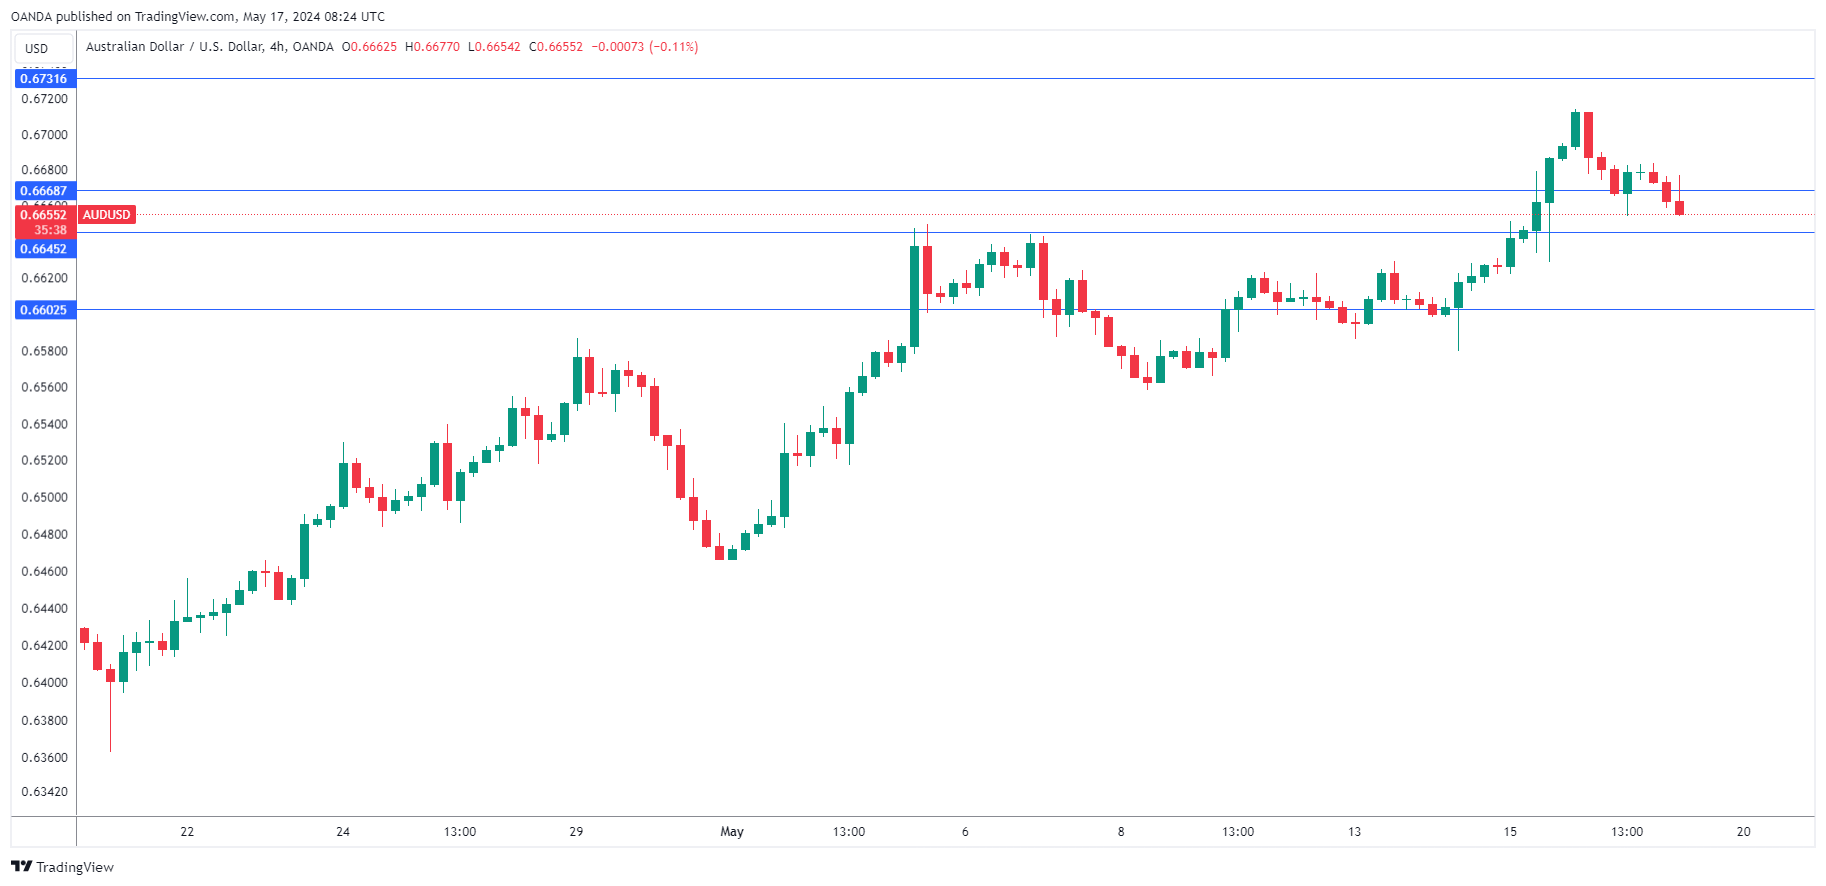
AUD/USD Technical
- AUD/USD tested support at 0.6645 earlier. Below, there is support at 0.6602
- 0.6668 and 0.6731 are the next resistance lines
Eurozone CPI finalized at 2.4% in Apr, core CPI at 2.7%
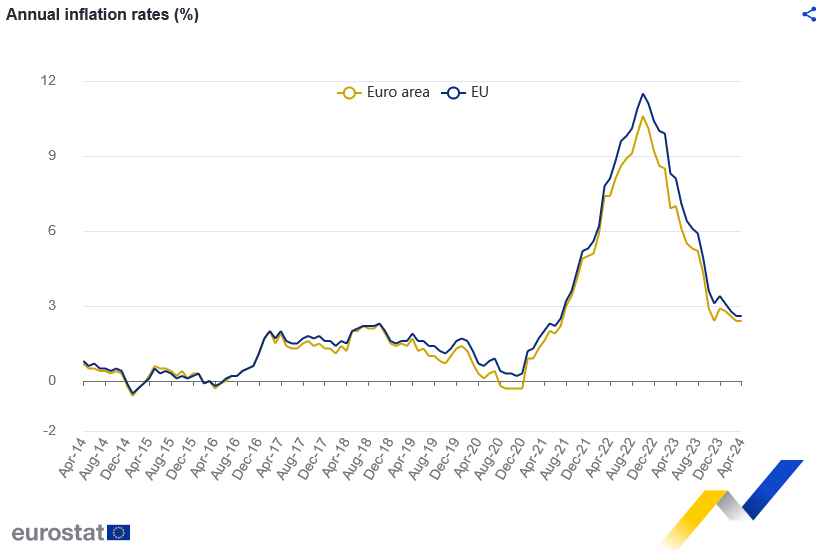
Eurozone CPI was finalized at 2.4% yoy in April, unchanged from March's reading. CPI core (ex-energy, food, alcohol & tobacco) was finalized at 2.7% yoy, down from prior month's (2.9% yoy). The highest contribution to the annual Eurozone inflation rate came from services (+1.64 percentage points, pp), followed by food, alcohol & tobacco (+0.55 pp), non-energy industrial goods (+0.23 pp) and energy (-0.04 pp).
EU CPI was finalized at 2.6% yoy. The lowest annual rates were registered in Lithuania (0.4%), Denmark (0.5%) and Finland (0.6%). The highest annual rates were recorded in Romania (6.2%), Belgium (4.9%) and Croatia (4.7%). Compared with March 2024, annual inflation fell in fifteen Member States, remained stable in four and rose in eight.
ECB’s de Guindos: Inflation to fluctuate at current levels before falling to 2% in 2025
ECB Vice President Luis de Guindos addressed inflation expectations at an event today, noting that "headline inflation is there at 2.4%, core inflation below 3%." He projected that inflation will "fluctuate around these values" in the coming months.
Looking further ahead, de Guindos expressed confidence in achieving ECB's long-term inflation goal, stating, "In the medium term, in the year 2025, we will be moving in a stable way towards our price stability objective which is 2%."
GBPJPY Ascends as BoJ is on the Lookout
- GBPJPY in the green again, returns to pre-intervention levels
- Increasing possibility of another BoJ intervention
- Momentum indicators remain mostly bullish
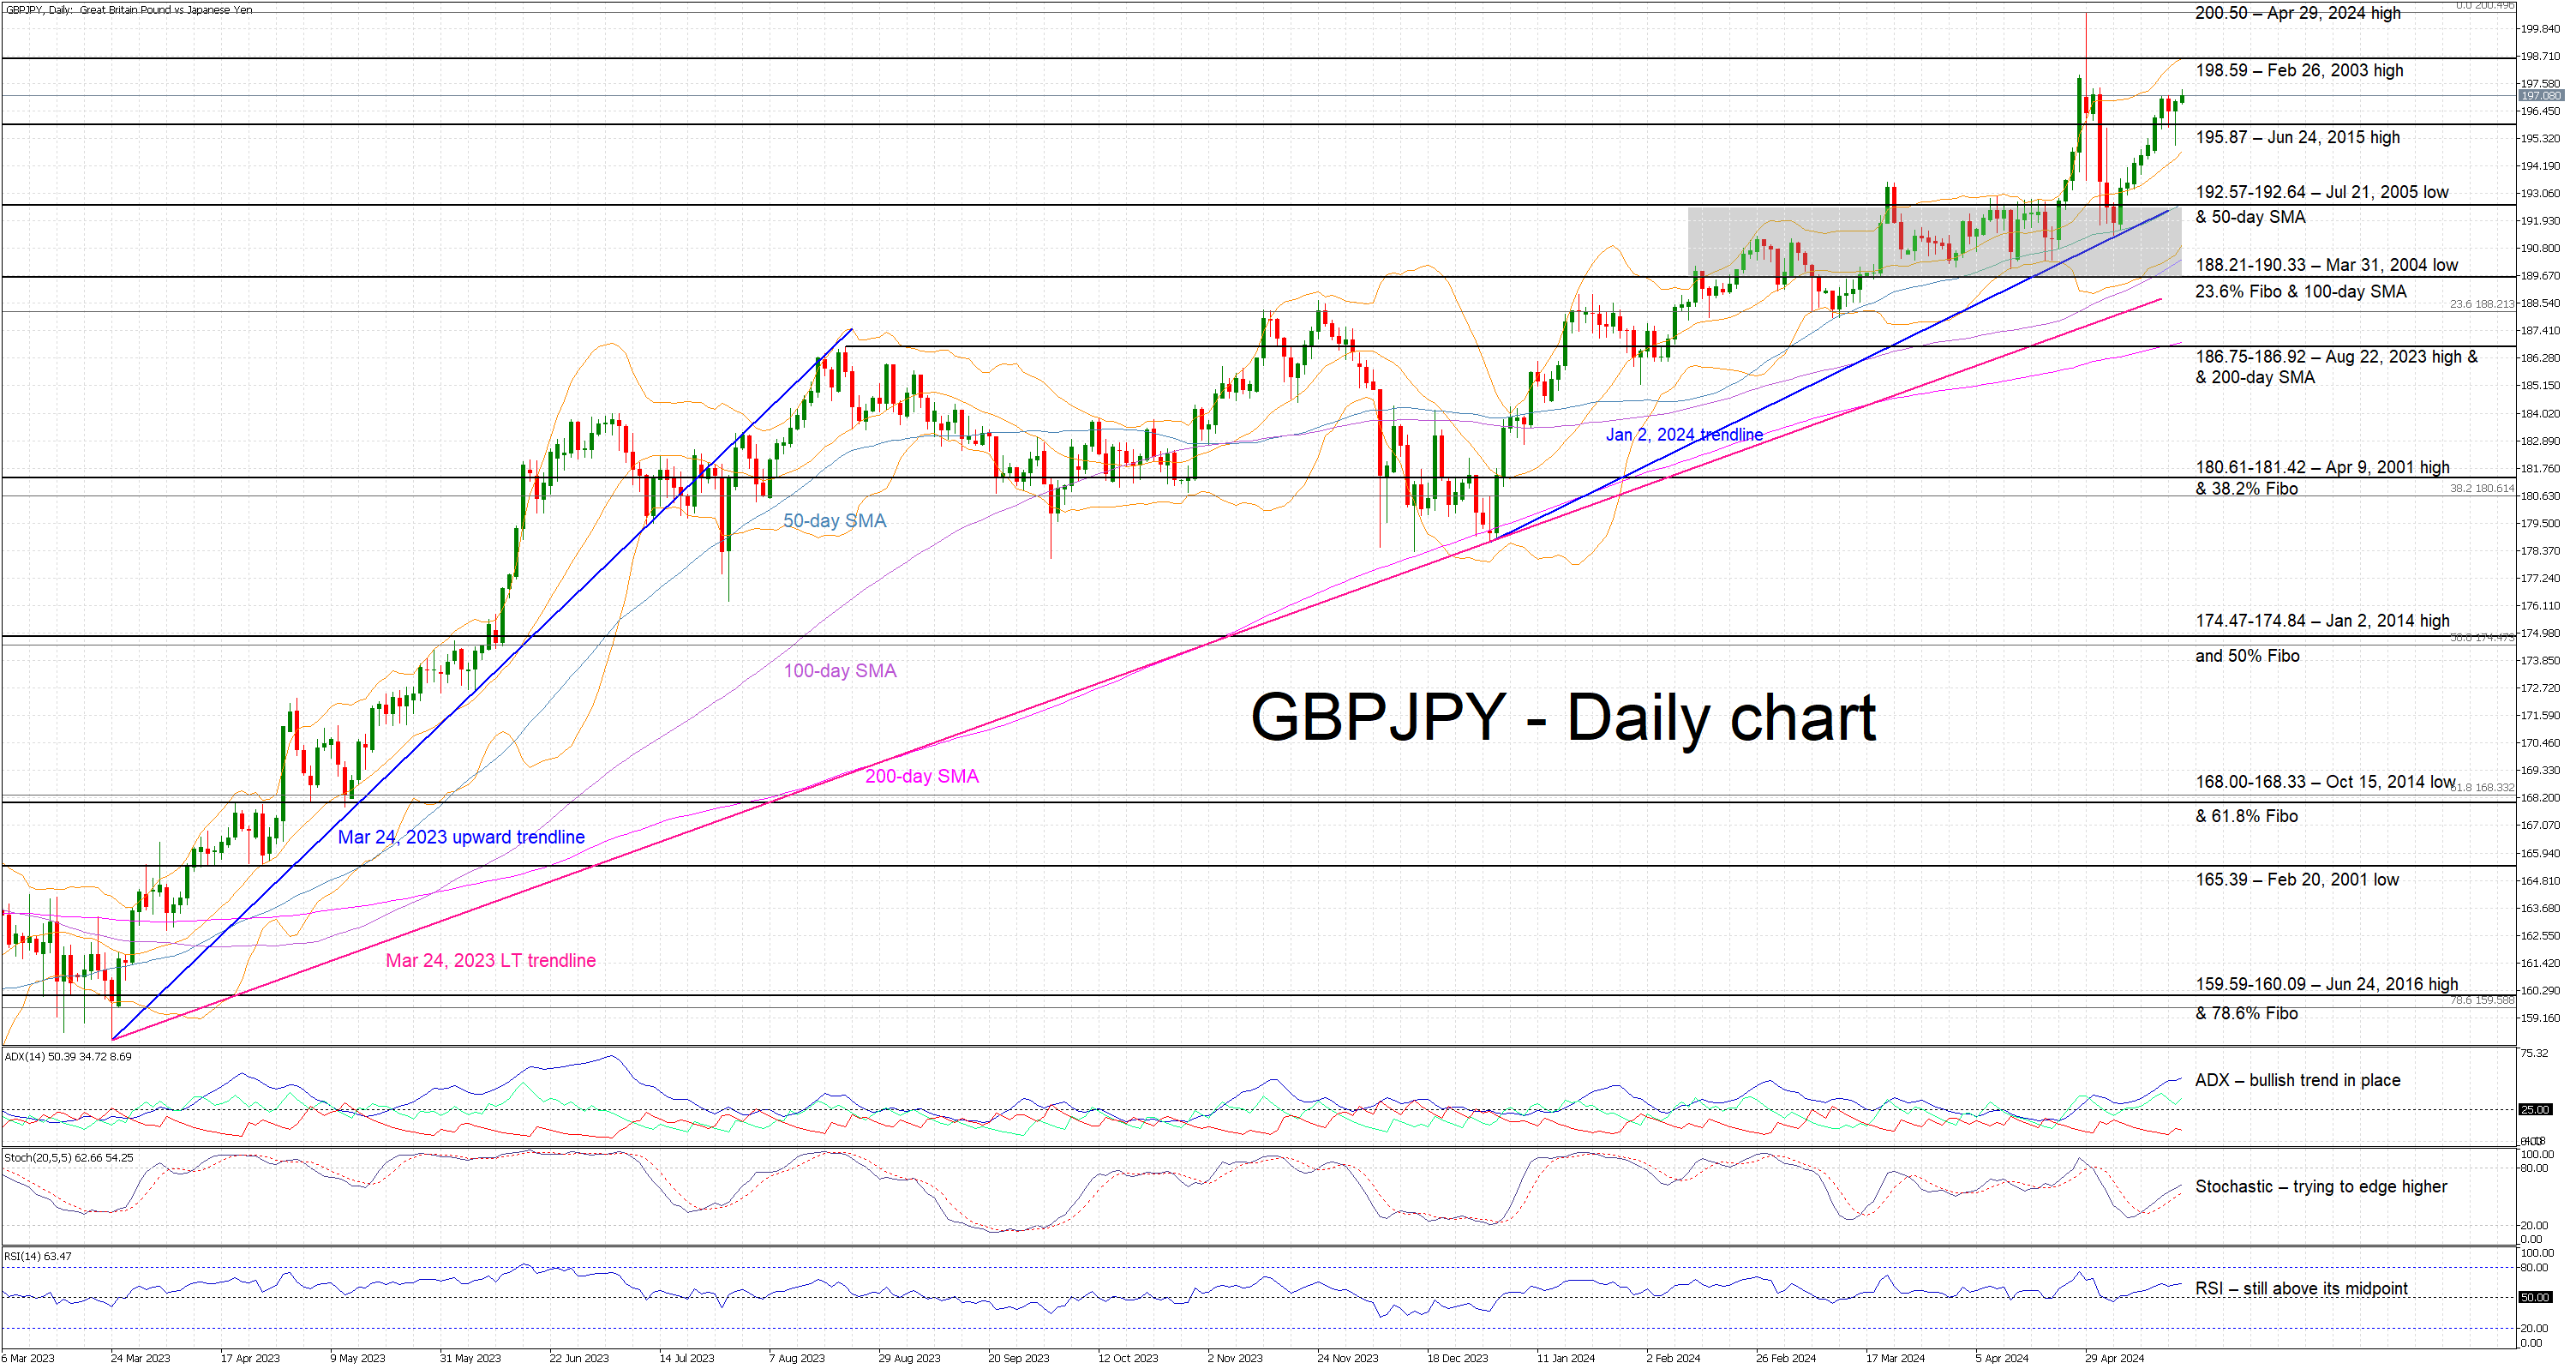
GBPJPY is edging higher again today, recording its ninth green candle in the last 10 sessions. The bearish momentum after the recent BoJ interventions has faded with the pair quickly returning to pre-intervention levels. This move raises the possibility for another swift reaction from the BoJ, especially as the recent Japanese data releases continue to disappoint.
In the meantime, momentum indicators are bullish but there are some early signs of a rally exhaustion. More specifically, the Average Directional Movement Index (ADX) is edging higher, signaling the presence of a strong bullish trend in GBPJPY, but it appears unable to record a higher high.
Similarly, the RSI has climbed again above its midpoint, confirming the ongoing bullish pressure, but it is currently trading sideways. More importantly, the stochastic oscillator has broken above its moving average, and is tentatively edging higher. Should this move pick up pace, it would be seen as a strong bullish signal.
If the bulls remain confident, they could lead GBPJPY higher towards the 198.59 level and then set their eyes on a much bigger prize - the April 29, 2024 high at 200.50. However, if successful, they would be trading at levels that could provoke another intervention from the Japanese authorities.
On the other hand, the bears could try to push GBPJPY back below the June 24, 2015 high at 195.87, and towards the 192.57-192.64 area, which is populated by the July 21, 2005 and the 50-day simple moving average (SMA), as well as the January 2, 2024 trendline. They could then test the support set by the 188.21-190.33 range and potentially lead GBPJPY below the recent rectangle pattern for the first time since early March.
To sum up, the bulls are pushing GBPJPY higher, closer to pre-interventions levels, and increasing the pressure on the BoJ to intervene again.
USDCAD Bounces Off Medium-Term Uptrend Line
- USDCAD recovers some ground above 1.3600
- Oscillators suggest upside correction in short-term
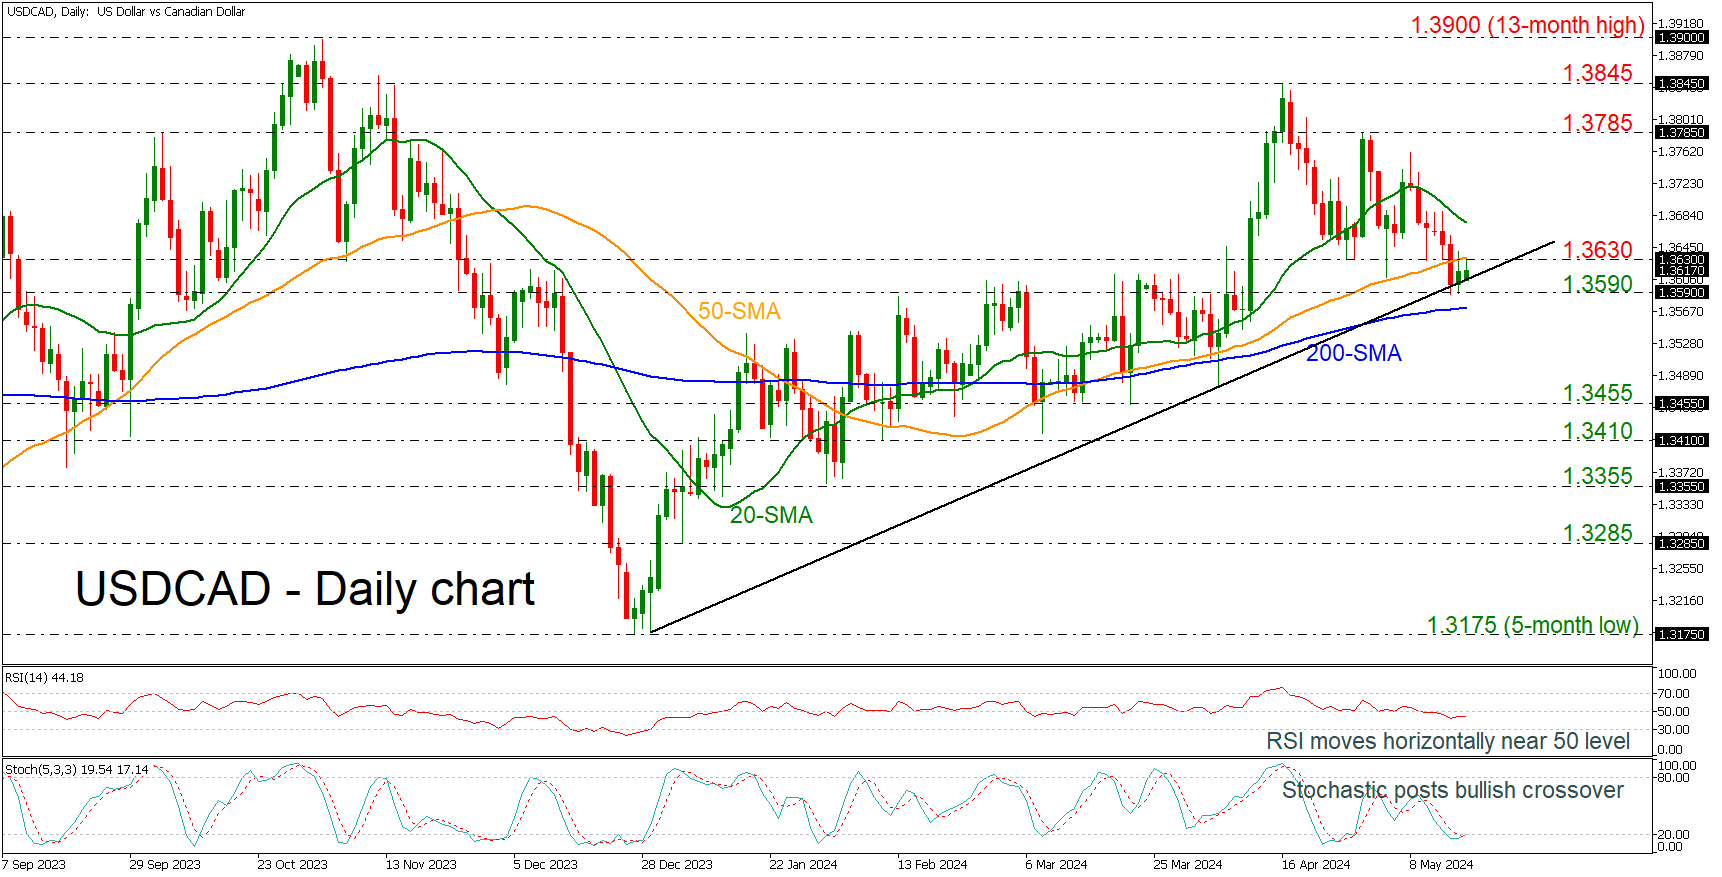
USDCAD has gained little over the last couple of sessions, and it managed to hold above the medium-term ascending trend line and re-enter the 1.3600 area, with the technical oscillators feeding prospects for possible positive short-term trading; the RSI is moving sideways slightly beneath its trigger line, while the stochastic posted a bullish crossover within its %K and %D lines in the oversold area. Yet, the pair is facing strong resistance near the 50-day simple moving average (SMA).
A failure to overcome the 1.3630 barrier could send the price down to 1.3590, a challenging point over the last three months. Lower, support could be next found around 1.3570 where the 200-day SMA is currently positioned, while a decisive close below this line could stage a steeper sell-off.
Alternatively, if 1.3630 proves easy to get through, the spotlight will turn to the 20-day SMA at 1.3675. On top of that, the bulls would need to clear the 1.3785 barricade to push the rally towards the previous peak of 1.3845, the highest level reached since November 14.
In the short-term picture, USDCAD is trying to turn positive after the rebound off the uptrend line. Should the market continue the medium-term upward pattern, the outlook may turn brighter. A run above 1.3845 could switch the outlook to strongly bullish.
AUD/USD and NZD/USD Set Sights on Additional Upside
AUD/USD started a decent increase above the 0.6655 resistance. NZD/USD is also rising and could aim for a move above the 0.6140 resistance.
Important Takeaways for AUD/USD and NZD/USD Analysis Today
- The Aussie Dollar found support at 0.6585 and recovered higher against the US Dollar.
- There is a major bullish trend line forming with support at 0.6670 on the hourly chart of AUD/USD at FXOpen.
- NZD/USD is consolidating gains above the 0.6100 support.
- There is a key bullish trend line forming with support at 0.6100 on the hourly chart of NZD/USD at FXOpen.
AUD/USD Technical Analysis
On the hourly chart of AUD/USD at FXOpen, the pair formed a base above 0.6585. The Aussie Dollar started a decent increase above the 0.6630 resistance against the US Dollar, as mentioned in the previous analysis.
The bulls pushed the pair above the 0.6655 resistance zone. There was a close above the 0.6685 resistance and the 50-hour simple moving average. Finally, the pair tested the 0.6715 zone. A high was formed at 0.6714 before the pair corrected gains.
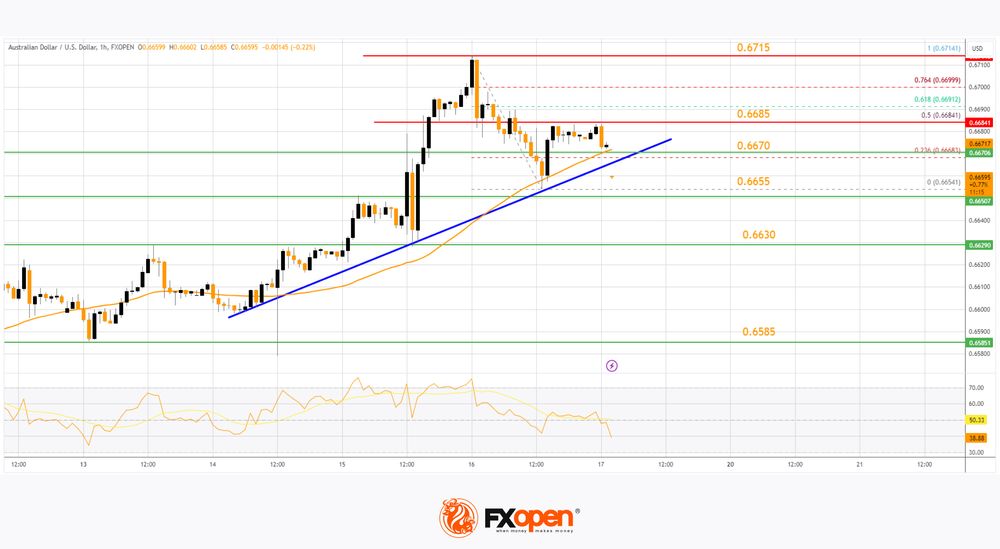
It tested the 0.6655 zone and is currently consolidating gains. There was a fresh increase above the 23.6% Fib retracement level of the downward move from the 0.6714 swing high to the 0.6654 low.
On the upside, the AUD/USD chart indicates that the pair is now facing resistance near the 50% Fib retracement level of the downward move from the 0.6714 swing high to the 0.6654 low at 0.6685. The first major resistance might be 0.6715.
An upside break above the 0.6715 resistance might send the pair further higher. The next major resistance is near the 0.6750 level. Any more gains could clear the path for a move toward the 0.6800 resistance zone.
If not, the pair might correct lower. Immediate support is near a major bullish trend line at 0.6670. The next support could be 0.6655. If there is a downside break below the 0.6655 support, the pair could extend its decline toward the 0.6630 zone. Any more losses might signal a move toward 0.6585.
NZD/USD Technical Analysis
On the hourly chart of NZD/USD on FXOpen, the pair also followed AUD/USD. The New Zealand Dollar formed a base above the 0.6000 level and started a decent increase against the US Dollar.
The pair climbed above the 0.6065 resistance and the 50-hour simple moving average. The pair even spiked above 0.6130. A high was formed near 0.6140 before there was a downside correction. The pair tested the 0.6100 zone before the bulls emerged.
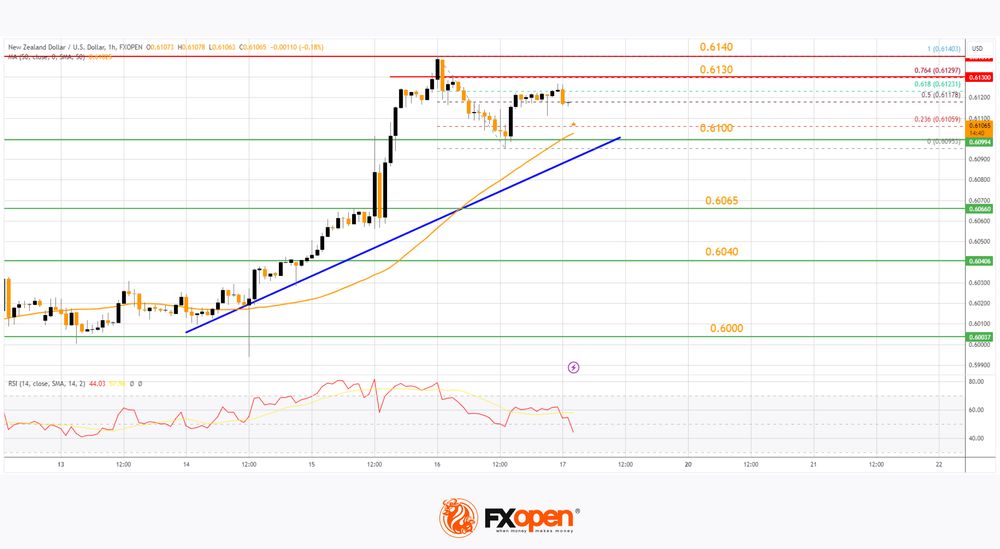
It is again rising above the 50% Fib retracement level of the downward move from the 0.6140 swing high to the 0.6095 low. The NZD/USD chartsuggests that the RSI is correcting lower toward 40.
On the upside, the pair is facing resistance near the 0.6130 zone and the 76.4% Fib retracement level of the downward move from the 0.6140 swing high to the 0.6095 low. The next major resistance is near the 0.6140 level.
A clear move above the 0.6140 level might even push the pair toward the 0.6185 level. Any more gains might clear the path for a move toward the 0.6220 resistance zone in the coming days.
On the downside, there is a support forming near the 50-hour simple moving average and a key bullish trend line at 0.6100. If there is a downside break below the 0.6100 support, the pair might slide toward 0.6065. Any more losses could lead NZD/USD in a bearish zone to 0.6040.
Trade over 50 forex markets 24 hours a day with FXOpen. Take advantage of low commissions, deep liquidity, and spreads from 0.0 pips. Open your FXOpen account now or learn more about trading forex with FXOpen.
This article represents the opinion of the Companies operating under the FXOpen brand only. It is not to be construed as an offer, solicitation, or recommendation with respect to products and services provided by the Companies operating under the FXOpen brand, nor is it to be considered financial advice.
EUR/USD Daily Outlook
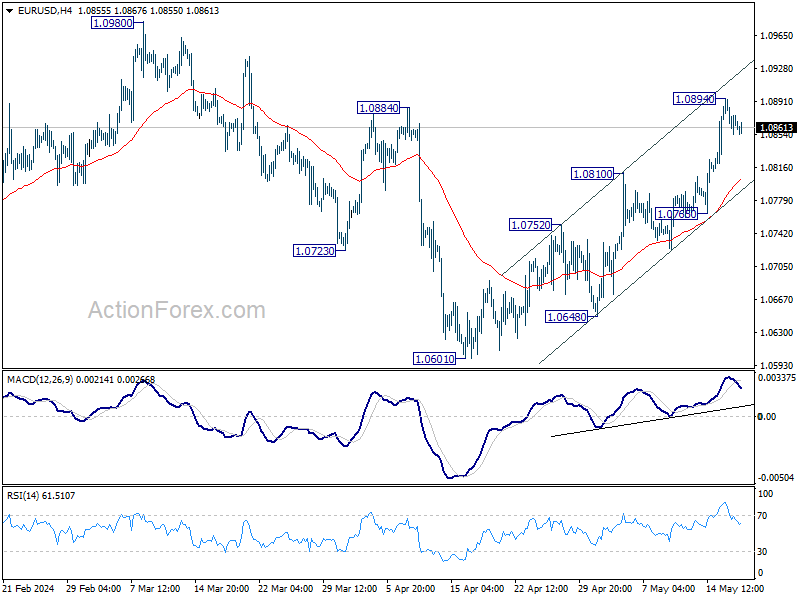
Daily Pivots: (S1) 1.0850; (P) 1.0872; (R1) 1.0890; More...
Intraday bias in EUR/SD is turned neutral with current retreat. Some consolidations would be seen but further rally is expected as long as 1.0765 support holds. Break of 1.0894 will resume the rise from 1.0601 to 1.0980 resistance. Decisive break there will confirm that whole fall from 1.1138 has completed already.
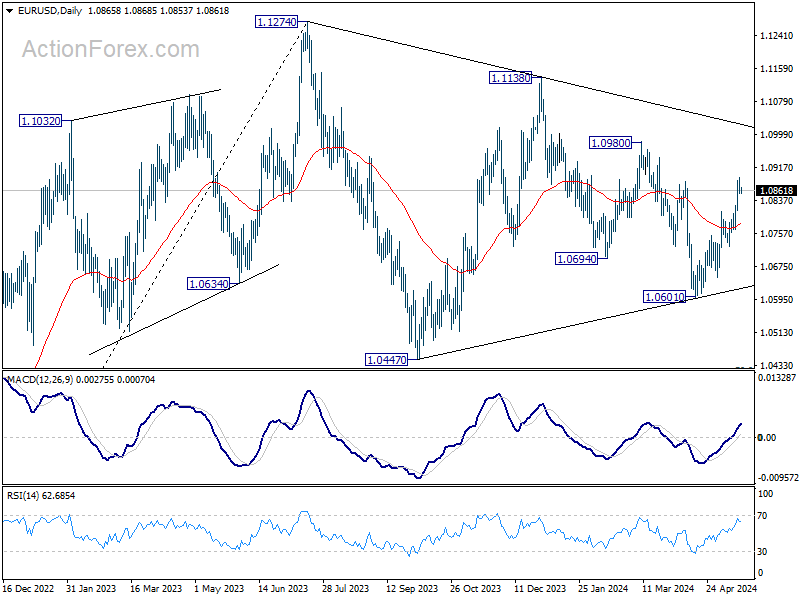
In the bigger picture, price actions from 1.1274 are viewed as a corrective pattern. Fall from 1.1138 is seen as the third leg and could have completed. Firm break of 1.1138 will argue that larger up trend from 0.9534 (2022 low) is ready to resume through 1.1274 high. On the downside, break of 1.0601 will extend the corrective pattern instead.
GBP/USD Daily Outlook
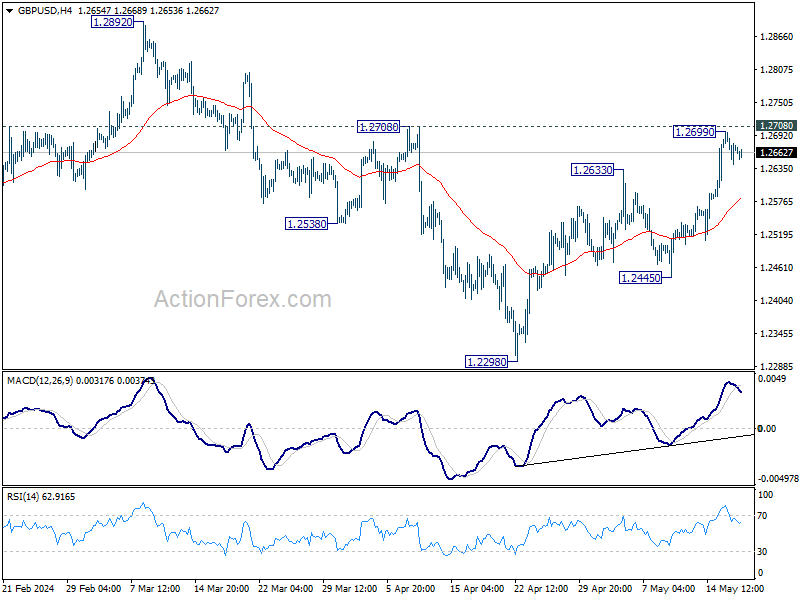
Daily Pivots: (S1) 1.2642; (P) 1.2672; (R1) 1.2699; More...
Intraday bias in GBP/USD is turned neutral with current retreat. Some consolidations would be seen but further rally is expected as long as 1.2445 support holds. Break of 1.2708 resistance will pave the way to 1.2892 resistance next.
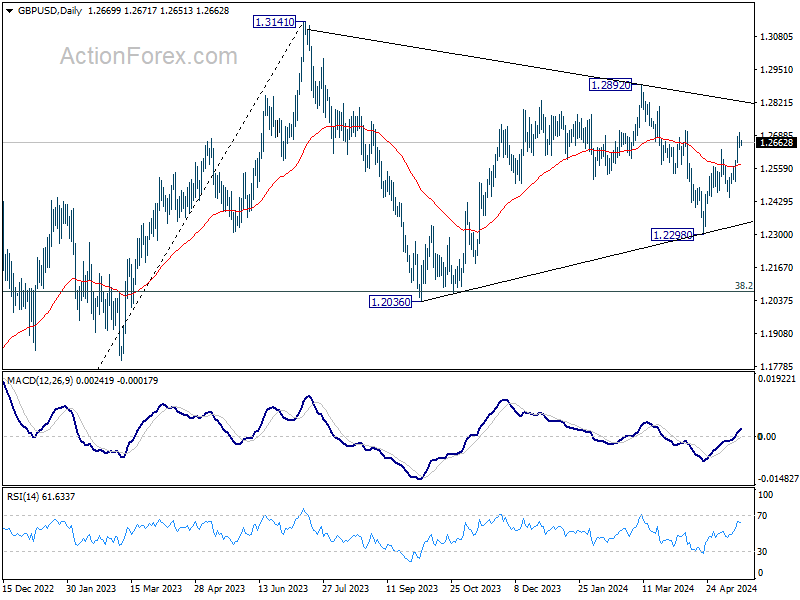
In the bigger picture, price actions from 1.3141 medium term top are seen as a corrective pattern. Fall from 1.2892 is seen as the third leg which might have completed already. Break of 1.2892 resistance will argue that larger up trend from 1.0351(2022 low) is ready to resume through 1.3141. Meanwhile, break of 1.2298 support will extend the corrective pattern instead.
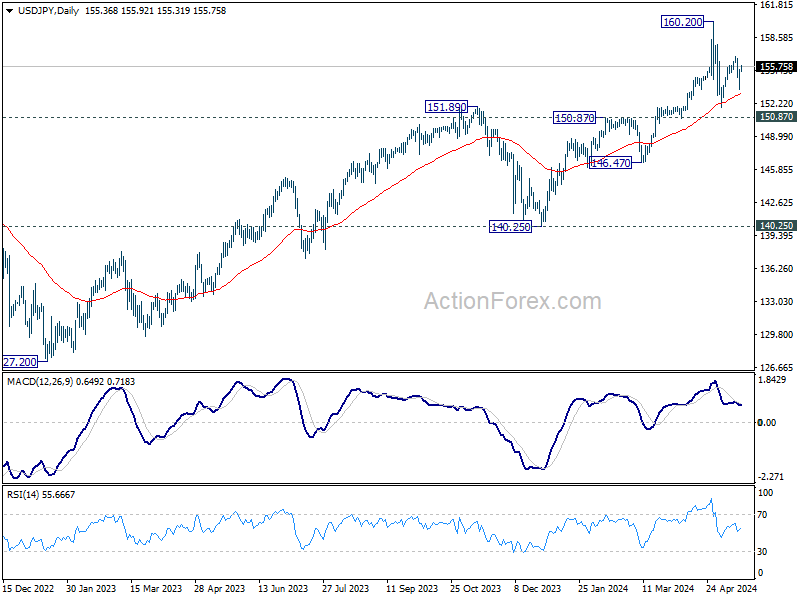
USD/JPY Daily Outlook
Daily Pivots: (S1) 154.15; (P) 154.84; (R1) 156.08; More...
Intraday bias in USD/JPY remains neutral for the moment. Price actions from 160.20 are seen as a corrective pattern. ON the upside break of 156.78 will resume the rise from 151.86, as the second leg, to retest 160.20 high. On the downside, below 153.59 will target 151.86 and below as the third leg.
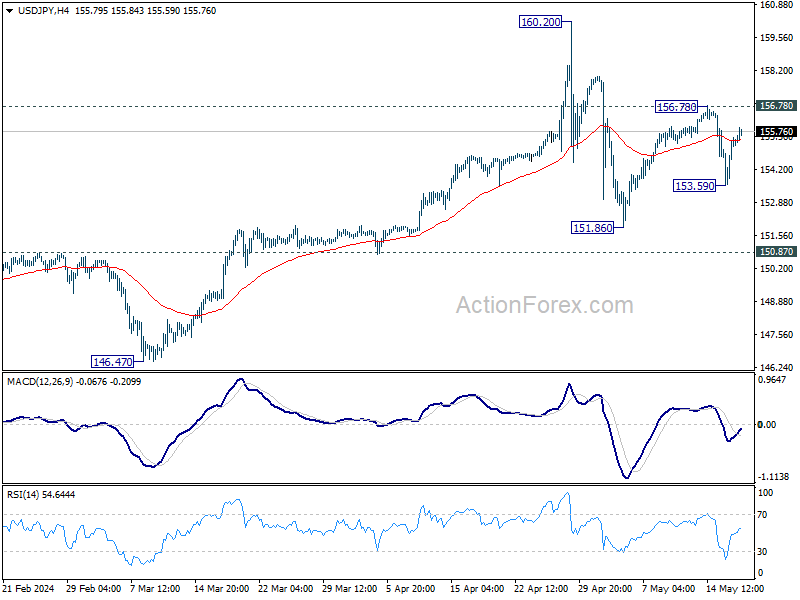
In the bigger picture, a medium term top might be formed at 160.20. But as long as 150.87 resistance turned support holds, fall from there is seen as correcting rise from 150.25 only. However, decisive break of 150.87 will argue that larger correction is possibly underway, and target 146.47 support next.