

Sample Category Title
US Manufacturing Disappoints Again
In focus today
In the euro area, we receive the final euro area inflation data for April. We will especially look out for what drove the still strong service inflation and the measures of domestic inflation as these are key for the monetary policy outlook.
Economic and market news
What happened overnight
In Japan, Kazuo Ueda, Bank of Japan (BoJ) Governor, stated that the central bank has no immediate plan to unload its marked holdings of ETFs, which has garnered increased attention as a potential source of revenue for funding government initiatives. The remarks follow an increasing debate over how the BoJ should manage the legacy of its deflation-ending efforts through extensive money printing, which has left them with a massive balance sheet. However, the central bank has yet to outline a plan for reducing its holdings of ETFs and government bonds, partly due to concerns about destabilizing financial markets.
In China, the monthly batch of data was a mixed bag. Retail sales disappointed falling from 3.1% y/y in March to 2.3% in April (cons: 3.7%). The underlying trend in the level of sales still points to around 5% growth, though. Some consumers may await the trade-in schemes buying new goods for old goods, but it is unclear how much of the scheme is rolled out and how much is in the pipeline since it is up to local governments to implement it. New home prices disappointed as the monthly decline fell to a new cycle low at 0.58% m/m from -0.34% m/m. It broke a trend of smaller declines in previous months. On a more positive note, new home sales continue to show signs of moderate improvement when we look at our own seasonally adjusted series. Sales are hovering around 100 million square metres now after hitting levels below 75 million square metres at the end of 2023. Construction starts also continue to show improvement as social housing projects are increasing. Finally, industrial production surprised to the upside rising from 4.5% y/y to 6.7% y/y (cons: 5.5%). Overall, the data highlights China's continued muddling through scenario that still relies a lot on government stimulus. Markets showed a muted response with off-shore equities actually slightly higher, adding to recent gains. The CNY has also hardly moved.
What happened yesterday
In the US, April industrial production fell slightly below market expectations, printing at 0.0% m/m SA (cons: 0.1%). Unexpectedly, manufacturing output declined in April by -0.3% m/m SA, driven by a decrease in motor vehicle output, while the March figure was revised down to 0.2%. This aligns with the ISM manufacturing PMI released earlier this month. Additionally, capacity utilization for April edged down to 78.4% SA, 1.2 percentage points below its long-run average (1972-2023).
Initial jobless claims fell by 10k to 222k SA (cons: 220k). This follows last week's reading of 232k, an eight-month high, fuelled by a surge in applications in New York state tied to school spring break. In general, labour markets are becoming more balanced, but layoffs remain quite low with little signs of rising.
In Norway, Mainland GDP came in at 0.2% q/q in Q1, as expected, and was hinted at by most leading indicators. Hence, growth is currently stronger than what Norges Bank expected in the Monetary Policy Report from March (0.0%). That said, we still see the case for a significant recovery as limited if rates remain at current levels. Therefore, we expect growth to slow down already in Q2, and capacity utilization to remain at subnormal levels. Additionally, the Q1 figures are heavily influenced by seasonality around Easter, making the figures harder to interpret.
The Q2 Expectations Survey from Norges Bank was very much in line with expectations. Inflation expectations for the 12 months ahead were marginally lower, while wage expectations for this year were a tad higher but in line with the results from the central wage negotiations. Interestingly, employers now expect wage growth of 5.2% in 2024, whereas employees expect 4.8%. Additionally, there were no significant changes to the 2Y and 5Y expectations.
In the equity space, the Dow briefly exceeded the 40,000 mark for the first time, though it concluded yesterday's session somewhat lower. Part of the uptick can be attributed to Walmart, which reported strong Q1 results. Similarly, the S&P 500 and Nasdaq also climbed to intraday highs.
Market movements
FI: There were modest movements in US Treasury bond yields yesterday as the 10Y US yield moved upward a few bp. This morning it has been stable in Asian trading hours. There was more action in the 2Y segment where yields rose almost 10bp. However, the 5% continues to be a top for the 2Y segment and 4.75% for the 10Y segment as the Federal Reserve does not contemplate rate hikes. However, the curve steepener trade continues to struggle when the central banks continue with the"“higher for longer them"”. Instead, we like the carry trades such as being long 30Y 5Y Danish callable mortgage bonds as well as being long EU versus France as EU as an issuer is gradually being seen more as a sovereign rather than a supra.
FX: Yesterday's session was relatively quiet. Much of the post-US CPI movement partially retraced as US yields rose across the curve, led by the front-end. EUR/USD remains in the mid-1.08 to 1.09 range. USD/JPY moved back above 155. The Scandies were the two worst performers in the G10 space, with both EUR/NOK and EUR/SEK trending above 11.60 again. The DKK missed the latest rally in Scandi currencies. Oil prices have stabilized around USD 83-84 per barrel in May.
GBP/JPY Daily Outlook
Daily Pivots: (S1) 195.66; (P) 196.29; (R1) 197.54; More...
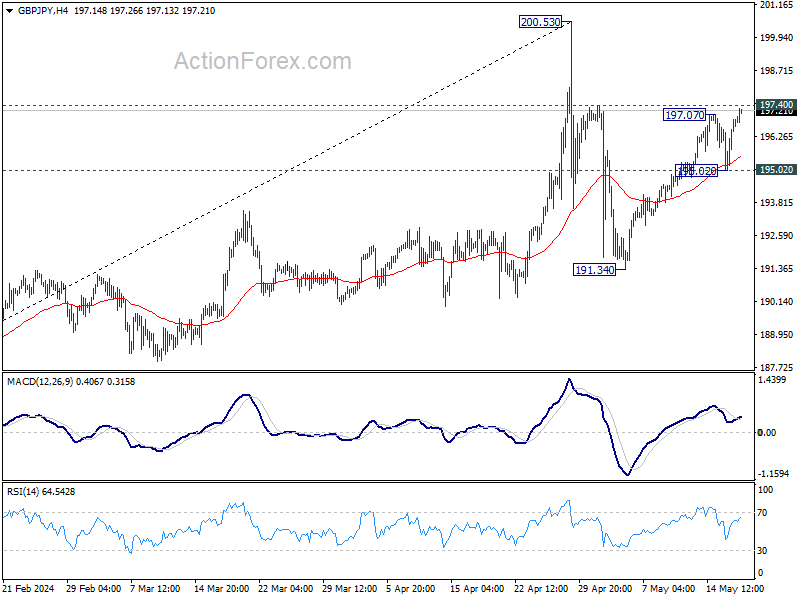
GBP/JPY's rebound from 191.34 resumed after brief recovery and intraday bias is back on the upside. Rise from 191.34 is seen as the second leg of the corrective pattern from 200.53. Sustained break of 197.07 will pave the way to retest 200.53. On the downside, firm break of 195.02 will argue that the third leg has started, and target 191.34 support and possibly below.
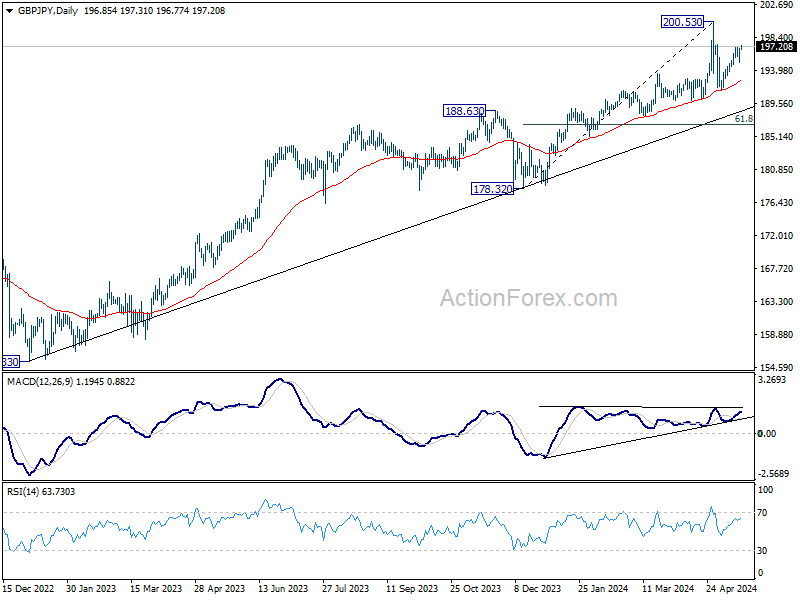
In the bigger picture, a medium term top could be in place at 200.53 after breaching 199.80 long term fibonacci level. As long as 55 W EMA (now at 183.41) holds, fall from there is seen as correcting the rise from 178.32 only. However, sustained break of 55 W EMA will argue that larger scale correction is underway and target 178.32 support.
Selling Pressure Shifts to Yen and Swiss Franc, Dollar Recovers on Fed’s Hawkish Remarks
Yen's selloff resumed after brief recovery yesterday and continued to weaken throughout Asian session. Markets largely ignored comments from former BoJ chief economist Toshitaka Sekine, who suggested the next rate hike could happen as soon as in June. The general understanding is that BoJ will at least wait for Q2 data to confirm if Q1 GDP contraction was merely a temporary setback before making any policy changes. However, downside risk for Yen appears limited, given the likelihood of intervention by Japanese authorities if Yen approaches the critical 160 level against Dollar.
Conversely, Dollar recovering broadly today, supported by hawkish comments from several Fed officials. Overnight, the record run in US stock indexes stalled, with minor decline, while 10-year Treasury yield saw a recovery. Despite encouraging April inflation data, one month of data is insufficient to confirm a sustained disinflation trend. But given recent market reactions, risk would be skewed to the downside for Dollar for the near term.
For the week, Swiss Franc is currently the worst performer, followed by Yen and Dollar. In contrast, New Zealand Dollar leads the pack as the strongest performer, followed by British Pound and Australian Dollar. Euro and Canadian Dollar are positioned in the middle.
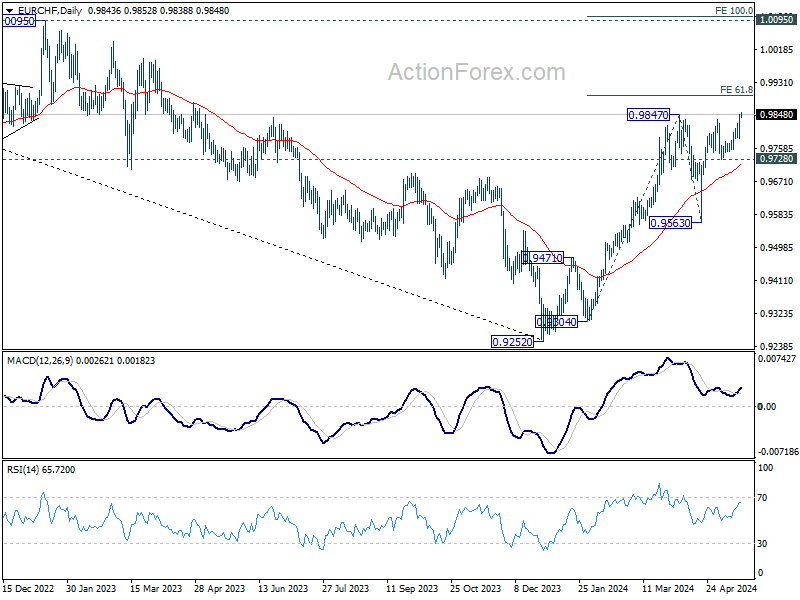
Technically, EUR/CHF's rally from 0.9252 resumed by breaching 0.9847 resistance. Immediate focus is now on 61.8% projection of 0.9304 to 0.9847 from 0.9563 at 0.9899. Decisive break there could prompt upside acceleration to 100% projection at 1.0106, which is slightly above 1.0095 key structural resistance. In case of retreat, outlook will now remain bullish as long as 0.9728 support holds.
In Asia, at the time of writing, Nikkei is down -0.55%. Hong Kong HSI is up 0.20%. China Shanghai SSE is flat. Singapore Strait Times is down -0.34%. Japan 10-year JGB yield is up 0.0225 at 0.949. Overnight, DOW fell -0.10%. S&P 500 fell -0.21%. NASDAQ fell -0.26%. 10-year yield rose 0.021 to 4.377.
Fed's Mester, Bostic, and Barkin signal extended restrictive stance
Some Fed officials have emphasized overnight the need for a extended period of restrictive monetary policy as they seek clearer signs of sustainable inflation reduction.
At an event, Cleveland Fed President Loretta Mester stated that incoming economic data suggests it will "take longer" to gain the confidence needed to start lowering interest rates. Mester emphasized that "holding our restrictive stance for longer is prudent" as Fed seeks clarity on the inflation path.
Atlanta Fed President Raphael Bostic, speaking at another event, acknowledged that the April inflation report provided some important insights, particularly noting a slowed rise in shelter costs. However, he cautioned that "one data point is not a trend," highlighting the importance of watching the May and June data to ensure figures don't reverse.
In a CNBC interview, Richmond Fed President Thomas Barkin reiterated the need for patience, noting that achieving 2% inflation sustainably "is going to take a little bit more time." Barkin pointed out that there is still significant movement on the services side of the economy.
ECB's Schnabel: June rate cut possible, another in July not warranted
In an interview with Nikkei, ECB Executive Board member Isabel Schnabel indicated that a rate cut in June "may be appropriate" based on current data. However, she noted that another cut in July "does not seem warranted." Schnabel emphasized that the outlook beyond June is "much more uncertain," pointing out that the "last mile" of disinflation is the "most difficult."
Schnabel explained that the disinflation process has slowed significantly after most supply-side shocks were reversed, making it a "quite bumpy" global phenomenon. She highlighted that in Eurozone, part of this difficulty is due to base effects and the reversal of fiscal measures.
Importantly, Schnabel underscored that inflation driven by "second-round effects" has become "more persistent." She advocated for a cautious approach, stressing that "after so many years of very high inflation and with inflation risks still being tilted to the upside, a front-loading of the easing process would come with a risk of easing prematurely."
Mixed signals in China's economic data: Industrial production surges, retail sales lag
China's economic data for April revealed a mixed picture, with industrial production rising by 6.7% yoy, surpassing the expected 4.6%.
However, fixed asset investment for the year to date grew by 4.2% yoy, falling short of the anticipated 4.6%. Notably, real estate investment declined significantly, dropping by -9.8% in the first four months of the year.
Retail sales, a critical indicator of consumer spending, increased by only 2.3% yoy, below the forecast of 3.8%.
According to the National Bureau of Statistics , production and demand saw a stable increase, with employment and prices showing overall improvement. The NBS stated that the economy was generally stable, continuing to rebound and progress well.
GBP/JPY Daily Outlook
Daily Pivots: (S1) 195.66; (P) 196.29; (R1) 197.54; More...
GBP/JPY's rebound from 191.34 resumed after brief recovery and intraday bias is back on the upside. Rise from 191.34 is seen as the second leg of the corrective pattern from 200.53. Sustained break of 197.07 will pave the way to retest 200.53. On the downside, firm break of 195.02 will argue that the third leg has started, and target 191.34 support and possibly below.
In the bigger picture, a medium term top could be in place at 200.53 after breaching 199.80 long term fibonacci level. As long as 55 W EMA (now at 183.41) holds, fall from there is seen as correcting the rise from 178.32 only. However, sustained break of 55 W EMA will argue that larger scale correction is underway and target 178.32 support.
Economic Indicators Update
| GMT | Ccy | Events | Actual | Forecast | Previous | Revised |
|---|---|---|---|---|---|---|
| 22:45 | NZD | PPI Input Q/Q Q1 | 0.70% | 0.60% | 0.90% | |
| 22:45 | NZD | PPI Output Q/Q Q1 | 0.90% | 0.50% | 0.70% | |
| 02:00 | CNY | Retail Sales Y/Y Apr | 2.30% | 3.80% | 3.10% | |
| 02:00 | CNY | Industrial Production Y/Y Apr | 6.70% | 4.60% | 4.50% | |
| 02:00 | CNY | Fixed Asset Investment YTD Y/Y Apr | 4.20% | 4.60% | 4.50% | |
| 09:00 | EUR | Eurozone CPI Y/Y Apr F | 2.70% | 2.70% | ||
| 09:00 | EUR | Eurozone CPI Core Y/Y Apr F | 2.40% | 2.40% |
Cliff Notes: Short-Term Risks and Long-Term Opportunity
Key insights from the week that was.
On Budget 2024-25, our bulletin and conversation with Chief Economist Luci Ellis provides a full view of the Government’s fiscal position and economic plan to 2028. In terms of policy initiatives, the focus was split between immediate cost of living relief for households and long-term plans to expand Australia’s productive capacity. While these policies will see spending exceed revenue across the forward estimates, the Federal Government projecting a return to deficits from 2024-25 to 2027-28, it is not a given that inflation risks will increase, with current momentum and the degree of spare capacity at the time the policy initiatives become active to determine the consequence for inflation. This is a topic taken up by Chief Economist Luci Ellis in her weekly essay.
In terms of the week’s data, a below expectations Q1 WPI of 0.8% was constructive, seeing annual wage inflation moderate from 4.2%yr in December to 4.1%yr in March, ahead of the RBA’s expectation (growth or 4.2%yr through mid-2024). Last year’s strength in public wages – associated with new enterprise agreements and changes to wage caps – is cycling out. Private sector wage growth is also moderating, in line with the gradual easing of labour market conditions evident in April's Labour Force Survey.
At 2.8%yr on a three-month average basis, employment growth is slowly tracking towards the more typical 2.0-2.5%yr pace observed pre pandemic. Individuals remain eager to enter and participate in the labour force, but securing a job is becoming more challenging, seeing the unemployment rate edge higher. This trend is expected to continue through the remainder of the year to a quarter-average unemployment rate of 4.3% at year end.
Over in New Zealand, ahead of the RBNZ meeting next week and Budget 2024 at month end, our New Zealand team released their latest quarterly, providing an in-depth assessment of current conditions and the outlook.
Further afield, comments by US FOMC members through the week, including from Chair Powell, reiterated the need for patience and thorough analysis of price risks. Having experienced a strong first quarter of 2024, a number of months of data signalling further progress towards the 2.0% inflation target needs to be seen for the Committee to be comfortable easing.
The price data for April began this journey, the headline CPI printing below expectations at 0.3%, allowing the annual rate to edge down to 3.4%. More importantly, the detail of the release showed inflation is being driven by supply constraints and historic inflation – rents and motor vehicle insurance being the clearest examples. Meanwhile, goods inflation is absent, and discretionary demand driven components such as accommodation away from home and airfares are benign or in retreat.
Notably, annual headline CPI inflation excluding only shelter has been around 2.0% for 12 consecutive months, printing a range between 0.7% and 2.3% and averaging 1.7% over the period. Annual shelter inflation has also decelerated from 8.0% at May 2023 to 5.5% in April 2024. Although the PPI surprised to the upside in April, revisions to March offset; also, the components of PPI used as inputs for PCE inflation, the FOMC’s preferred measure of consumer inflation, were broadly neutral. Taking both the CPI and PPI detail into consideration, April’s PCE result will likely be benign.
US retail sales for April were also constructive for the inflation outlook, headline sales flat in the month and the control group down 0.3%. More importantly, both benchmarks are essentially flat over the first four months of this year, pointing to a stalling out of consumer goods demand. Services demand still has momentum, but its slowing. This sets the scene for a gradual deceleration in GDP growth over the course of 2024 to around trend, our baseline view. Such an outturn will allow the FOMC to begin cutting in September and continue doing so through to mid-2026, albeit to a still mildly-contractionary 3.375%. If the labour market suddenly deteriorates, the FOMC can accelerate or lengthen the cutting cycle; but this is a risk not our baseline view.
Data and policy guidance out of both Europe and the UK were also constructive for the price and activity outlook this week. Both the ECB and BoE look to be on track to cut in June, though the timing and pace of easing thereafter is yet to be determined with growth to pick up and inflation risks to persist. Conversely, the growth outlook for Japan remains challenged. This week, GDP was reported to have contracted in the March quarter by a larger than expected 2.0% annualised. That is the second contraction in three quarters, and there is a clear risk of further weakness given the consumer is financially constrained after a sustained decline in real incomes. The BoJ continues to anticipate an acceleration in consumer demand through mid-year as the latest wage increases take effect and inflation continues to abate. But consumer confidence and the health of small business pose significant risks. Japan is also arguably not in as strong a position as China, Korea and developing Asia to benefit from global growth in investment. While another small increase in Japan’s policy interest rates has to be expected in 2024, the end-point of this tightening cycle is likely within a 0.0-0.5% range versus 1.0% or above. The US dollar and US interest rates are therefore likely to dictate the Yen’s path rather than Japan’s domestic situation.
Finally to China, the April data round again highlighted that authorities are achieving on their objective to increase industrial capacity and, through trade, national income. However, also evident in the disappointing retail sales result is that households are, in aggregate, yet to see material benefit. At the same time, there remains a need for additional policy support for the property sector, which reports this week suggest are under discussion. Chinese growth is set to remain uneven and susceptible to shocks. But authorities’ 5.0% growth guidance for 2024 is certainly achievable; and, looking to the long-term, all the investment being undertaken is developing a strong foundation for a sustainable robust uptrend in national income.
ECB’s Schnabel: June rate cut possible, another in July not warranted
In an interview with Nikkei, ECB Executive Board member Isabel Schnabel indicated that a rate cut in June "may be appropriate" based on current data. However, she noted that another cut in July "does not seem warranted." Schnabel emphasized that the outlook beyond June is "much more uncertain," pointing out that the "last mile" of disinflation is the "most difficult."
Schnabel explained that the disinflation process has slowed significantly after most supply-side shocks were reversed, making it a "quite bumpy" global phenomenon. She highlighted that in Eurozone, part of this difficulty is due to base effects and the reversal of fiscal measures.
Importantly, Schnabel underscored that inflation driven by "second-round effects" has become "more persistent." She advocated for a cautious approach, stressing that "after so many years of very high inflation and with inflation risks still being tilted to the upside, a front-loading of the easing process would come with a risk of easing prematurely."
Mixed signals in China’s economic data: Industrial production surges, retail sales lag
China's economic data for April revealed a mixed picture, with industrial production rising by 6.7% yoy, surpassing the expected 4.6%.
However, fixed asset investment for the year to date grew by 4.2% yoy, falling short of the anticipated 4.6%. Notably, real estate investment declined significantly, dropping by -9.8% in the first four months of the year.
Retail sales, a critical indicator of consumer spending, increased by only 2.3% yoy, below the forecast of 3.8%.
According to the National Bureau of Statistics , production and demand saw a stable increase, with employment and prices showing overall improvement. The NBS stated that the economy was generally stable, continuing to rebound and progress well.
Running a Fine Line, With Scissors
Both the government and RBA are walking a fine line, but some budget decisions might not be as inflationary as they seem at first glance.
Households in Australia are collectively doing it tough. Their cash flows are being squeezed by the high cost of living, high level of interest rates and a rising tax take. Consumption per capita has fallen more than 2½% since the RBA started raising rates. Australia stands out from its peers on this front.
At the same time, inflation is too high and the labour market is tight, though not quite as tight as late last year. The labour force data for April confirmed this gradual easing, helping to cut through the noise of the first three months of the year. And the Wage Price Index release, also this week, shows that wages growth is starting to roll over from its recent peak, as was widely expected. To be fair, these are lagging indicators. But there is nothing in these data – or more leading indicators – pointing to even higher inflation pressures down the track.
The trade-off between a household sector under pressure and ongoing inflationary dynamics is the context the government faced in framing this week’s budget.
Structuring some of the support measures to reduce measured inflation makes sense in that context. The last thing the Government wants is to be blamed for a coming rate rise. Ideally, it would want to see the first couple of rate cuts ahead of the next election. The same imperative drove the reshaping of the Stage 3 tax cuts earlier in the year. Then, the government took care to keep the reduction in revenue within the envelope of the original version, and make sure everyone knew this. Because the original version was already in everyone’s forecasts, the modified version could not then be used to justify tightening monetary policy.
The government is walking that fine line between providing support and services to a household sector under pressure and avoiding adding to that pressure by boosting inflation and possibly interest rates.
Even still, the commentary after the budget has been very focused on the potential inflationary consequences. It is true that a dollar not spent on rent or electricity is a dollar available to be spent on other things. (This of course assumes that electricity companies and landlords do not raise underlying prices to offset some of the subsidy.)
And in principle, if some of that dollar is spent, that represents higher demand that could push up prices elsewhere. There are some unstated assumptions behind this reasoning, though. It assumes that most of the extra spending power is indeed spent, and that there is little spare capacity in the area where it is spent, so the main result is higher prices not a higher quantity sold. In other words, it assumes that the economy will be fully employed later this year when these support measures come into effect.
Furthermore, even though the reduction in measured inflation is temporary and in some sense artificial, households’ experienced cost of living will be genuinely lower as a result. This should, at the margin, help keep inflation expectations anchored, and will moderate the following year’s increases in those prices that are typically indexed to CPI.
The assumptions behind those inflation concerns also underpin current discussion around monetary policy. The presumption is that the problem is that the level of demand exceeds the level of supply, and so policy needs to be restrictive to dampen demand and get it back in line with supply. Again, there are some unstated assumptions here. One of these is that demand is the only thing that can move. It is like seeing a pair of scissors and thinking that only one blade does the work. In fact, the other blade – supply – might still be contending with the ripple effects of the pandemic. Some recovery in supply could play a role in rebalancing itself to demand.
And again, it assumes that a currently fully employed economy will still be fully employed when the time comes to start cutting rates. However, this cannot and should not be presumed.
One lens on this assumption is the economics profession’s own forecasts. Every quarter ahead of its Statement on Monetary Policy, the RBA polls private sector economists about our forecasts and views of the economy. Recently, it has expanded the sample of respondents from around 20 to around 40; aggregated results are compiled into a new
statistical table on its web site. This round, the RBA added the output gap to the list of questions. Importantly, it only sought an estimate for the December quarter 2023, the latest available published data for GDP. The estimates ranged from –1.2% of GDP to +1.0%, with a median of 0.3%. That spread should tell you how uncertain these invisible concepts are. (Full disclosure: my guesstimate in the survey was +0.5%, and it is just a guesstimate.)
But taken together with the estimates of potential output growth (range 1.8% to 3.0%, median 2.5%) and economists’ forecasts for actual GDP growth over 2024 (range 0.2% to 2.3%, median and Westpac 1.6%), we can reasonably conclude that some economic slack is expected by the time the fiscal support and rate cuts occur. It’s a little bit more complicated than that because the potential output estimates were for ‘over the next couple of years’, and potential output growth could be boosted this year because population growth – and so labour supply – will still be stronger than average. (Westpac Economics expects population growth to slow from 2½% last year to 2% this year, normalising to around 1½% over 2025). But the direction is clear.
If we as a profession are to take our own forecasts seriously, the economy will not quite be fully employed by year’s end. Withdrawing some of the restrictive stance of policy at that point – or putting $75 in each household’s pocket each quarter – might not be as inflationary as it would be if done today. There are risks to this strategy, and both the RBA and the government will need to walk a fine line. But neither of them is pursuing the policy equivalent of running with scissors.
USD/JPY: Facing Uphill Battle Amid Market Challenges
Key Highlights
- USD/JPY tested the 153.50 support and recovered losses.
- A key bearish trend line is forming with resistance at 156.00 on the 4-hour chart.
- EUR/USD gained pace for a move above the 1.0800 resistance.
- Bitcoin climbed higher and tested the $66,500 resistance zone.
USD/JPY Technical Analysis
The US Dollar started a sharp decline from the 156.80 region against the Japanese Yen. USD/JPY tested the 153.50 support and recently recovered losses.
Looking at the 4-hour chart, the pair traded as low as 153.58 before it started an upside correction. There was a move above the 154.50 and 154.80 resistance levels. The pair cleared the 50% Fib retracement level of the downward move from the 156.78 swing high to the 153.59 low.
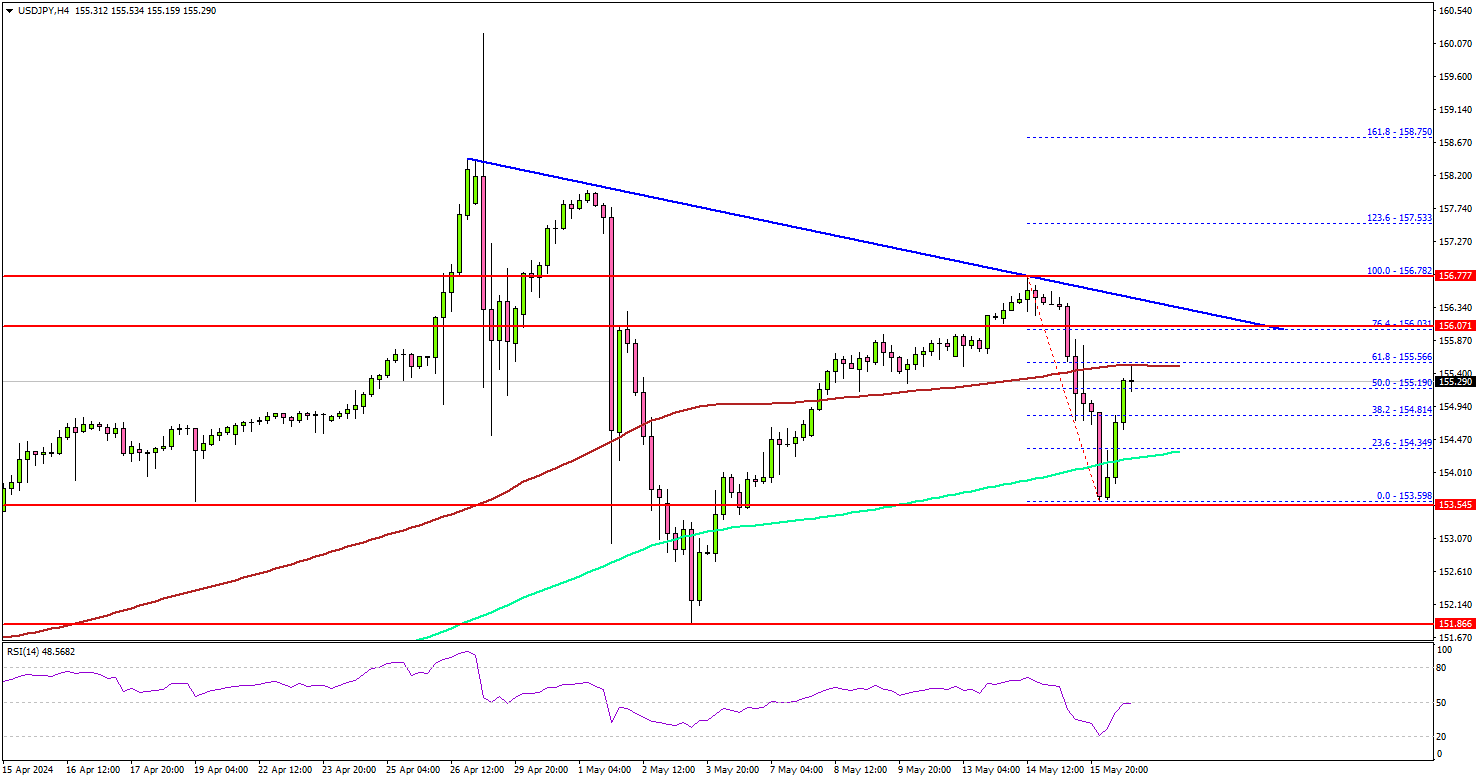
It settled above the 200 simple moving average (green, 4-hour) and tested the 100 simple moving average (red, 4-hour) and tested.
The first major resistance is near 156.00. There is also a key bearish trend line forming with resistance at 156.00 on the same chart. It coincides with the 76.4% Fib retracement level of the downward move from the 156.78 swing high to the 153.59 low.
A clear move above the 156.00 resistance might send it toward the 156.80 level. Any more gains might call for a move toward the 158.00 level in the near term.
Conversely, USD/JPY might start another decline. Immediate support is near the 154.80 level. The first major support is near the 154.35 level. The next major support is at 153.50. If there is a downside break below the 153.50 support, the pair might test 152.00.
Looking at EUR/USD, the pair climbed above the 1.0800 and 1.0850 resistance levels before the bears appeared at 1.0900.
Economic Releases
- Euro Zone CPI for April 2024 (YoY) - Forecast +2.4%, versus +2.4% previous.
- Euro Zone CPI for April 2024 (MoM) - Forecast +0.6%, versus +0.6% previous.
Fed’s Mester, Bostic, and Barkin signal extended restrictive stance
Some Fed officials have emphasized overnight the need for a extended period of restrictive monetary policy as they seek clearer signs of sustainable inflation reduction.
At an event, Cleveland Fed President Loretta Mester stated that incoming economic data suggests it will "take longer" to gain the confidence needed to start lowering interest rates. Mester emphasized that "holding our restrictive stance for longer is prudent" as Fed seeks clarity on the inflation path.
Atlanta Fed President Raphael Bostic, speaking at another event, acknowledged that the April inflation report provided some important insights, particularly noting a slowed rise in shelter costs. However, he cautioned that "one data point is not a trend," highlighting the importance of watching the May and June data to ensure figures don't reverse.
In a CNBC interview, Richmond Fed President Thomas Barkin reiterated the need for patience, noting that achieving 2% inflation sustainably "is going to take a little bit more time." Barkin pointed out that there is still significant movement on the services side of the economy.
Morning Report
Key themes: US equities finished lower, pulling back from a rally that briefly drove the Dow Jones to a record high.
A number of hawkish Fed speakers suggested that the Fed is in no rush to cut interest rates. This saw US bond yields increase. The US dollar also advanced.
The Aussie finished lower. The larger than expected increase in the unemployment rate triggered a sell off which continued in overnight trade.
Share markets: US equities finished lower, pulling back from a rally that briefly drove the Dow Jones over 40,000 for the first time. The Dow Jones closed just under this historic high, closing 0.1% lower.
The S&P 500 closed 0.2% lower, while the tech-heavy Nasdaq slipped 0.3%.
The ASX 200 was 1.7% higher. The higher-than-expected increase in unemployment spurred hopes for rate cuts this year driving the market higher. Financial stocks led the market higher, with ten of eleven sectors finishing in the green.
Interest rates: US bond yields were higher. This was driven by some resilence in the economic data release overnight and hawkish Fed speakers.
The 2-year bond yield increased by 7 basis points to 4.80%. The 10-year treasury yield increased by 4 basis points to 4.38%.
Interest-rate markets continue to price a full rate cut by November. For 2024, the market is pricing in around 45 basis points of cuts – slightly less than two 25-basis-point moves.
Australian yields were also higher. The 3-year government bond yield (futures) was up by 2 basis point to 3.85%. The 10-year government bond yield (futures) was up by 4 basis point to 4.23%.
Foreign exchange: The US dollar advanced ,supported by higher yields. The DXY index fell to a low of 104.08, before receiving yield support and reaching a high of 104.63. The DXY Index is trading at around 104.50.
The Aussie fell sharply following the labour force release and continued to slide in overnight trade, reaching a low of 0.6654. The pair is now trading at around 0.6677.
Commodities: Commodities were generally higher. Copper, oil, coal, and iron ore were higher. Gold was lower.
The West Texas Intermediate (WTI) futures is currently sitting at around US$79.37 per barrel.
Australia: Employment rose by +38.5k (0.3%) in April, stronger than Westpac’s forecast for +20k and the market consensus for +23.7k. This follows a volatile opening quarter, with gains ranging from +11.6k in January, to +118.2k in February and –5.9k in March.
Labour force participation was a little stronger than expected, with the participation rate moving higher from 66.6% in March to 66.7% in April. That implies an appreciable lift in the size of the labour force, up +68.8k. Given the +38.5k lift in employment, that means there was a rise in the number of unemployed persons (+30.3k), which saw the unemployment rate move from 3.9% to 4.1% (4.05% to two decimal places).
The total number of hours worked has been soft over the last year, notwithstanding the increase in the number of people employed. This continued in April, with the number of hours worked remaining unchanged compared with March. In annual terms, hours worked declined by 0.1%. This was the first annual decline since the pandemic (February 2021).
Labour demand has certainly cooled over the past year, but it has only translated into a gradual softening in employment growth. Easing labour demand appeared more clearly in average hours worked over the second half of last year. We continue to anticipate that conditions will gradually soften over the course of this year, as employment growth continues to soften, and the unemployment rate ticks up to a quarter-average of 4.3% by year-end.
Japan: Preliminary data showed economic activity declined 0.5% over the March quarter. This was worse than the decline of 0.3% the market was expecting. Activity over the December quarter 2023 was revised lower, to essentially a flat outcome compared with growth of 0.1% initially estimated. Private consumption fell for the fourth straight quarter in March, as consumers continued to be squeezed by cost-of-living pressures. Capital expenditure also fell due to the reduction of motor vehicle production. Net exports were also a drag on activity, with exports falling by more than imports.
Industrial production in Japan increased by 4.4% month-over-month in March 2024, compared with flash data of a 3.8% rise and after a 0.6% fall in the prior month.
Industrial production increased 4.4% over the month of March, higher than the preliminary estimate of 3.8%. This follows declines of 0.5% in February and 6.7% in January.
United States: Initial jobless claims fell to 222k over the week ending 11 May. This was a higher than the 220k the market was expecting. Continuing claims rose to 1.794m, higher than the 1.780m the market was expecting.
Housing starts rose 5.7% to an annualized rate of 1.36m in April. This was slightly below the 1.42m starts the market was expecting.
Building permits fell by 3% to an annual rate of 1.44m in April. This was the lowest level since December 2022 and below market expectations of 1.48m.
The Philadelphia Fed Manufacturing Index fell to 4.5 index points in May, from 15.5 points in April. This was well below the 8.0 points the market was expecting. The index for new orders and shipments fell sharply. The price indices remain below their long-run averages. 7.8 p (est. 7.8, prior 15.5). Industrial production was flat (est. +0.1%, prior revised from +0.4% to +0.1%). Import prices rose 0.9%m/m and 1.1%y/y (prior 0.6%m/m and 0.4%y/y).
Industrial production was flat in April, following a downwardly revised 0.1% (from 0.4%) increase in March. This was lower than the 0.1% gain expected by the market. Manufacturing output, which makes up around 80% of total production, fell 0.3% over the month of April.
Import prices rose 0.9% in April, accelerating from an upwardly revised 0.6% gain in March. Prices for fuel imports advanced by 2.4%. Export prices rose 0.5% in April, accelerating from the downwardly revised 0.1% increase in March. It was the fourth consecutive increase in export prices, driven by a 0.7% jump in non-agricultural exports.
Several Fed speakers indicated that policy settings were right for the time being, given the economy continues to hold up well and the labour market remains resilient.
Both Loretta Mester (Cleveland Fed President) and John Williams (New York Fed President) believe policy is in a “good place” with Mester stating “incoming economic information indicates that it will take longer to gain that confidence. Holding our restrictive stance for longer is prudent at this point as we gain clarity about the path of inflation.”
Thomas Barkin (Richmond Fed President) said “To get to 2% sustainably in the right kind of way, I just think it’s going to take a little bit more time”.