

Sample Category Title
USD/JPY Daily Outlook
Daily Pivots: (S1) 154.15; (P) 154.84; (R1) 156.08; More...
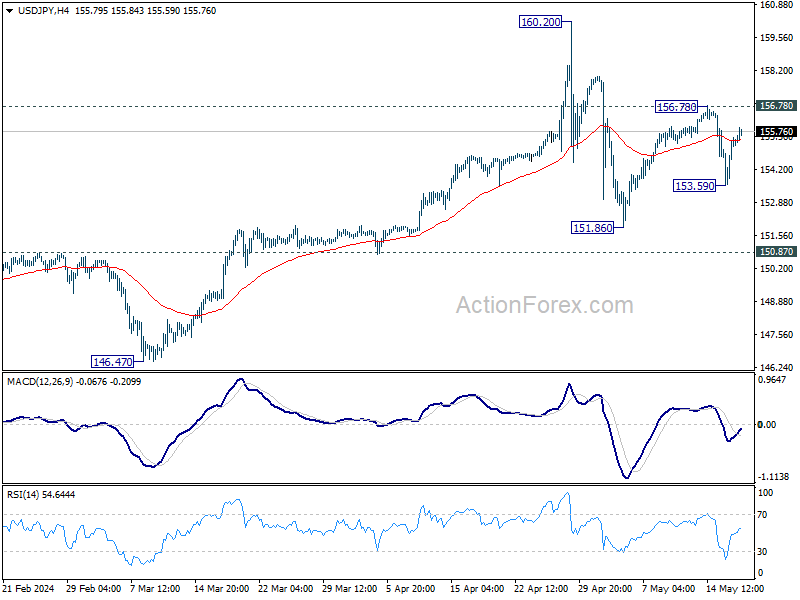
Intraday bias in USD/JPY remains neutral for the moment. Price actions from 160.20 are seen as a corrective pattern. ON the upside break of 156.78 will resume the rise from 151.86, as the second leg, to retest 160.20 high. On the downside, below 153.59 will target 151.86 and below as the third leg.
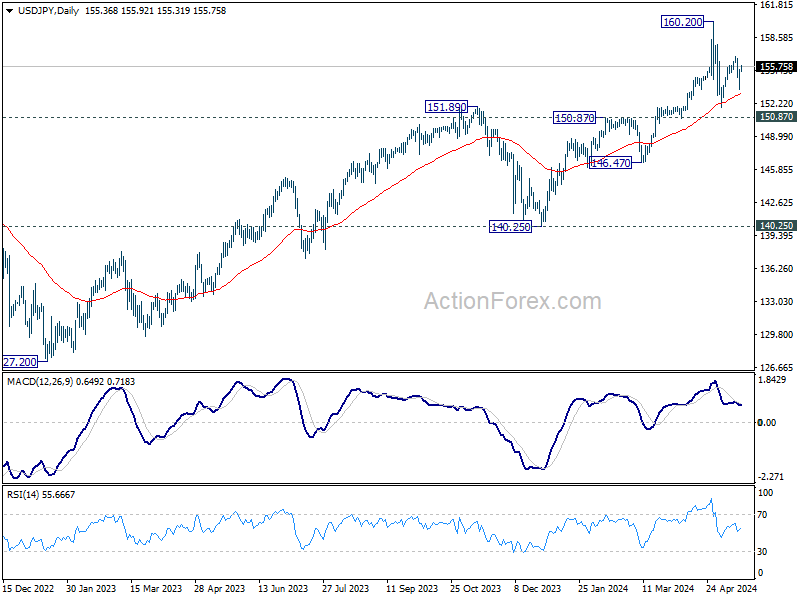
In the bigger picture, a medium term top might be formed at 160.20. But as long as 150.87 resistance turned support holds, fall from there is seen as correcting rise from 150.25 only. However, decisive break of 150.87 will argue that larger correction is possibly underway, and target 146.47 support next.
USD/CHF Daily Outlook
Daily Pivots: (S1) 0.9013; (P) 0.9038; (R1) 0.9088; More....
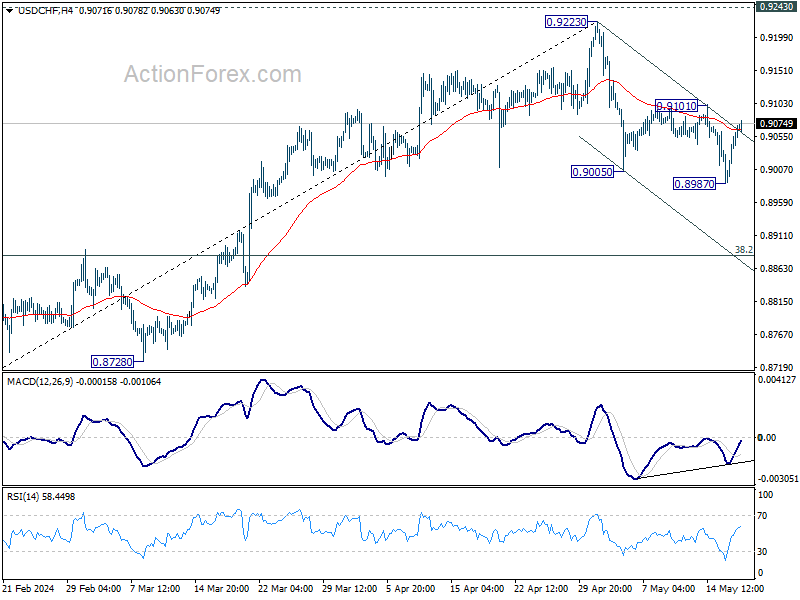
Intraday bias in USD/CHF remains neutral for the moment. Further decline is expected as long as 0.9101 resistance holds. Break of 0.8987 will resume the whole fall from 0.9223 and target 38.2% retracement of 0.8332 to 0.9223 at 0.8883 next. However, break of 0.9101 will turn bias back to the upside for stronger rebound.
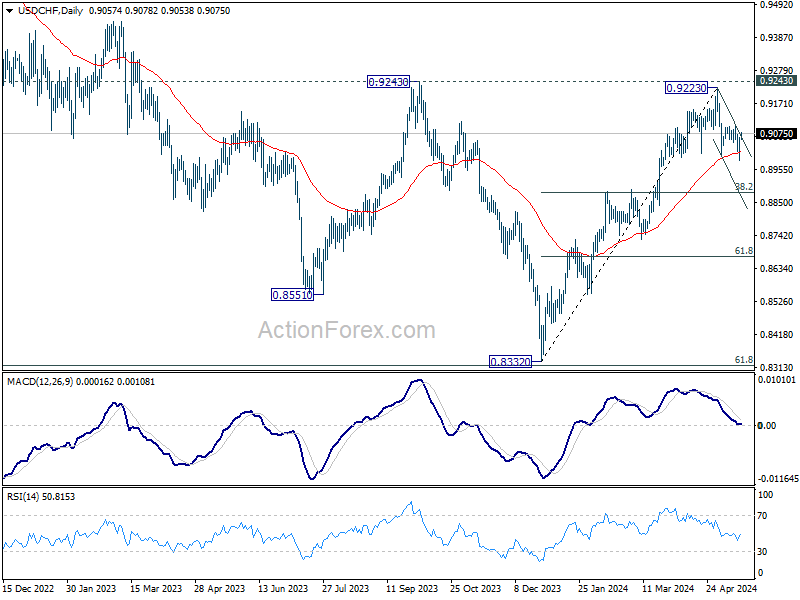
In the bigger picture, price actions from 0.8332 medium term bottom are tentatively seen as developing into a corrective pattern to the down trend from 1.0146 (2022 high). Rejection by 0.9243 resistance, followed by sustained break of 38.2% retracement of 0.8332 to 0.9223 at 0.8883 will strengthen this case, and maintain medium term bearishness. However, decisive break of 0.9243 will argue that the trend has already reversed and turn medium term outlook bullish for 1.0146.
AUD/USD Daily Report
Daily Pivots: (S1) 0.6651; (P) 0.6682; (R1) 0.6711; More...
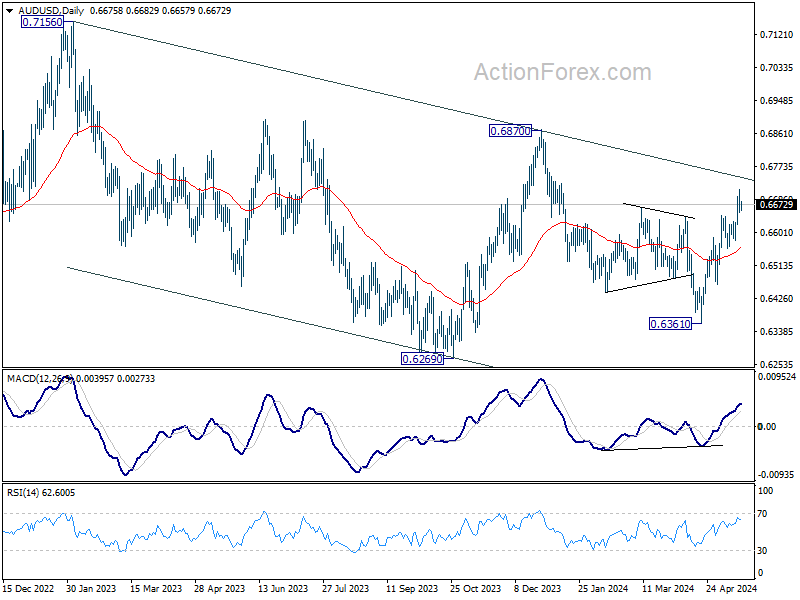
Intraday bias in AUD/USD is turned neutral with current retreat. Some consolidations would be seen below 0.6713 temporary top first. But further rally is expected as long as 0.6578 support holds. As noted before, fall from 0.6870 has probably completed with three waves down to 0.6361 already. Above 0.6713 will target 0.6870 resistance next.
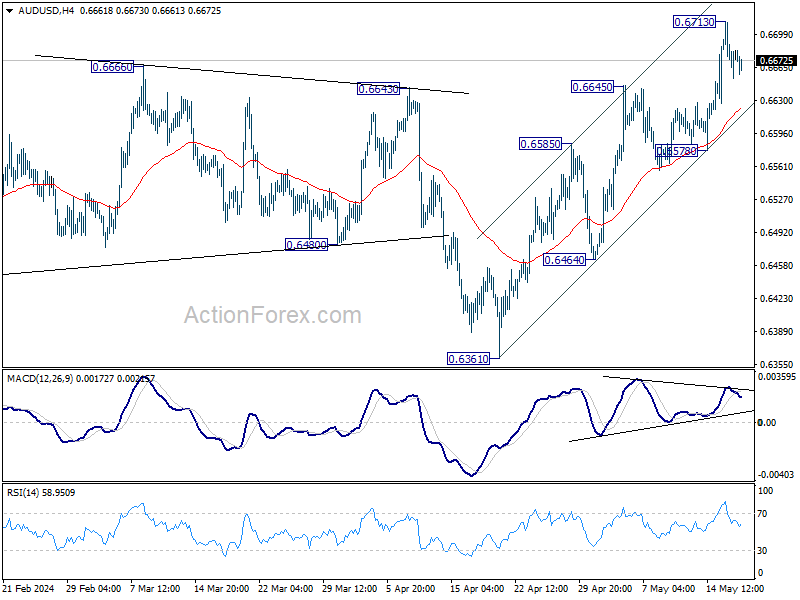
In the bigger picture, price actions from 0.6169 (2022 low) are seen as a medium term corrective pattern to the down trend from 0.8006 (2021 high). Fall from 0.7156 (2023 high) is seen as the second leg, which could have completed at 0.6269 already. Rise from there is seen as the third leg which is now trying to resume through 0.6870 resistance.
USD/CAD Daily Outlook
Daily Pivots: (S1) 1.3592; (P) 1.3616; (R1) 1.3643; More...
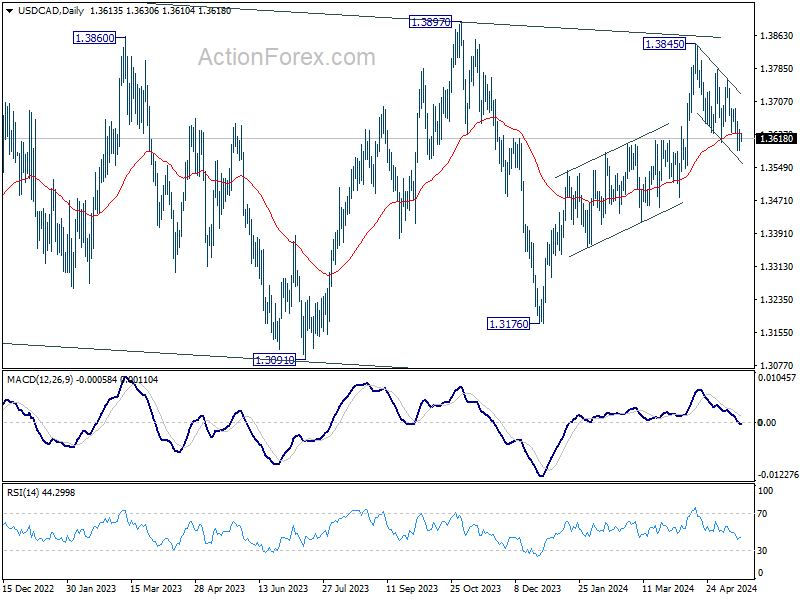
Intraday bias in USD/CAD is turned neutral with current recovery. But further fall is expected as long as 1.3689 resistance holds. Below 1.3589 temporary low will resume the decline from 1.3845 to 100% projection of 1.3845 to 1.3608 from 1.3761 at 1.3524. Sustained trading below 55 D EMA (now at 1.3631) will argue that whole rise from 1.3176 has completed already.
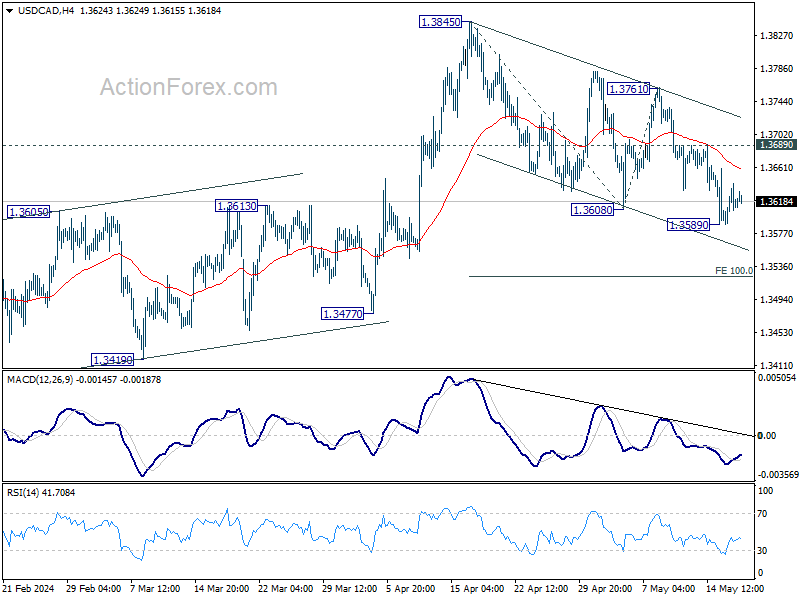
In the bigger picture, price actions from 1.3976 (2022 high) are viewed as a corrective pattern. In case of another fall, strong support should emerge above 1.2947 resistance turned support to bring rebound. Firm break of 1.3976 will confirm up resumption of whole up trend from 1.2005 (2021 low). Next target is 61.8% projection of 1.2401 to 1.3976 from 1.3176 at 1.4149.
EUR/CHF Daily Outlook
Daily Pivots: (S1) 0.9806; (P) 0.9827; (R1) 0.9869; More....
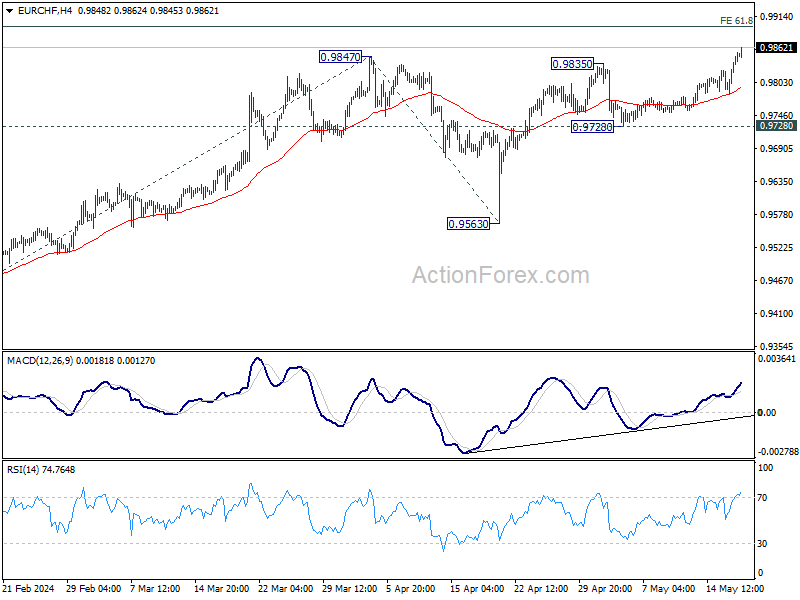
EUR/CHF's rally from 0.9252 resumed by breaking through 0.9847 resistance. Intraday bias is back on the upside for 61.8% projection of 0.9304 to 0.9847 from 0.9563 at 0.9899. Decisive break there could prompt upside acceleration to 100% projection at 1.0106, which is slightly above 1.0095 key structural resistance. In case of retreat, outlook will now remain bullish as long as 0.9728 support holds.
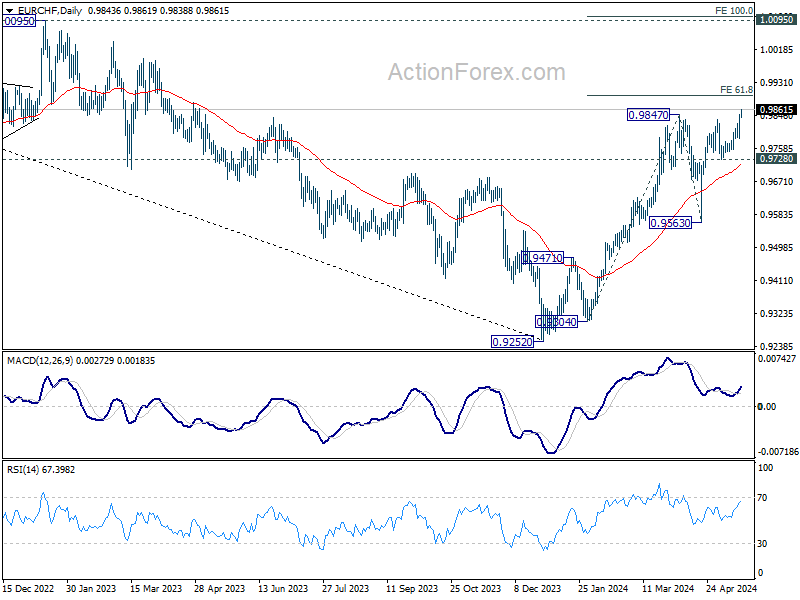
In the bigger picture, as long as 0.9563 support holds, rise from 0.9252 medium term bottom is still in favor to continue. Break of 0.9847 resistance will target 38.2% retracement of 1.2004 (2018 high) to 0.9252 (2023 low) at 1.0303, even as a correction to the down trend from 1.2004.
EUR/GBP Daily Outlook
Daily Pivots: (S1) 0.8572; (P) 0.8580; (R1) 0.8585; More...
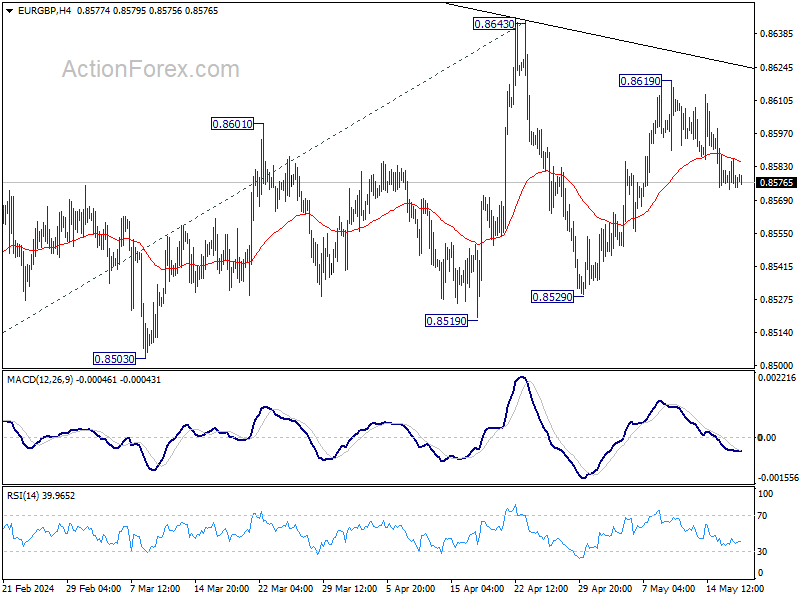
Intraday bias in EUR/GBP remains on the downside at this point. Further fall should be seen to 0.8529 support. Decisive break there will argue that larger down trend is ready to resume. For now, risk will stay on the downside as long as 0.8619 resistance holds, in case of recovery.
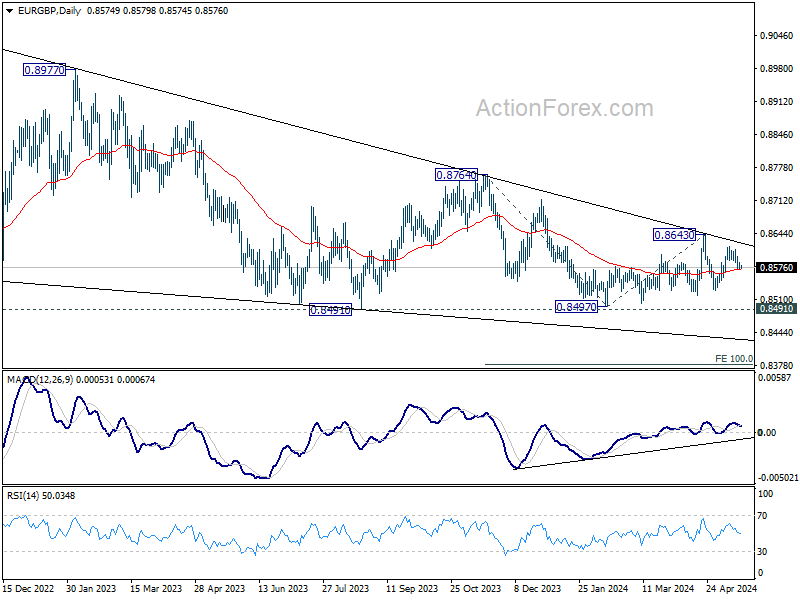
In the bigger picture, outlook remains bearish as EUR/GBP is capped below medium term falling trendline. That is, down trend from 0.9267 (2022 high) is still in progress. Firm break of 0.8491/7 will target 100% projection of 0.8764 to 0.8497 from 0.8643 at 0.8376.
EUR/AUD Daily Outlook
Daily Pivots: (S1) 1.6225; (P) 1.6270; (R1) 1.6318; More...
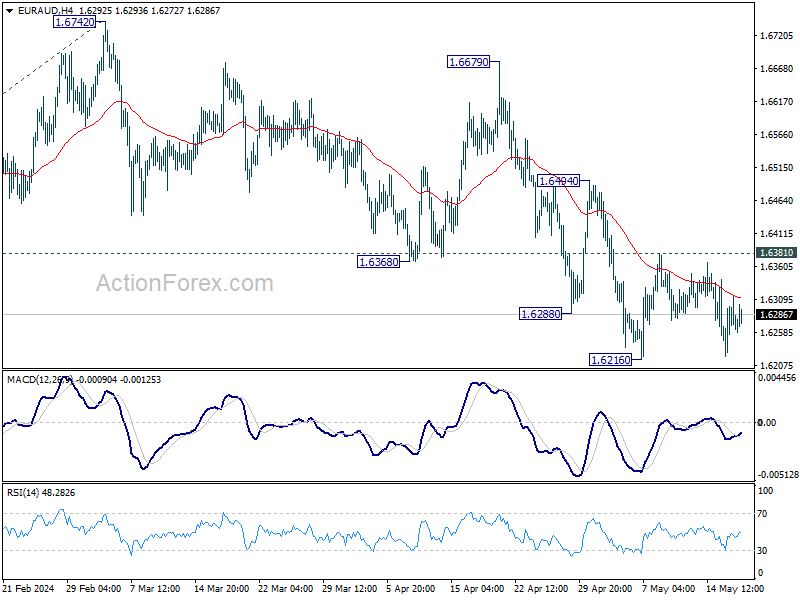
Intraday bias in EUR/AUD remains neutral as range trading continues above 1.6216. Further decline is expected with 1.6381 resistance intact. Fall from 1.6742 is seen as the third leg of the corrective pattern from 1.7062. Break of 1.6216 will turn bias back to the downside to 1.6127 support, or further to 100% projection of 1.7062 to 1.6127 from 1.6742 at 1.5807.
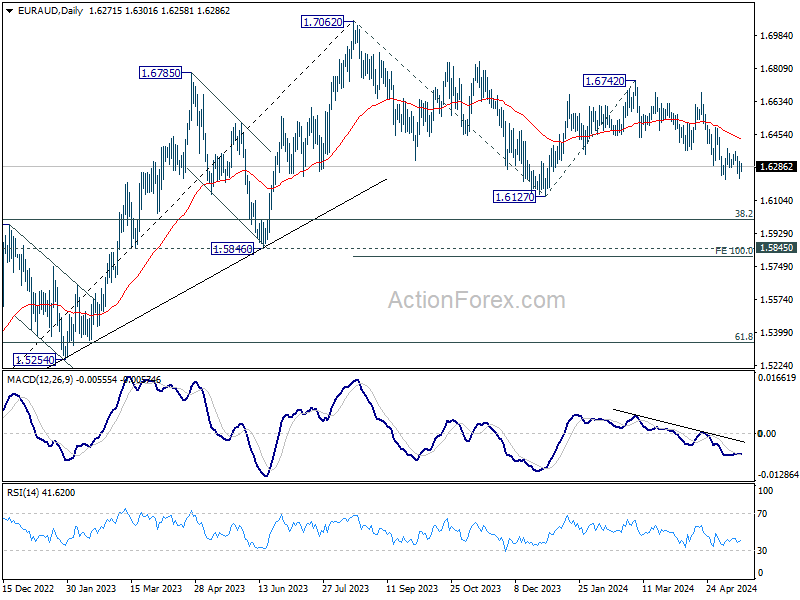
In the bigger picture, fall from 1.7062 medium term top is seen as a correction to the up trend from 1.4281 (2022 low). In case of deeper fall, strong support is expected around 1.5846 and 38.2% retracement of 1.4281 to 1.7062 at 1.6000 to bring rebound. Break of 1.7062 is in favor as a later stage.
EUR/JPY Daily Outlook
Daily Pivots: (S1) 167.83; (P) 168.37; (R1) 169.41; More...
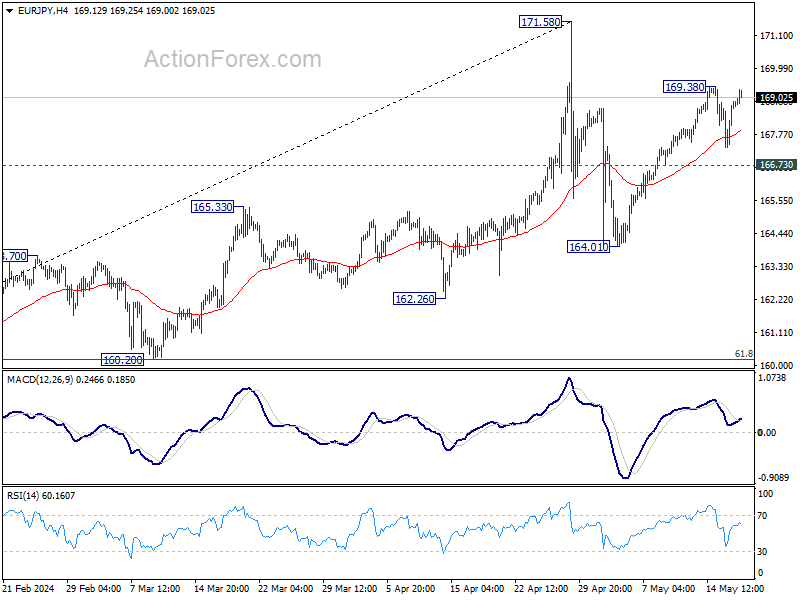
Intraday bias in EUR/JPY remains neutral at this point. On the upside, break of 169.38 will resume the rebound from 162.26. As the second leg of the corrective pattern from 171.58, this rise should target 171.58 next. On the downside, break of 166.73 support will argue that corrective pattern from 171.58 has started the third leg. Deeper fall would then be seen back to 164.01 support and below.
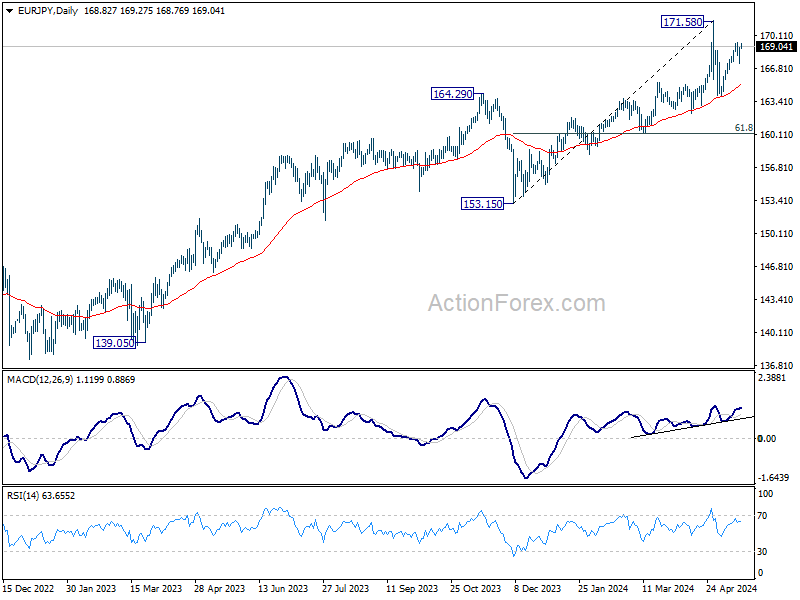
In the bigger picture, a medium top could be formed at 171.58 after brief breach of 169.96 (2008 high). As long as 55 W EMA (now at 157.89) holds, fall from there is seen as correcting the rise from 153.15 only. However, sustained break of 55 W EMA will argue that larger scale correction is underway and target 153.15 support.
Chinese Data Showed a Mixed, Rather Unconvincing Picture
Markets
Triggered by Fed chair Powell ruling out a hike, then reinforced by sub-consensus payrolls & ISM’s and by an in-line easing of CPI earlier this week, the US Treasury rally grinded to a halt yesterday. That happened despite a slew of (secondary) US data disappointing to the downside (jobless claims, housing data, IP and others). Given how a similar setting a day earlier triggered further UST gains, it suggests the correction lower may have run its course for now. Front end US yields took the lead. Markets on Wednesday fully priced in a rate cut in September and are unwilling to move this even closer in time. Focus is instead gradually shifting to what to expect in 2025 (currently three cuts priced in, following two this year) as the dominant driver of the front. The US 2-yr yield tested support between the May (post-payrolls) low of 4.70% and the 38.2% retracement on the 2024 upleg (4.689%) before rebounding throughout the session towards 4.8%. Longer maturities added between 1.2 and 3.5 bps with the 10-yr seeking to hold above 4.35-4.37% support. German Bunds outperformed. Yields rose 3.2-4.3 bps across the curve. Together with some fatigue hitting the stock markets (after hitting new intraday record highs in the US), the dollar bottomed as well. EUR/USD returned from 1.0884 to 1.0867.DXY recovered from the 104.08 low point to 104.46 in the close. Fed speak included Barkin, Mester and Bostic striking a cautious tone on inflation despite the “welcome tick down” (Mester) in the monthly CPI figures. They argue for patience with services and shelter still being inflationary. Bostic did add that it could be appropriate to reduce rates toward year end.
Apart from China’s monthly economic update (see below), there’s little to inspire markets today. The country also did its inaugural special bond sale to kickstart the economy/property market. We look out in core/US markets whether the aforementioned key technical levels in yields will hold into the weekly close. If they do, the dollar could show additional signs of bottoming out, especially if stock markets take some chips of the table ahead of the weekend. EUR/USD’s first meaningful support is located around the 1.08 big figure (1.0793, 50% USD recovery on the 2023Q4 decline).
News & Views
Chinese data published this morning showed a mixed, rather unconvincing picture on the country’s economic recovery. On the positive side, April industrial production accelerated to 6.7% Y/Y from 4.5%, better than the 5.5% expected (YtD growth 6.3%). The rise, amongst others, was driven by chip production and autos which suggests some positive impetus from foreign demand. However, more worrisome for the domestic growth story was another dismal performance of retail sales. Housing/property related data also showed ongoing weakness. Retail sales growth slowed more than expected from 3.1% Y/Y to 2.3% (vs 3.7% expected). Fixed asset investment growth (YTD Y/Y) also slowed from 4.5% Y/Y to 4.2% while a small further gain was expected. Property investment remains under pressure (-9.8% YTD) with residential property sales even slumping 31.1% YTD (from 30.7%). The data today confirm the picture of an very uneven recovery of the Chinese economy with especially the need to address factors that are weighing on domestic confidence/demand. In this respect China this morning successfully sold a first tranche of the special sovereign bonds program (CNY 40 bln) with a bid-cover ratio of 3.91. The funds of the program will be used to support infrastructure spending.
As the BOJ policy is entering a new phase, recently a debate is developing on how the BOJ should handle the big asset portfolio, including its holdings of exchange traded funds (ETF’s). The BOJ holds a portfolio of about 37 trillion yen of ETF’s which has an important latent profit. Unwinding portfolio in a broader policy normalization move, could realize a revenue that might be used to support spending when it would be returned to the government. However, on this topic, governor Ueda today indicated that the BOJ is in no rush to sell risky assets anytime soon. BOJ caution on selling assets amongst others is inspired by considerations that it might unsettle markets that are affected by the sales.
Graphs
GE 10y yield
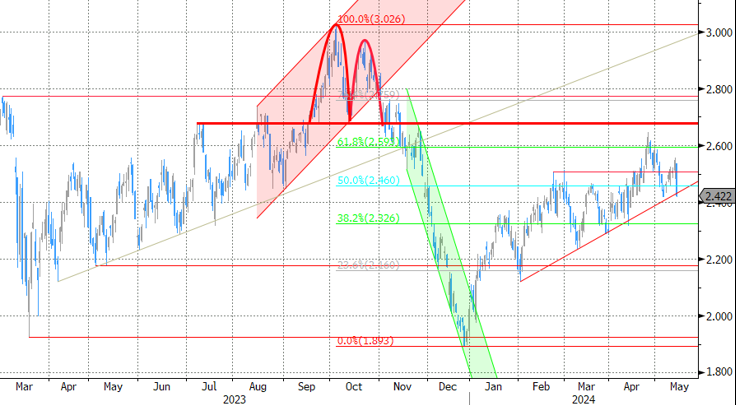
ECB President Lagarde clearly hinted at a summer (June) rate cut which has broad backing. EMU disinflation continued in April and brought headline CPI closer to the 2% target. Together with weak growth momentum, this gives backing to deliver a first 25 bps rate cut. A more bumpy inflation path in H2 2024 and the Fed’s higher for longer strategy make follow-up moves difficult. Markets have come to terms with that.
US 10y yield
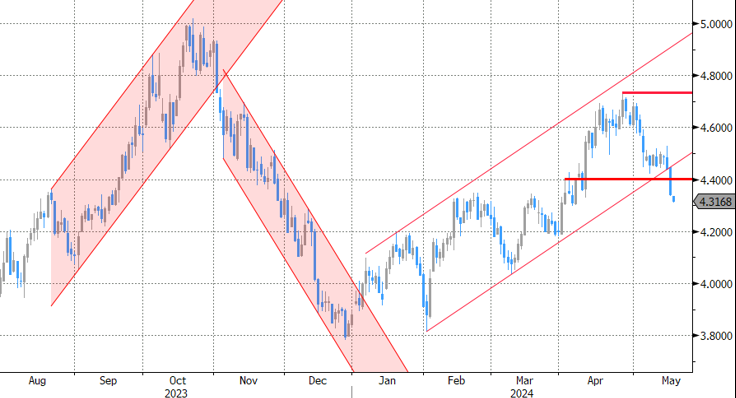
The Fed in May acknowledged the lack of progress towards the 2% inflation objective, but Fed’s Powell left the door open for rate cuts later this year. Soft US ISM’s and weaker than expected payrolls supported markets’ hope on a first cut post summer, triggering a correction off YTD peak levels. Sticky inflation suggests any rate cut will be a tough balancing act. 4.37% (38% retracement Dec/April) already might prove strong support for the US 10-y yield.
EUR/USD
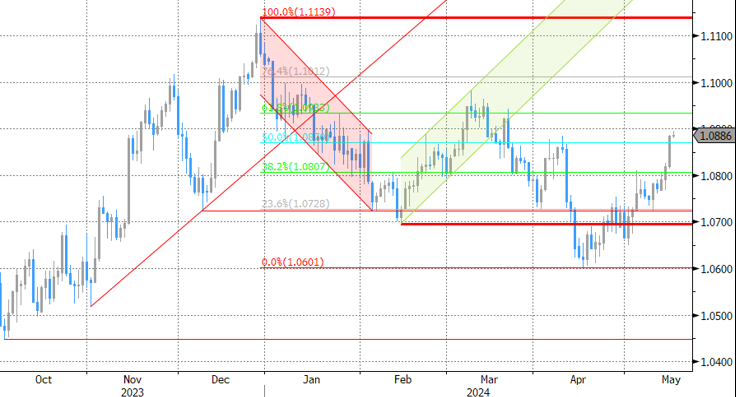
Economic divergence, a likely desynchronized rate cut cycle with the ECB exceptionally taking the lead and higher than expected US CPI data pushed EUR/USD to the 1.06 area. From there, better EMU data gave the euro some breathing space. The dollar lost further momentum on softer than expected early May US data. Some further consolidation in the 1.07/1.09 are might be on the cards short-term.
EUR/GBP
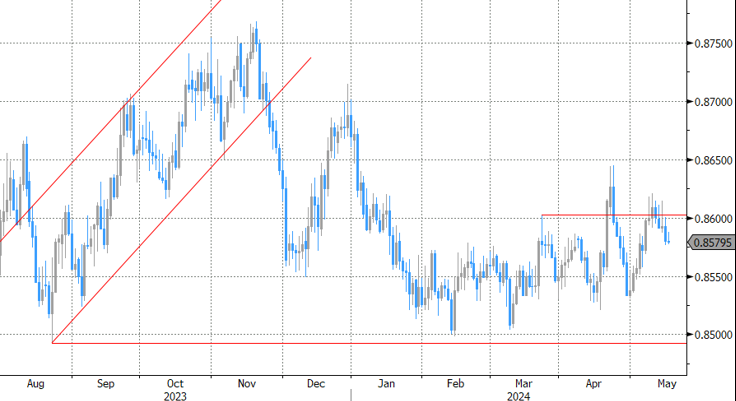
Debate at the Bank of England is focused at the timing of rate cuts. Most BoE members align with the ECB rather than with Fed view, suggesting that the disinflation process provides a window of opportunity to make policy less restrictive (in the near term). Sterling’s downside turned more vulnerable with the topside of the sideways EUR/GBP 0.8493 - 0.8768 trading range serving as the first real technical reference.
The Elephant in the Room
All major US indices advanced to fresh ATH yesterday; the S&P500 and Nasdaq 100 traded at the uncharted territory, while the Dow Jones Industrial index hit the 40’000 mark for the first time – sparking the good, old discussions about ‘how long did it take the Dow Jones to walk the last 10’000 points’. It took the index only 872 trading days to gain 10’000 points – the Federal Reserve’s (Fed) aggressive policy tightening didn’t have a long-lasting effect: that’s the major takeaway for the future.
But anyway, all three indices ended yesterday’s session slightly lower than when they started – despite hitting a record during the session. Fed members insisted that the Fed’s rate policy is in a good place right now, and that it will probably take longer for inflation to slow to the 2% target.
The elephant in the room
And it will probably take US inflation some more time to go back to the 2% unless there is a severe economic meltdown. Note that one of the major risks to global inflation – the Chinese recovery – is probably getting underway this year. The Chinese growth will mostly be driven by a robust government support to industrial production rather than improved consumer-based demand, but it doesn’t really matter who drives growth for the prices of global commodities. In the past, the Chinese growth model relied on government-fueled industrial growth. And Xi Jinping wanted this model to shift toward a consumer-based growth, but his less-than-subtle tactics hammered consumer confidence and obliged him to go back to the good, old growth tactics. So, it’s no surprise that China revealed a better-than-expected industrial production in April despite slower retail sales and a bigger fall in house prices. But hey, China will also be buying houses at distressed prices to slow down the meltdown in its property market. Consequently, China will go back to growth and that’s not great news for global inflation.
Indeed, copper futures are up by 40% since the February dip, iron ore recovered more than 24% since April dip and is now consolidating in the bullish consolidation zone, and even the nat gas prices are up by more than 40% since the beginning of the month. Crude prices, on the other hand, have been falling since April but are still up by 9% since the beginning of the year. And more importantly, all these commodity prices are supported by the perspective of interest rate cuts from the major central banks starting from June in Europe… and the Chinese demand will only make the upside pressure worst.
Regardless
But regardless, the bulls remain in charge of the Western market: earnings season has been robust so far and the earnings forecasts for the US companies are rising at the highest speed in two years. In this context, Walmart was the latest big name to announce earnings yesterday, and the earnings announcement went well. The revenue growth exceeded the company’s own forecast, its CFO said that ‘many consumer pocketbooks are still stretched’. The latter could’ve been bad news for the Fed doves who need the US consumer spending to slow, to temper inflation. But don’t worry, because Walmart shoppers are spending more of their paychecks on essential items and less on general merchandise, and that more than half of checkouts contained at least one of its private brand – where 70% of the items are priced under $5. Moreover, the biggest growth comes from upper income levels, who also visit the Walmart shops more frequently because it costs less. So Walmart shares jumped 7% to an ATH yesterday, but Walmart’s success was seen as another hint that the US consumers come under a rising pressure of higher prices, and that’s a positive for the Fed doves, along with disappointing quarterly results from both Home Depot and Deere and Co.
And as per the Fed policy, despite the Fed members’ cautious approach, the Fed said earlier this month that its next move is probably not a rate hike, and data this week showed stagnating retail sales, gloomy housing markets, a weak Philly Fed manufacturing index, weak industrial production data, an initial jobless claims number above 200’000 and above all, a weaker-than-expected core CPI figure. So all in all, this week is set to end on a more dovish note compared than when it started although I insist that inflation is nowhere close to the levels where the Fed could reasonably and publicly hint at an upcoming rate cut.
The USD index rebounded from the 100-DMA yesterday, and is back above the 200-DMA and the 38.2% Fibonacci retracement that distinguishes between the continuation of the ytd positive trend and a bearish reversal. If the index doesn’t fall sustainably below this major Fibonacci level, the buying pressure on the major peers will remain limited, as I think should be the case given the clear divergence between a cautious Fed and well-determined European Central Bank (ECB) to cut rates for example. In this context, the EURUSD is back to its bearish ytd trend after having spent a few days above the major 38.2% Fibonacci retracement of its own (near the 1.08 level). The USDCHF holds ground near the 50-DMA and the USDJPY is back above 155, and remains bid after the Bank of Japan (BoJ) decided not to follow up with lower bond buying as they did earlier this week and the Governor Ueda said that they have no plans to sell the ETF holdings in the close future.