Sample Category Title
Silver and Gold Recovered Quickly. What’s Next?
Gold and silver have been enjoying a return to demand since early May, and buyers have stepped up in the last couple of days, bringing gold back above $2370 and silver back above $28.5.
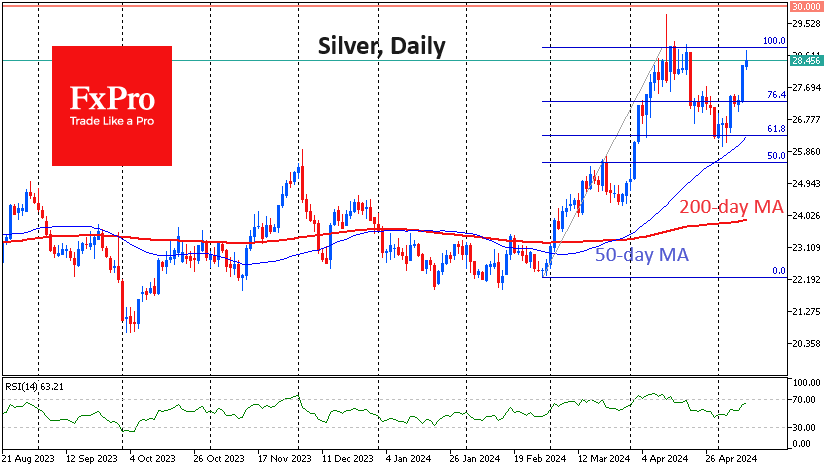
Silver has recovered to the $28.0-28.8 area from where it reversed down in April after a few days of consolidation. This week’s upward momentum revives the idea that the decline in the second half of April was a corrective pullback. The area of local lows in early May roughly coincides with the 61.8% pullback from the upside momentum from late February to the upper boundary of the consolidation area we discussed above.
This bullish scenario will be confirmed if the price consolidates above $28.8, which would open the way to the $33 area as a potential first stop. However, we need to remember that Silver has failed to do so for the past 11 years, with three significant episodes in 2020 and 2021 before the April test.
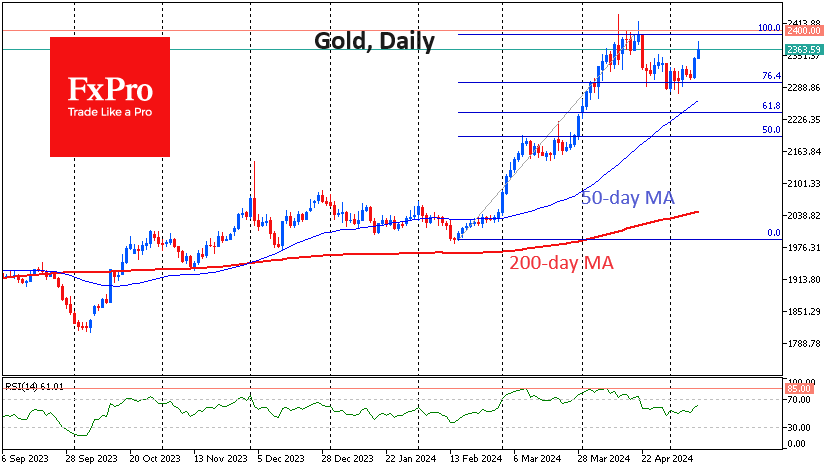
Gold is about half as far behind silver in terms of relative recovery momentum and has not yet been able to recoup all the losses from the 22 April price hit. However, we should consider that gold quotes have been periodically updating historical highs since February.
In gold, we can also consider the April retreat as a correction to the area of 76.4% of the growth impulse from the minimum close of the day in February to the maximum close in April. In this case, the growth target becomes the area of $2640 (161.8% of the initial rally).
At the same time, a further rise in the price of gold with high bond yields in developed countries, huge budget deficits in many countries and the need to support the economy makes one think that the upside potential is limited. Until gold and silver reach a new level, we doubt the success of a new attack on the highs and see the potential for a renewed decline.
Forex and Cryptocurrency Forecast
EUR/USD: Medium-Term Outlook Favours the Dollar
Throughout the past week, EUR/USD exhibited mixed dynamics, primarily driven by expectations concerning potential interest rate cuts by the US Federal Reserve (Fed) and the European Central Bank (ECB). Statements by officials from both central banks, as well as economic macro-statistics, either heightened or lowered these expectations.
The EUR/USD bullish rally commenced on 16 April from the 1.0600 mark, reaching a peak of 1.0811 on 3 May, after which growth stalled, starting the past week at 1.0762. On Monday, 6 May, statistics from the Eurozone provided some support to the common European currency. In April, the Services Purchasing Managers' Index (PMI) rose from 52.9 to 53.3, exceeding the forecast of 52.9. The Composite PMI, which includes the manufacturing sector and services, increased from 51.4 to 51.7. Germany's Composite PMI also showed positive dynamics, rising from 50.5 to 50.6. Consequently, business activity in the Eurozone reached its highest level in almost a year. Moreover, retail sales in the region showed significant growth, rising from -0.5% to +0.7% year-on-year.
This news backdrop suggests potential inflation growth, which in theory could deter the ECB from initiating a monetary policy easing. However, ECB Chief Economist Philip Lane stated that the Executive Board of the bank has compelling arguments for a rate cut at the 6 June meeting. Another ECB representative, Lithuanian Central Bank head Gediminas Simkus, indicated that rate cuts should not be limited to June, suggesting it could happen thrice by the end of the year. However, while the likelihood of easing (QE) in June is near 100%, there is some uncertainty regarding further steps. ECB Vice President Luis de Guindos admitted that the regulator is cautiously forecasting any trends beyond June.
In addition to ECB officials' statements supporting easing, statistics released on Tuesday, 7 May, also contributed. They showed that manufacturing orders in Germany, the locomotive of the European economy, decreased by 0.4% in March after a 0.8% decline in February. As a result, the EUR/USD pair's growth halted, pulling back to 1.0723.
The pair made another attempt to break through the strong resistance zone of 1.0790-1.0800 on Thursday, 9 May, when US initial jobless claims data was unexpectedly reported at 231K, much worse than the expected 210K. This coincided with a widespread negative session for US yields along the curve. The situation worsened as the unemployment data confirmed concerning statistics released on 3 May. According to the US Bureau of Labor Statistics (BLS), non-farm payrolls (NFP) rose by just 175K in April, significantly below the March figure of 315K and market expectations of 238K. The employment report also showed an increase in unemployment from 3.8% to 3.9%.
Besides combating inflation, the Fed's other declared main goal is maximum employment. "If inflation remains stable and the labor market strong, it would be appropriate to delay rate cuts," stated Fed Chair Jerome Powell. Now, the strength of the labour market is in question. However, the Fed is likely to focus on fighting inflation, which is still far from the 2.0% target.
A key inflation indicator tracked by the Fed, the Personal Consumption Expenditures (PCE) Price Index, rose from 2.5% to 2.7% in March. However, the ISM Manufacturing PMI fell below the key 50.0 mark, dropping from 50.3 to 49.2 points. Remember, a level of 50.0 separates economic growth from contraction. In such a situation, raising the interest rate is inadvisable, but lowering it is also not an option. This is exactly what the FOMC (Federal Open Market Committee) of the Fed did. At its meeting on Wednesday, 1 May, its members unanimously left the rate unchanged at 5.50%. This is the highest rate in 23 years, and the US central bank has kept it unchanged for six consecutive meetings.
The main scenario foresees the Fed beginning to review the rate towards a decrease no earlier than autumn, likely in September, with another cut by year-end. However, if US inflation does not decline or, worse, continues to rise, the regulator may abandon monetary policy easing until early 2025. Thus, considering the above, many analysts believe the medium-term advantage remains with the dollar, and EUR/USD is still attractive for sales with a horizon of several months.
The final point of the week for EUR/USD was at 1.0770, making the weekly result almost zero. Regarding the forecast for the near term, as of the evening of 10 May, it is maximally neutral: 50% expect dollar strengthening, and 50% expect its weakening. Trend indicators on D1 are equally divided: half are on the side of the reds, and half are on the side of the greens. Among oscillators, only 10% voted for the reds, another 10% remained neutral, and 80% voted for the greens (although a quarter of them are already signalling overbought conditions). The nearest support for the pair is located in the 1.0710-1.0725 zone, followed by 1.0650, 1.0600-1.0620, 1.0560, 1.0495-1.0515, 1.0450, 1.0375, 1.0255, 1.0130, and 1.0000. Resistance zones are in the regions of 1.0795-1.0810, 1.0865, 1.0895-1.0925, 1.0965-1.0980, 1.1015, 1.1050, and 1.1100-1.1140.
In the coming week, on Tuesday, 14 May, consumer inflation data (CPI) in Germany and the Producer Price Index (PPI) in the US will be released. Also scheduled for this day is a speech by Fed Chair Jerome Powell. The next day, Wednesday, 15 May, important indicators such as Consumer Price Index (CPI) and retail sales volumes in the United States will be published. On Thursday, 16 May, the traditional number of initial jobless claims in the US will be announced. And at the very end of the working week, on Friday, 17 May, we will learn the Eurozone CPI as a whole, which may influence the ECB's decision regarding the euro interest rate.
GBP/USD: Pound Remains Under Pressure but Holds On
At its meeting on Thursday, 9 May, the Bank of England's (BoE) Monetary Policy Committee maintained the interest rate at 5.25%, the highest in 16 years. Economists polled by Reuters mostly expected borrowing costs to remain unchanged, with a committee vote ratio of 8 to 1. However, the vote was 7 to 2. During discussions, two committee members supported a rate cut to 5.0%, which market participants interpreted as a step towards the beginning of a policy easing cycle.
At the post-meeting press conference, BoE Governor Andrew Bailey expressed optimism, stating that the UK economy is moving in the right direction. Bailey also noted that "a rate cut next month is quite possible," but he intends to wait for data on inflation, activity, and the labour market before making a decision. Chief Economist Huw Pill, although he joined the majority in voting to keep the rate unchanged, also expressed growing confidence that the time for a reduction is approaching. He added that "focusing only on the next Bank of England meeting [20 June] is somewhat unreasonable" and that "medium-term inflation forecasts do not necessarily signal rate movements at the next or subsequent meetings."
Overall, the movement of the GBP/USD pair last week resembled that of the EUR/USD pair. The chart shows a distinct surge on Thursday, 9 May, triggered by data indicating a cooling US labour market. The pound was also supported by optimistic GDP data for the UK for Q1 2024 and manufacturing sector data for March.
GDP (quarter-on-quarter) rose by +0.6% after a decline of -0.3% in the previous quarter (forecast +0.4%). Additionally, the GDP grew by +0.2% year-on-year, recovering from a fall of -0.2%.
As with the euro, the pound is under pressure from the prospect of earlier monetary policy easing by the BoE compared to the Fed. However, the British currency ended the past week above the key 1.2500 level, at 1.2523. Moreover, 65% of analysts expect the pair not only to hold above this horizon but also to continue its growth. The remaining 35% voted for the pair's movement south. As for technical analysis, trend indicators on D1 are split 50-50. Among oscillators, only 10% recommend selling, 40% took a neutral position, and 50% recommend buying (10% of them signal overbought conditions). If the pair rises, it will encounter resistance at levels 1.2575-1.2610, 1.2695-1.2710, 1.2755-1.2775, 1.2800-1.2820, and 1.2885-1.2900. In case of a fall, it will face support levels and zones at 1.2490-1.2500, 1.2450, 1.2400-1.2410, 1.2300-1.2330, 1.2185-1.2210, and 1.2070-1.2110, 1.2035.
The upcoming week's calendar highlights Tuesday, 14 May, when data from the UK labour market will be released. Also of interest is the Inflation Report hearing scheduled for Wednesday, 15 May.
USD/JPY: $50 Billion Interventions Wasted?
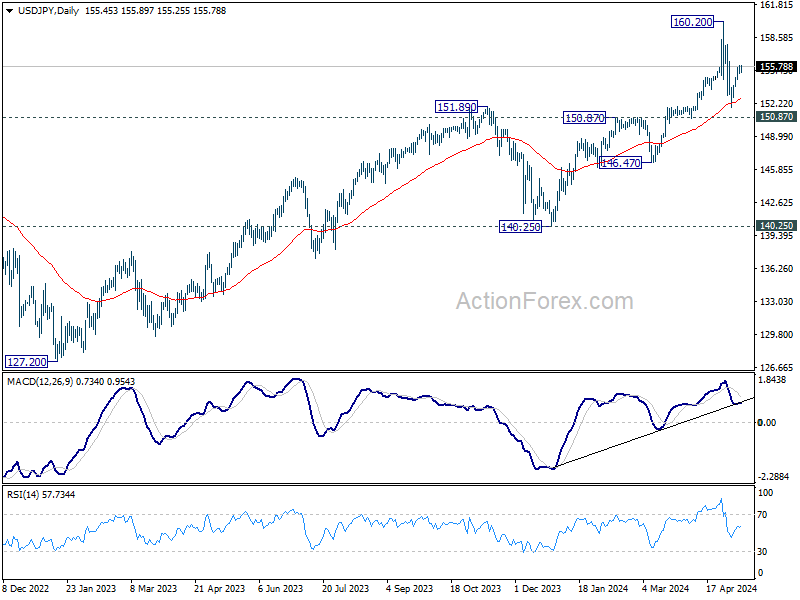
It seems that until the Bank of Japan (BoJ) takes confident and clear steps to tighten its monetary policy, nothing will help the yen. At its meeting on 26 April, the board members of this regulator unanimously decided to leave the key rate and QE program parameters unchanged. Expectedly tough comments on the outlook were also absent. This inaction increased pressure on the national currency, sending the USD/JPY pair to new heights. It continued its cosmic saga, reaching a new 34-year high of 160.22. Following this, Japan's financial authorities finally decided on a double currency intervention. Although there was no official confirmation, experts estimate its total volume at $50 billion.
Did it help? Judging by the USD/JPY chart, not really. The pair headed north again last week. Unlike the euro and the British pound, the yen barely reacted even to weak US labour market data on Thursday, 9 May, only slowing its decline.
All this occurs amid endless statements from the Japanese Central Bank and Ministry of Finance about their readiness to take necessary measures to reduce speculative pressure on the national currency. The published minutes of the BoJ meeting show that most board members took a "hawkish" stance, calling for a rate hike. However, many analysts believe that the Bank of Japan will take only one such step in the second half of the year.
The last chord of the past five days sounded at 155.75. Economists at Singapore's United Overseas Bank Limited (UOB) expect the USD/JPY pair to trade in the 154.00-157.20 range in the next 1-3 weeks. UOB also believes that the chances of it falling to 151.55 have significantly diminished. Overall, most experts (70%) simply shrug their shoulders in uncertainty. The remaining 30% persistently expect the yen to strengthen. As for technical analysis, 100% of trend indicators on D1 look north. Among oscillators, 50% are such, 15% point south, and 35% point east. Regarding support/resistance levels, traders should note that with such volatility, the slippage can reach many tens of points. The nearest support level is around 155.25, followed by 154.70, 153.90, 153.10, 151.85-152.25, 151.00, 150.00, after which come 146.50-146.90, 143.30-143.75, and 140.25-141.00. Resistance levels are 156.25, 157.00, 157.80-158.00, 158.60, 159.40, and 160.00-160.25.
Events of the upcoming week include the release on Thursday, 16 May, of preliminary GDP data for Japan for Q1 2024. No other significant publications regarding the Japanese economy are expected in the coming week.
CRYPTOCURRENCIES: A Week of Reflection and Uncertainty
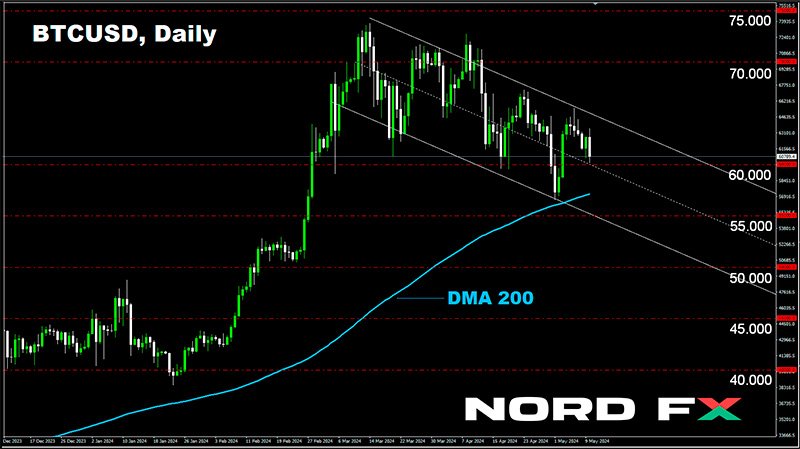
What will happen to bitcoin in the foreseeable future? It seems there is no clear answer to this question. Experts and influencers often point in opposite directions: some shoot for the stars, while others keep their eyes on the ground.
For instance, according to the founder of Pomp Investments, Anthony Pompliano, bitcoin is "stronger than ever." He concluded this based on the 200-day moving average (200 DMA) reaching its ATH (All-Time High) of $57,000. Michael Saylor, CEO of MicroStrategy, is also optimistic. In his latest message, he urged investors to "run with the bulls." (It should be noted here that MicroStrategy holds 205,000 BTC on its balance sheet, so Saylor's bullish calls are quite understandable. He simply has to do this for his company to profit rather than incur losses).
However, analysts note that bitcoin's fate depends not only on the rosy calls of the MicroStrategy CEO. And if buyer support weakens, BTC could break through the key support level of $61,000, falling to the $56,000 zone, where significant liquidity is concentrated. MN Trading founder Michael Van De Poppe does not rule out another correction to around $55,000. However, the specialist quickly reassures investors, stating that this is quite acceptable as long as bitcoin holds above $60,000. Anthony Pompliano believes that the price will not fall below $50,000, and another expert, Alan Santana, does not rule out a drop to $30,000.
Trader and analyst Rekt Capital believes that the first cryptocurrency has exited the post-halving "danger zone" and entered the initial phase of re-accumulation. According to this expert, in 2016, BTC demonstrated a long red candle after the halving, falling by 17%. This time, the pattern repeated, with the difference between the post-halving maximum and minimum being 16%. The price reached a local bottom at around $56,566 but then rose to $65,508, on which Rekt Capital concluded that it re-entered the "re-accumulation range." However, there is one "but" - after this, we again observed a drop to $60,175. Overall, it seems that BTC/USD is in a descending channel, which increases investor concern.
In general, the forecasts are quite diverse. Information on the activity of various categories of traders and investors also varies. Analyst and CMCC Crest co-founder Willy Woo noted the activity of so-called crypto dolphins and sharks. "There has never been such a rapid purchase of coins by wealthy holders as in the last two months when the price fluctuated between $60,000-70,000. We are talking about those who hold from 100 BTC to 1000 BTC or approximately $6.5-65 million," he explained. On the other hand, according to CryptoQuant analysts, whales holding from 1000 to 10000 BTC, unlike dolphins and sharks, have behaved quite passively. Michael Van De Poppe, for his part, notes the absence of retail investors.
All this suggests that we may not see new all-time highs for BTC in the coming months. We wrote about this in the previous review, citing, among other things, the opinion of such a Wall Street legend as Factor LLC head Peter Brandt. With a 25% probability, he assumed that bitcoin had already formed another ATH within the current cycle.
As for long-term forecasts, nothing has changed here - most of them predict a powerful bull rally for bitcoin. Anthony Pompliano writes about this. Willy Woo expects bitcoin to continue increasing its penetration into various spheres of everyday life, meaning the number of users will grow. "By 2035, we expect bitcoin's fair value to reach $1 million. This forecast is based on the user growth curve. And I'm talking about fair value, not a peak during a bull market frenzy," the analyst notes.
The author of the bestseller "Rich Dad Poor Dad," entrepreneur Robert Kiyosaki, once again included bitcoin in the TOP-3 ways to save and increase capital. "Bad news: the [currency market] crash has already begun. It will be severe. Good news: a crash is the best time to get rich," he wrote, offering several recommendations on how to act in a crisis. Let's note two of them. The first reads: "Find an additional source of income. Artificial Intelligence will destroy millions of jobs. Start a small business and become an entrepreneur, not an employee afraid of losing a job." "Don't hoard fake money (US dollar, euro, yen, peso) that is losing value. Hoard gold, silver, and bitcoin - real money whose value increases, especially in a market crash," is Kiyosaki's second recommendation.
Regarding bitcoin's growth, Kiyosaki is absolutely right; it's even pointless to argue. According to a study by Colin Wu, better known as WuBlockchain, over the past decade, the price of the leading cryptocurrency has grown by an astonishing 12,464%, outpacing giants like Amazon, Apple, Google, Meta, Tesla, and Netflix. BTC was second only to Nvidia (+17,797%). But the fact that bitcoin took second place, being a representative of a relatively new and volatile market, is a real achievement. BTC's impressive growth trajectory over the past decade demonstrates its resilience and potential as an essential component in investors' portfolios.
At the time of writing this review, on the evening of Friday, 10 May, the BTC/USD pair is trading at $60,470. The total market capitalization of the crypto market is $2.24 trillion ($2.33 trillion a week ago). The Crypto Fear & Greed Index has risen from the Neutral zone (48 points a week ago) to the Greed zone, now standing at 66 points.
Global Markets Rally on Central Bank Easing Signals; Currencies Show Subdued Movements
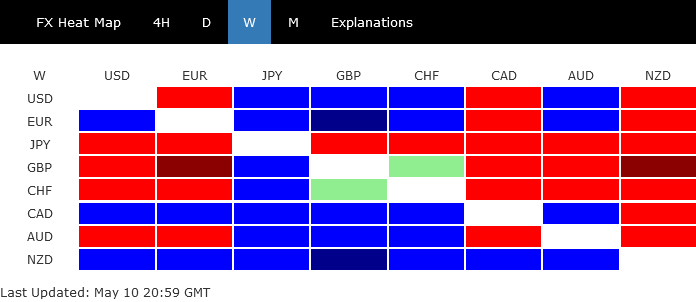
Global markets were buoyed by pervasive risk-on sentiment last week, with both FTSE and DAX setting new records and major US indices posting substantial gains. Even Hong Kong HSI extended its rally from January's lows by 25%, underscoring a broad uptick in investor confidence. In Europe, enthusiasm was particularly pronounced following the ECB's reaffirmation of its conditional guidance for a rate cut in June. BoE likewise moved closer to monetary easing, further lifting spirits in the financial markets.
Currency movements, however, presented a more subdued picture, with most major pairs and crosses finishing within the previous week's range. Japanese Yen underperformed, giving back some of its recent gains, which were fueled by rumored market interventions the week prior. Sterling and Swiss Franc were the next worst, with the Pound reacting to BoE's dovish shift.
Conversely, New Zealand Dollar emerged as the week's strongest performer, buoyed by its recovery against Australian Dollar, which faced pressure from less hawkish than anticipated stance from RBA. Canadian Dollar stood out as the second best, driven by robust job data that dampened expectations for an imminent rate cut by BoC. Euro ranked as the third strongest currency while Dollar and Aussie ended the week in the middle of the pack.
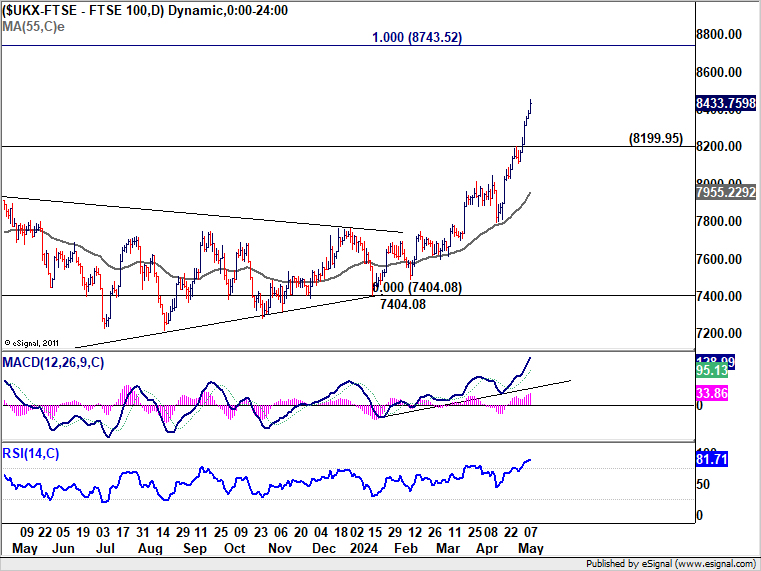
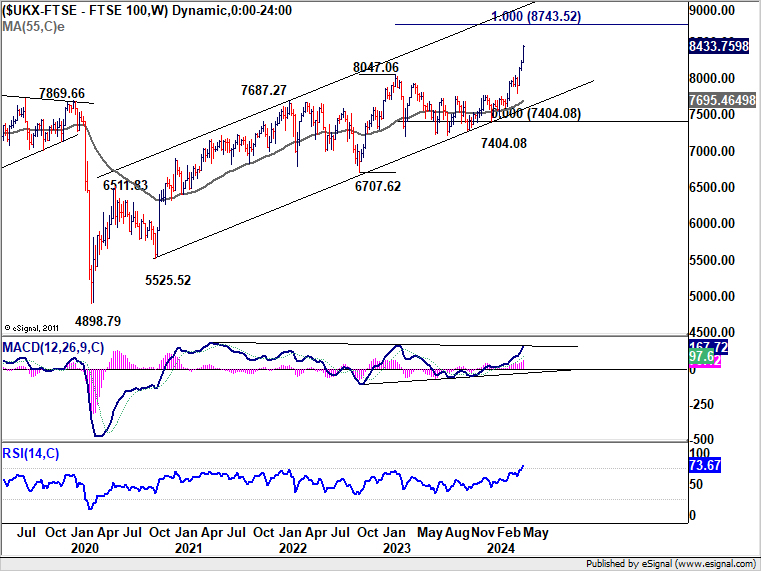
UK Economic Recovery and BoE Rate Cut Hopes Propel FTSE to New Record
FTSE index soared to new record high following UK GDP figures release, which confirmed that the British economy has officially emerged from recession. The data revealed a robust first-quarter growth of 0.6% qoq, the largest expansion seen since 2021. Additionally, growth rate for March alone stood at 0.4% mom, signaling that the economic recovery is not only underway but also gaining momentum
Concurrently, BoE appears to be inching closer to reducing interest rates. Despite holding the bank rate steady at 5.25%, the tone of the meeting was decidedly dovish. Notably, Deputy Governor Dave Ramsden and Swati Dhingra, a known dovish member, both advocated for a rate cut, resulting in a 7-2 vote. This move, coupled with Governor Andrew Bailey's remarks that a June rate cut is "neither ruled out nor a fait accompli," points to a possible easing in monetary policy in the near term.
Nevertheless, Chief Economist Huw Pill added a note of caution to the conversation, advising that excessive focus on June might be "probably a little bit ill-advised." Despite this caution, the markets are currently pricing in around 50% chance of a rate reduction in June. A rate cut in August is fully priced in, with another reduction anticipated in November.
Technically, FTSE is in upside acceleration phase as seen in D MACD as well as D RSI. Near term outlook will remain bullish as long as 8199.95 support holds. Next target is 100% projection of 6707.62 to 8047.06 from 7404.08 at 8743.52.
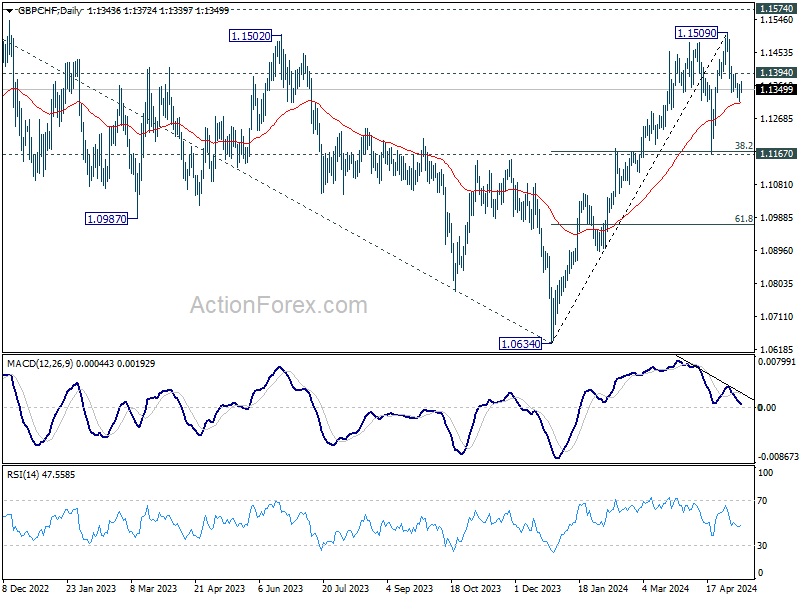
As for Sterling, it has been struggling against Euro and Swiss Franc recently on BoE rate cut expectations too. Considering bearish divergence condition in D MACD, a short term top should be formed at 1.1509, ahead of 1.1574 key resistance. Firm break of 55 D EMA (now at 1.1312) should confirm that GBP/CHF is in correction to whole rise from 1.0634. Deeper fall should then be seen to 1.1167 cluster support (38.2% retracement of 1.0634 to 1.1509 at 1.1175). Strong support is expected there to bring rebound and set the range for sideway consolidations.
DAX also hits record, ECB on track for June cut
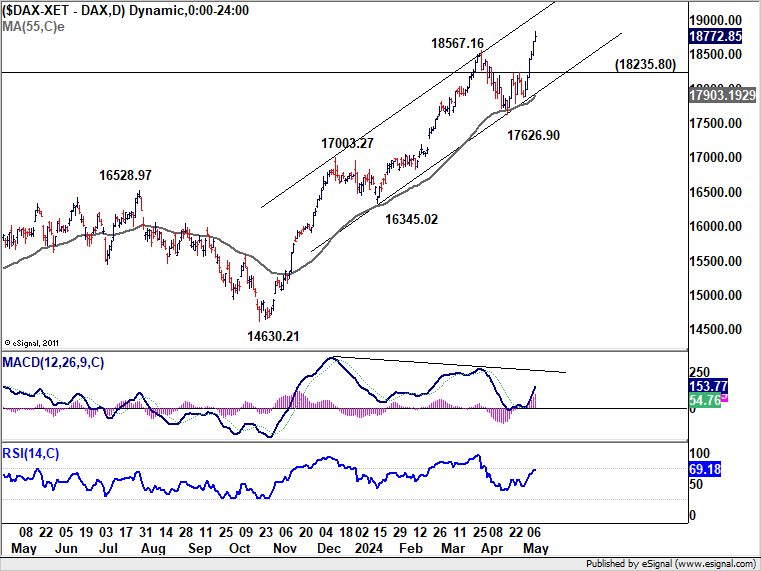
DAX also surged to new record high, buoyed by broad risk-on sentiment and expectations that ECB will soon ease monetary policy. According to the minutes from ECB's April meeting, while a "very large majority" preferred to hold rates steady for another session, a few members were "sufficiently confident" to support a rate cut at that time. The meeting accounts suggested that it is "plausible that the Governing Council would be in a position to start easing monetary policy restriction at the June meeting."
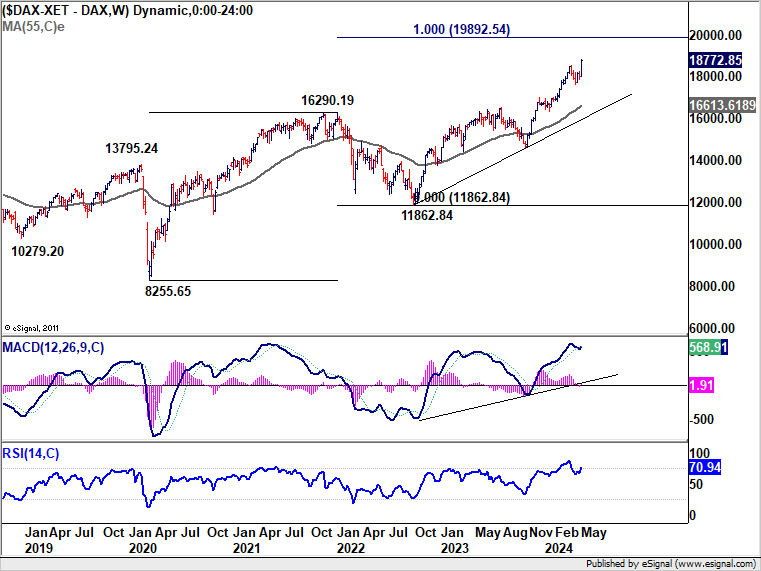
Near term outlook in DAX will stay bullish as long as 18235.90 support holds. Next target is 100% projection of 8255.65 to 19892.54 from 11862.84 at 19892.54. However, considering bearish divergence condition in D MACD, upside could be limited there to bring consolidations.
Euro has also seen some weakness against Swiss Franc recently, mainly due to ECB's easing expectations juxtaposed against SNB more advanced rate-cutting cycle. SNB has already begun cutting rates as of March. However, SNB's policy rate now at just 1.50%, Comparing to ECB's deposit rate of 4.00% and BoE's rate of 5.25%, there is more room for the latter two on rate reductions. Both EUR/CHF and GBP/CHF could stay soft in the near term, until there are more ideas on where the terminal rates for these three central banks would be.
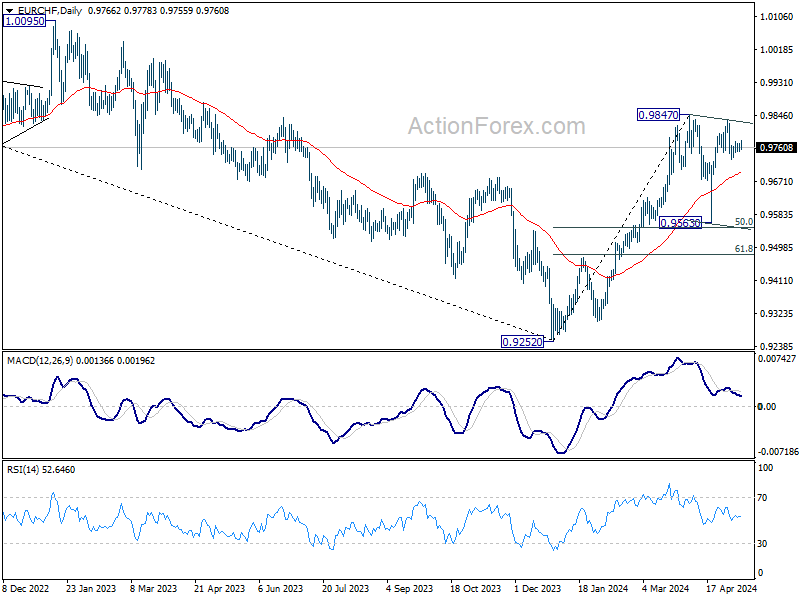
As for EUR/CHF, corrective pattern from 0.9847 is seen as in its third leg already. Deeper decline is expected to 55 D EMA (now at 0.9691). Firm break there will pave the way to 0.9563. But strong support is expected from 50% retracement of 0.9252 to 0.9847 at 0.9550 to complete the pattern.
US Equities Extend Gains, Dollar Index continues Consolidation
In the US, the stock markets continued their impressive rebound but Dollar and Treasury Yields have shown little movement. The optimism in equity markets stems from Fed's recent indications that an interest rate hike is not on the table. However, the overarching challenge remains as Fed has signaled that high interest rates will persist longer than initially anticipated to address stubborn inflationary pressures.
Meanwhile, Investor enthusiasm received a check from the latest University of Michigan consumer survey, which indicated further rise in both short-term and medium-term inflation expectations. According to the survey, one-year inflation expectation increased from 3.2% to 3.5% in May, while five-year expectations edged up from 3.0% to 3.1% . These figures remind the markets that consumer anxiety about inflation is not abating. Traders will likely turn cautious until the upcoming US CPI data provide further guidance.
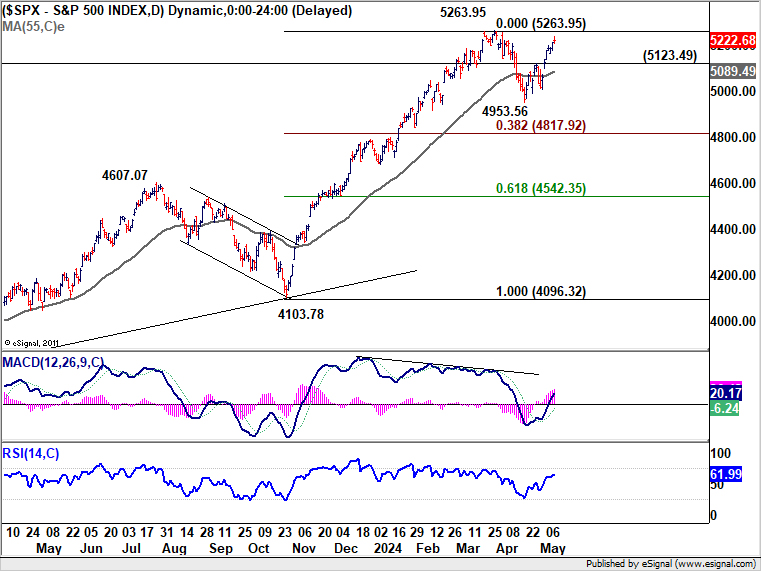
Technically, S&P 500's rebound from 4953.45 is seen as the second leg of the corrective pattern from 5263.95. Strong resistance should be seen from 5263.95 to cap upside. Break of 5123.49 support will indicate that the third leg has started. In the case, deeper call would be seen to 4953.56, and possibly below to 38.2% retracement of 4096.32 to 5263.96 at 4817.92. However, decisive break of 5263.96 will invalidate this view and confirm larger up trend resumption.
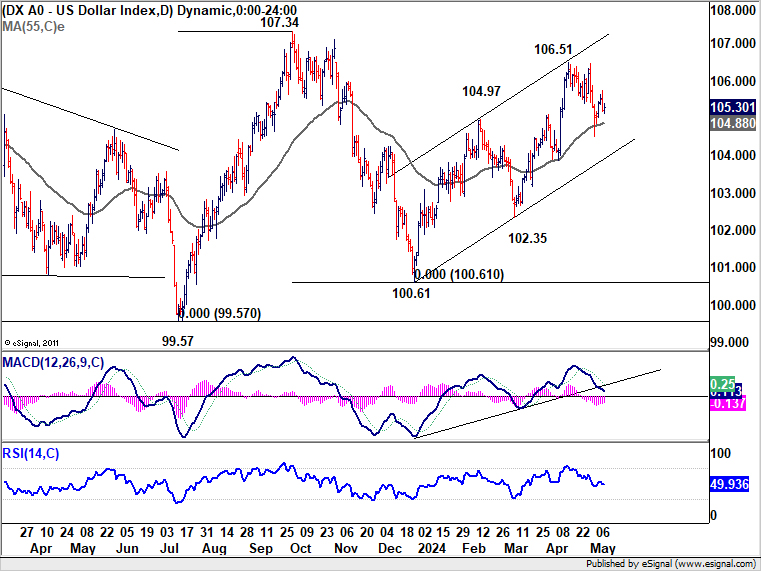
Dollar Index recovered after drawing support from 55 D EMA, but there is no clear upside momentum yet. Corrective fall from 106.51 could still resume to lower channel support (now at 104.00). Strong support from there would retain near term bullishness for resuming the rise fro 100.61 through 106.51 at a later stage. However, sustained break of the channel will argue that rebound from 100.61 has completed as a three-wave corrective move. Deeper fall would then be seen through 102.35 support in this bearish case.
AUD/CAD Rally Hits Pause as Markets Reassess RBA and BoC
Australian Dollar ended the week on a mixed note as market speculations for further RBA rate hikes cooled significantly. In her post-meeting press conference, RBA Governor Michele Bullock provided a clear signal, stating, "we don't think we necessarily have to tighten again." This stance suggests that RBA plans to maintain the current interest rate for an extended period to continue addressing inflation pressures effectively. Following this announcement, the Cash Rate Implied Yield Curve adjusted, showing a flattening trend with projections not exceeding the current cash rate of 4.35%. Meanwhile, markets have only fully priced in the first rate cut for June of the following year.
Conversely, Canadian market pared back its expectations for an imminent rate cut by BoC following exceptionally strong job data. The economy added 90k jobs, marking the most substantial increase since January 2023. Although annual wage growth slowed slightly from 5.1% to 4.8%, it remains elevated. The likelihood of a June rate cut has been reduced to 48% from 54%. A cut is now priced in for September, a delay from July anticipated before the job report. Nevertheless, the upcoming inflation report on May 21 will be even more crucial in shaping the outcome of June BoC meeting.
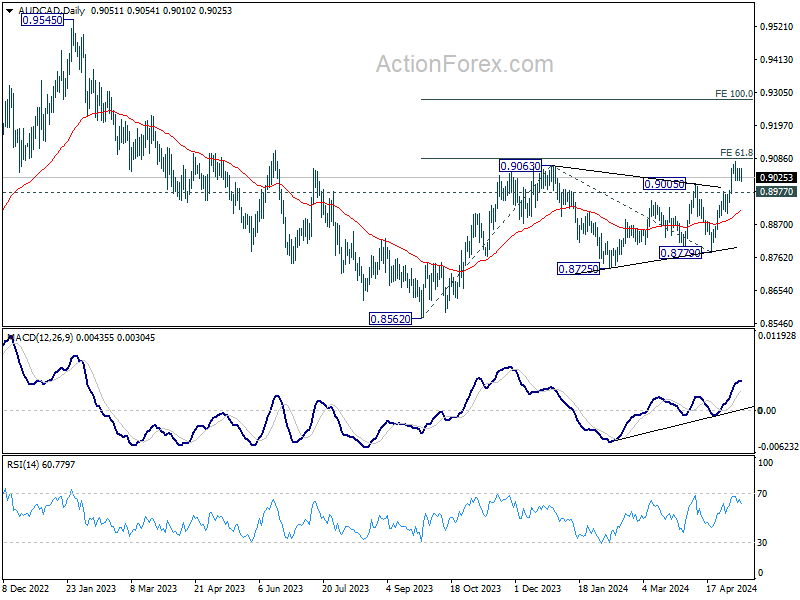
These developments capped AUD/CAD upward momentum, as it stalled below 61.8% projection of 0.8562 to 0.9063 from 0.8779 at 0.9098. Nevertheless, near term outlook will stay bullish as long as 0.8977 support holds. Firm break of 0.9098 could prompt upside acceleration to 100% projection at 0.9280.
USD/JPY Weekly Outlook
USD/JPY's rebound last week suggests that pullback from 160.20 has completed at 151.86 already. It's now in the second leg of the corrective pattern from 160.20. Further rise could be seen towards 157.98 resistance. On the downside, break of 154.23 will suggest that the third leg has started, and turn bias back to the downside for 151.86 support.
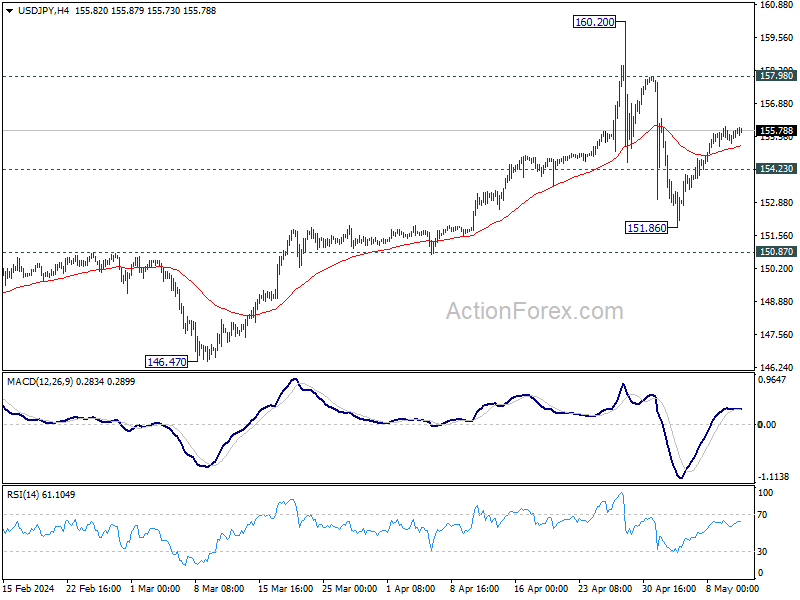
In the bigger picture, a medium term top might be formed at 160.20. But as long as 150.87 resistance turned support holds, fall from there is seen as correcting rise from 150.25 only. However, decisive break of 150.87 will argue that larger correction is possibly underway, and target 146.47 support next.
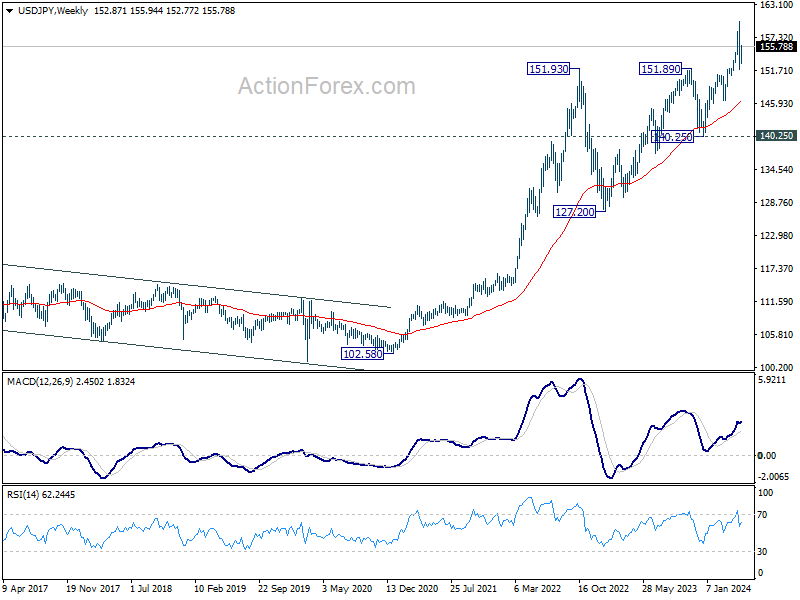
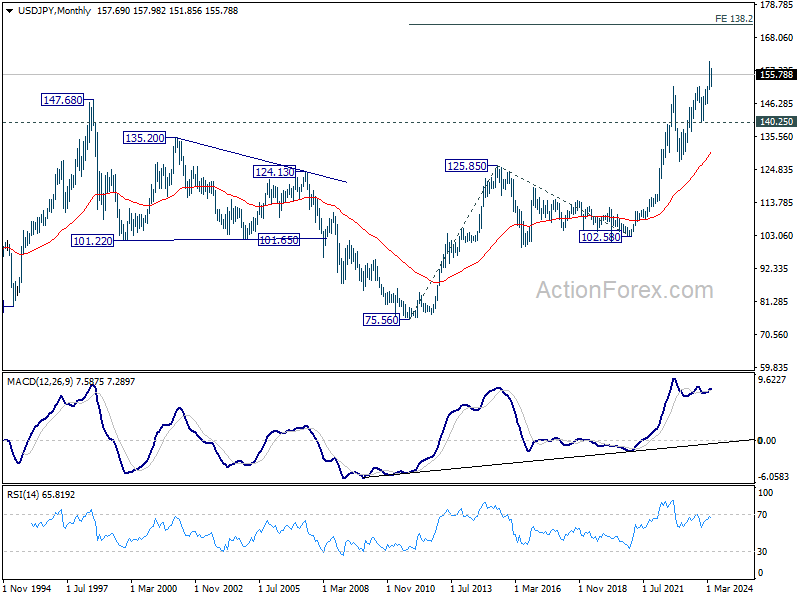
In the long term picture, as long as 140.25 support holds, up trend from 75.56 (2011 low) is still in progress. Next target is 138.2% projection of 75.56 (2011 low) to 125.85 (2015 high) from 102.58 at 172.08.
EUR/USD Weekly Outlook
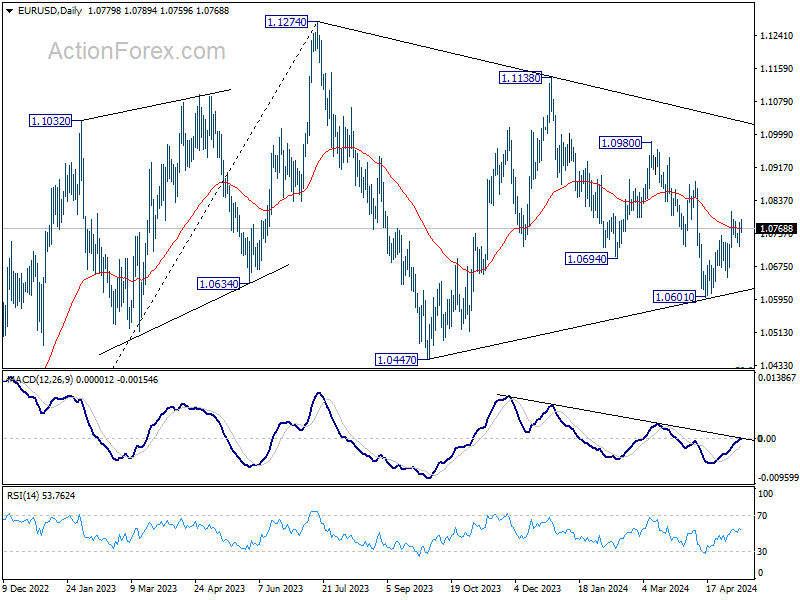
EUR/USD stayed in consolidation below 1.0810 last week. Initial bias stays neutral this week but further rally is expected as long as 55 4H EMA (now at 1.0744) holds. On the upside, above 1.0810 will resume the rebound from 1.0601 to 1.0884 resistance next. However, firm break of 55 4H EMA will argue that the rebound has completed, and turn bias to the downside for 1.0648 support instead.
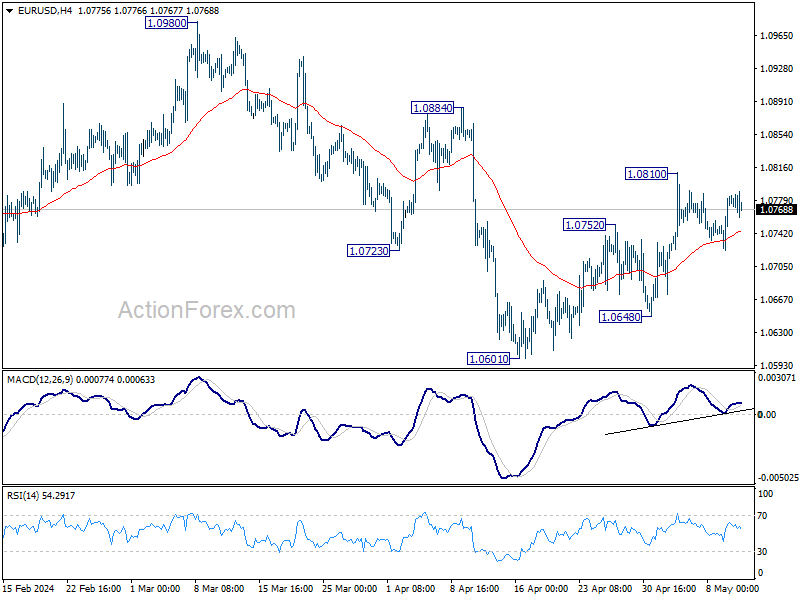
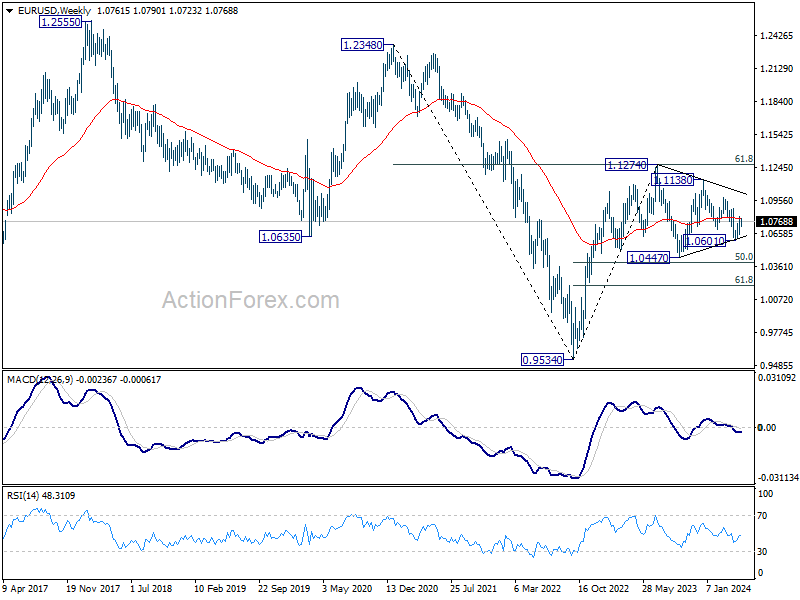
In the bigger picture, price actions from 1.1274 are viewed as a corrective pattern. Fall from 1.1138 is seen as the third leg and could have completed. Firm break of 1.1138 will argue that larger up trend from 0.9534 (2022 low) is ready to resume through 1.1274 high. On the downside, break of 1.0601 will extend the corrective pattern instead.
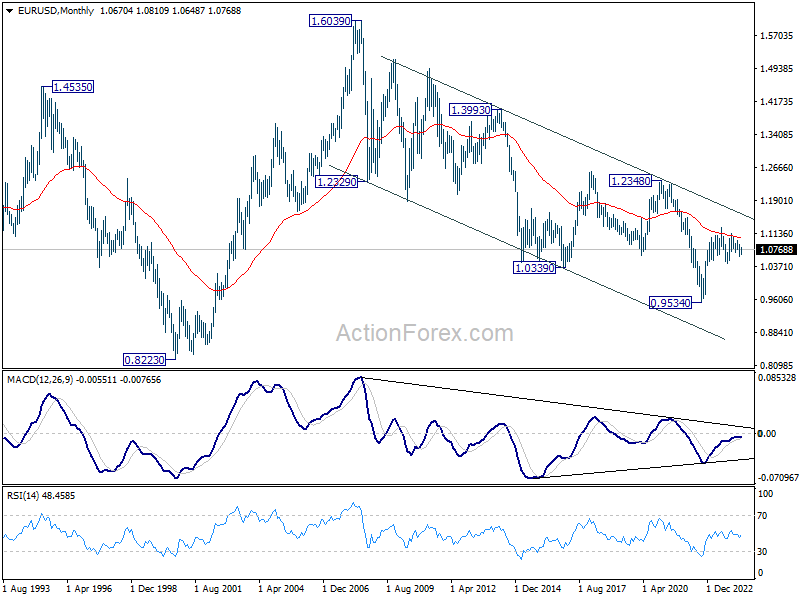
In the long term picture, a long term bottom is in place at 0.9534 on bullish convergence condition in M MACD. It's still early to call for bullish trend reversal with the pair staying inside falling channel in the monthly chart. Nevertheless, sustained trading above 55 M EMA (now at 1.1027) and break of 1.1274 resistance will raise the chance of reversal and target 1.2348 resistance for confirmation.
USD/JPY Weekly Outlook
USD/JPY's rebound last week suggests that pullback from 160.20 has completed at 151.86 already. It's now in the second leg of the corrective pattern from 160.20. Further rise could be seen towards 157.98 resistance. On the downside, break of 154.23 will suggest that the third leg has started, and turn bias back to the downside for 151.86 support.
In the bigger picture, a medium term top might be formed at 160.20. But as long as 150.87 resistance turned support holds, fall from there is seen as correcting rise from 150.25 only. However, decisive break of 150.87 will argue that larger correction is possibly underway, and target 146.47 support next.
In the long term picture, as long as 140.25 support holds, up trend from 75.56 (2011 low) is still in progress. Next target is 138.2% projection of 75.56 (2011 low) to 125.85 (2015 high) from 102.58 at 172.08.
GBP/USD Weekly Outlook
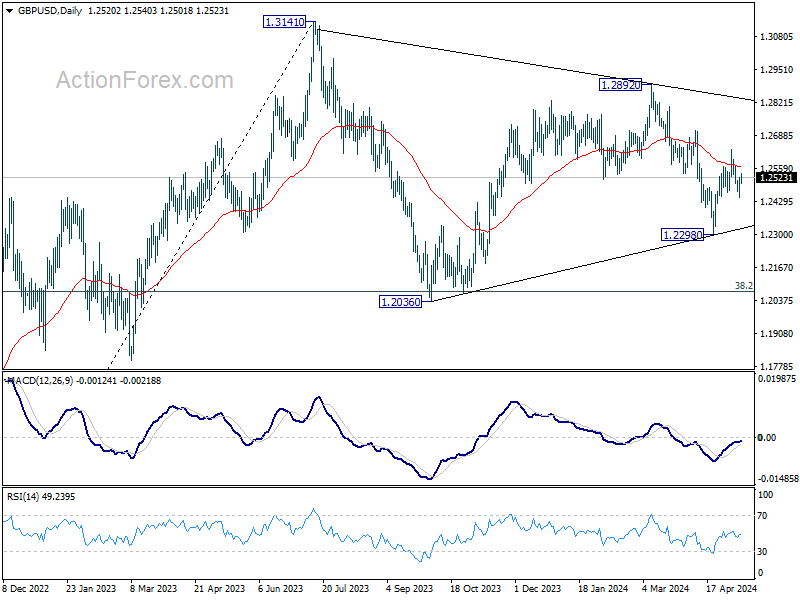
GBP/USD dipped to 1.2445 last week but recovered since then. Initial bias remains neutral this week, and further rise is mildly in favor. On the upside, break of 1.2633 will resume the rally from 1.2298 to 1.2708 resistance next. However, firm break of 1.2445 will indicate that this rebound has completed, and revive near term bearishness. Retest of 1.2298 should then be seen in this case.
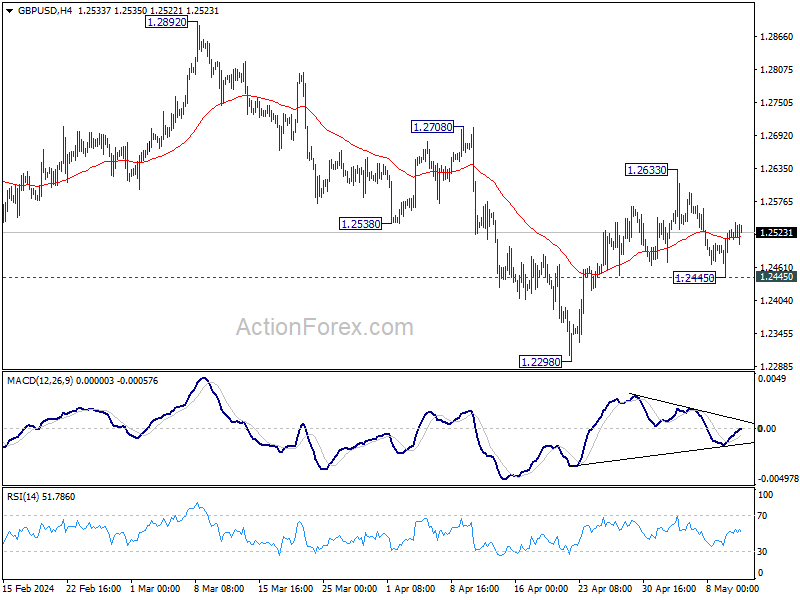
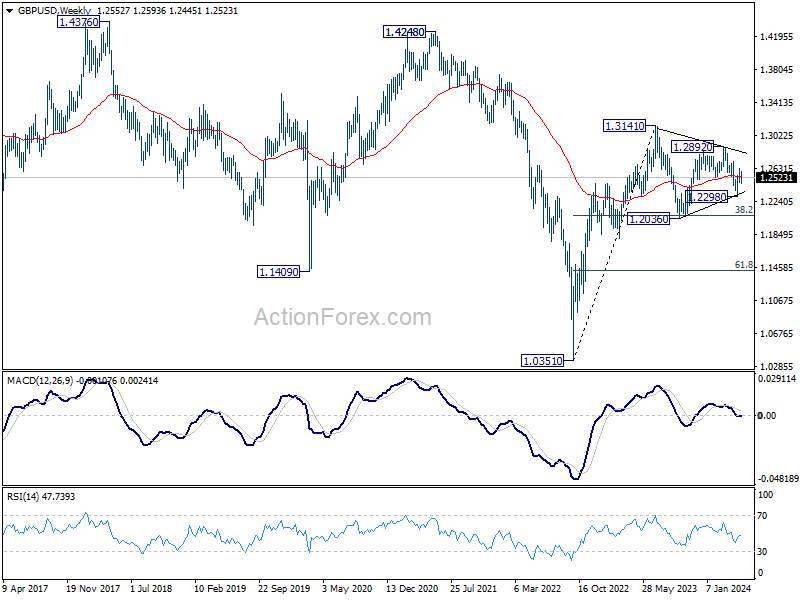
In the bigger picture, price actions from 1.3141 medium term top are seen as a corrective pattern. Fall from 1.2892 is seen as the third leg which might have completed already. Break of 1.2892 resistance will argue that larger up trend from 1.0351(2022 low) is ready to resume through 1.3141. Meanwhile, break of 1.2298 support will extend the corrective pattern instead.
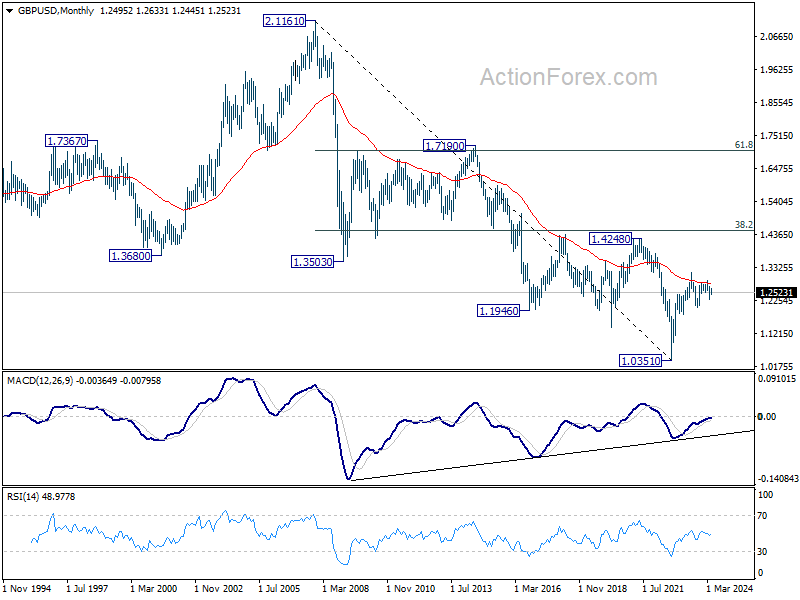
In the long term picture, a long term bottom should be in place at 1.0351 on bullish convergence condition in M MACD. But momentum of the rebound from 1.3051 argues GBP/USD is merely in consolidation, rather than trend reversal. Range trading is likely between 1.0351/4248 for some more time.
USD/CHF Weekly Outlook
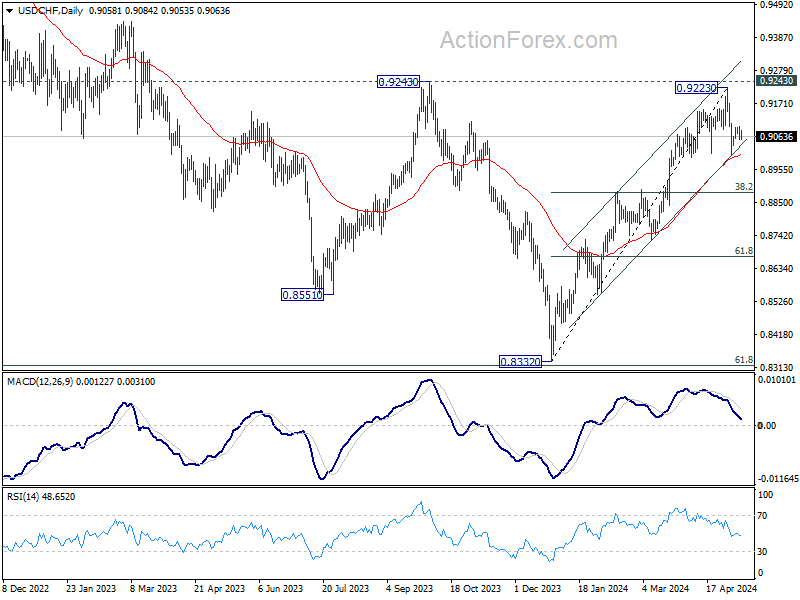
USD/CHF stayed in consolidation above 0.9005 last week. Initial bias remains neutral this week and more sideway trading could be seen. Further decline is in favor as long as 55 4H EMA (now at 0.9087) holds. On the downside, break of 0.9005 and sustained trading below 55 D EMA (now at 0.9004) will bring deeper fall to 38.2% retracement of 0.8332 to 0.9223 at 0.8883. However, firm break of 55 4H EMA will suggest that the pull back has completed, and bring stronger rebound to retest 0.9223 high.
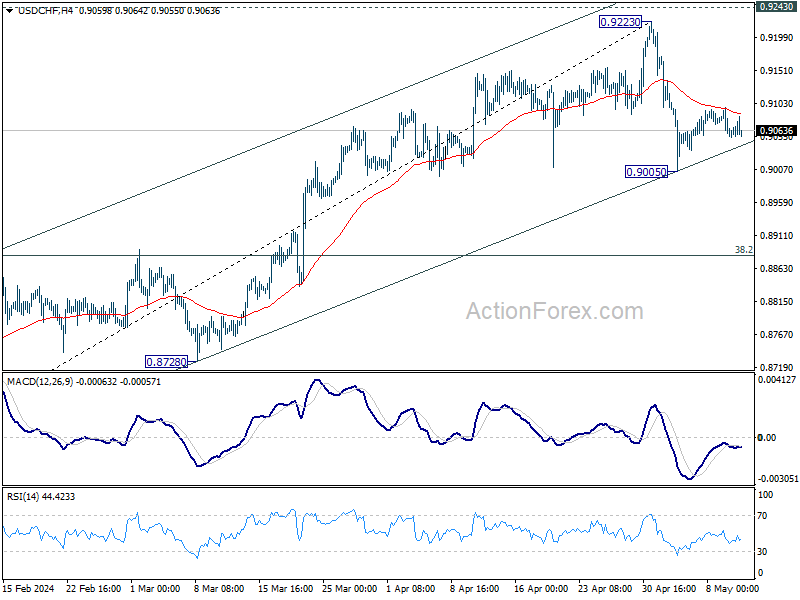
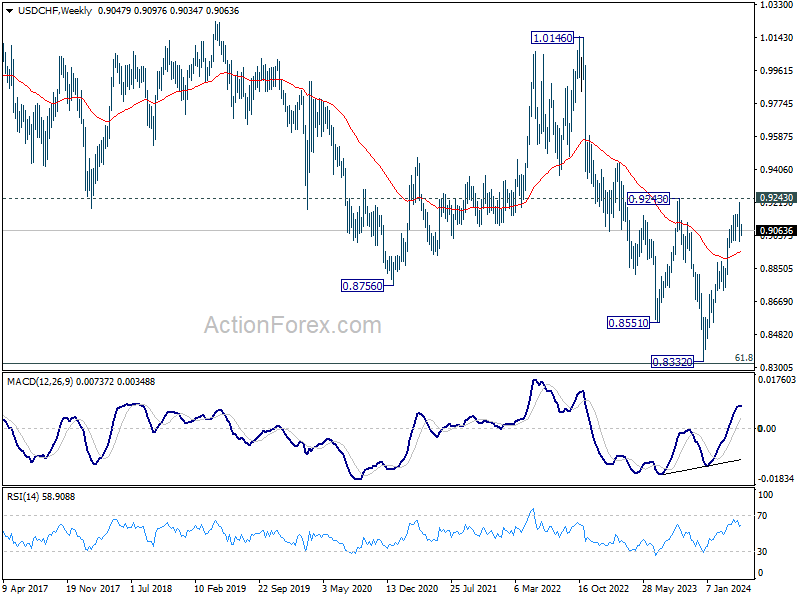
In the bigger picture, price actions from 0.8332 medium term bottom are tentatively seen as developing into a corrective pattern to the down trend from 1.0146 (2022 high). Rejection by 0.9243 resistance, followed by sustained break of 38.2% retracement of 0.8332 to 0.9223 at 0.8883 will strengthen this case, and maintain medium term bearishness. However, decisive break of 0.9243 will argue that the trend has already reversed and turn medium term outlook bullish for 1.0146.
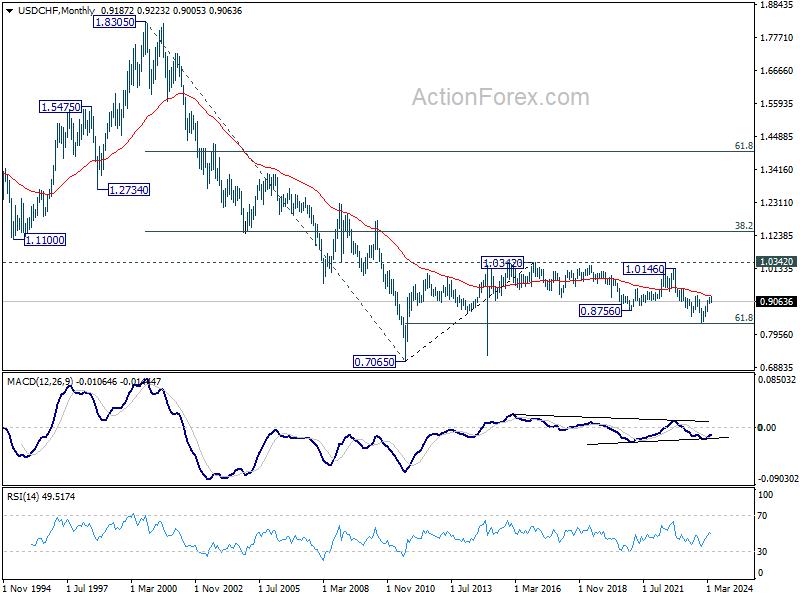
In the long term picture, price action from 0.7065 (2011 high) are seen as a corrective pattern to the multi-decade down trend from 1.8305 (2000 high). Strong rebound from 61.8% retracement of 0.7065 to 1.0342 (2016 high) will start the third leg as a medium term rally. But there will be no sign of long term reversal until firm break of 38.2% retracement of 1.8305 to 0.7065 at 1.1359.
AUD/USD Weekly Report
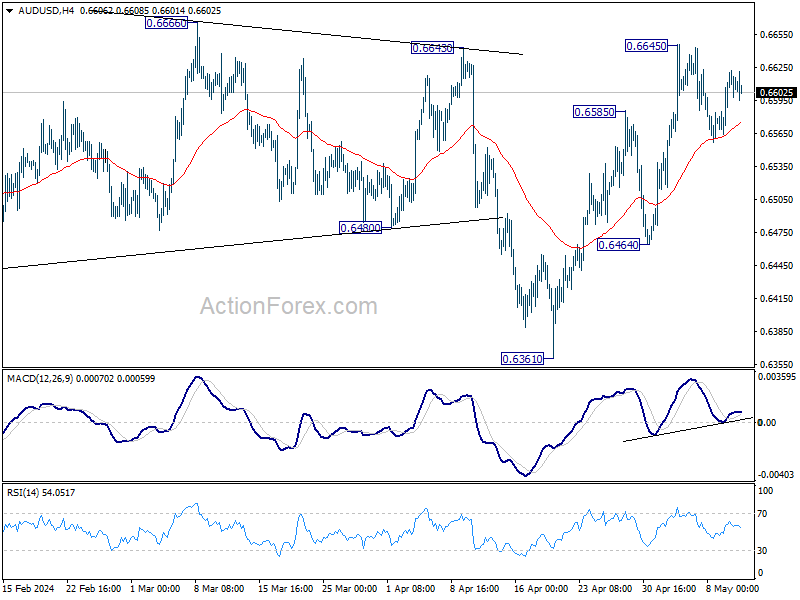
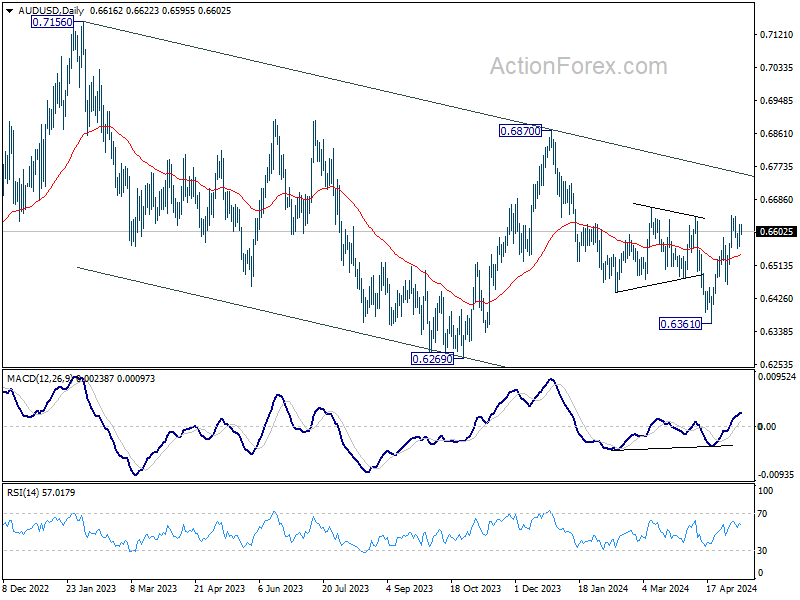
AUD/USD turned into consolidation below 0.6645 last week. Initial bias stays neutral this week first, and more sideway trading could be seen. Further rise is in favor as long as 55 4H EMA (now at 0.6575) holds. Above 0.6645 will resume the rebound from 0.6361. On the downside, however, firm break of 55 4H EMA will bring deeper fall back to 0.6464 support instead.
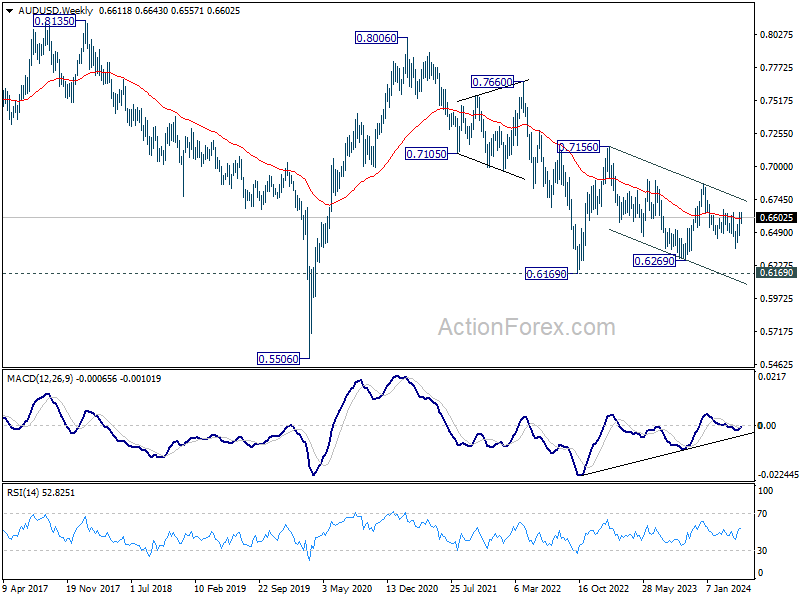
In the bigger picture, price actions from 0.6169 (2022 low) are seen as a medium term corrective pattern to the down trend from 0.8006 (2021 high). Fall from 0.7156 (2023 high) is seen as the second leg, which could still be in progress. Overall, sideway trading could continue in range of 0.6169/7156 for some more time. But as long as 0.7156 holds, an eventual downside breakout would be mildly in favor.
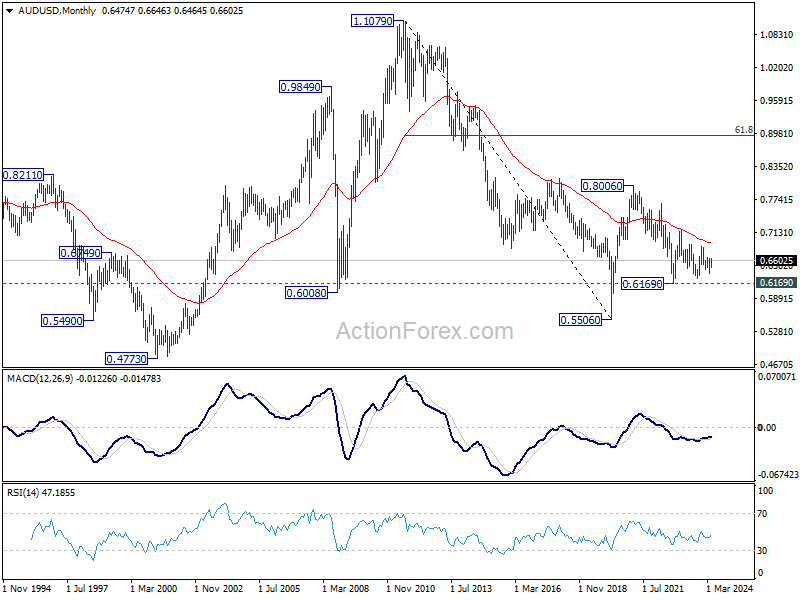
In the long term picture, the down trend from 1.1079 (2011 high) should have completed at 0.5506 (2020 low) already. It's unsure yet whether price actions from 0.5506 are developing into a corrective pattern, or trend reversal. But in either case, fall from 0.8006 is seen the second leg of the pattern. Hence, in case of deeper decline, strong support should emerge above 0.5506 to bring reversal.
USD/CAD Weekly Outlook
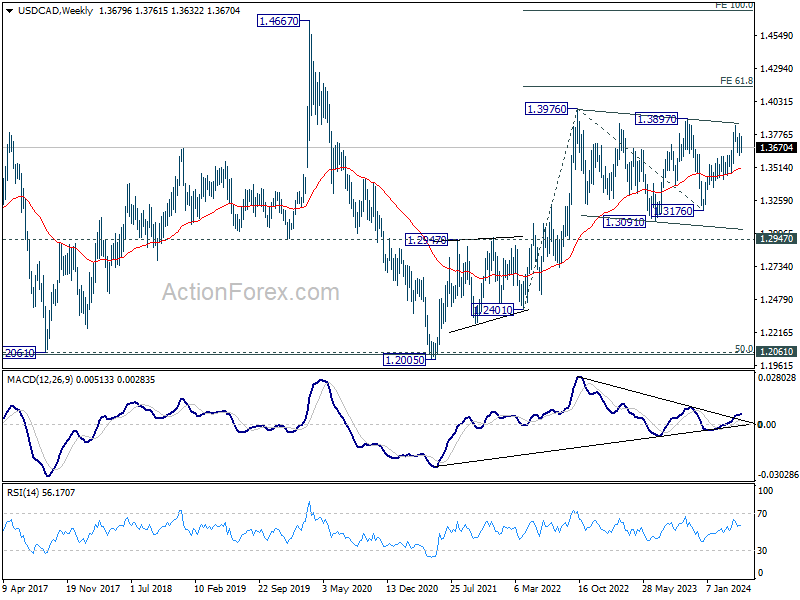
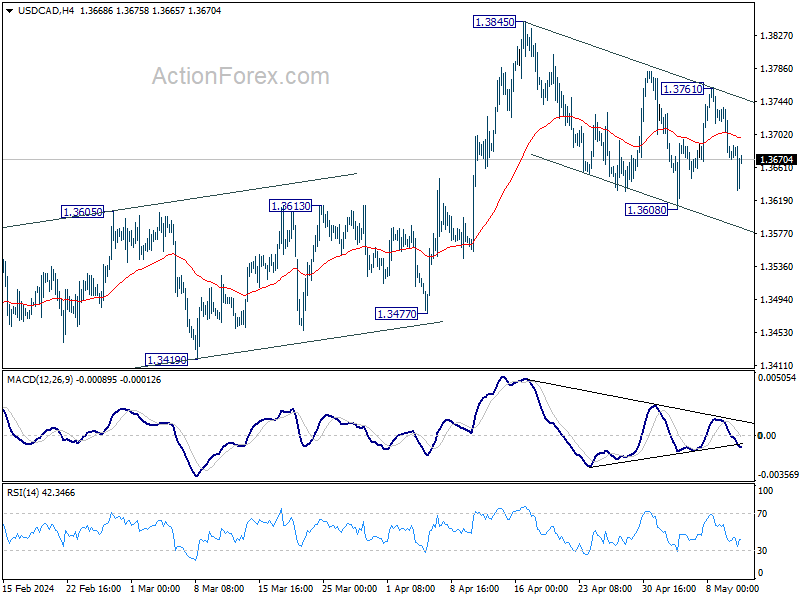
USD/CAD reversed after rebounding to 1.3761 and the development suggests that correction from 1.3845 is still extending. Initial bias remains neutral this week first. On the upside, break of 1.3761 resistance will argue that correction from 1.3845. Intraday bias will be back to the upside to resume larger rally from 1.3176 through 1.3845. However, sustained trading below 55 D EMA (now at 1.3629) will argue that whole rise from 1.3176 has completed already, and target 1.3477 support next.
In the bigger picture, price actions from 1.3976 (2022 high) are viewed as a corrective pattern only. In case of another fall, strong support should emerge above 1.2947 resistance turned support to bring rebound. Firm break of 1.3976 will confirm up resumption of whole up trend from 1.2005 (2021 low). Next target is 61.8% projection of 1.2401 to 1.3976 from 1.3176 at 1.4149.
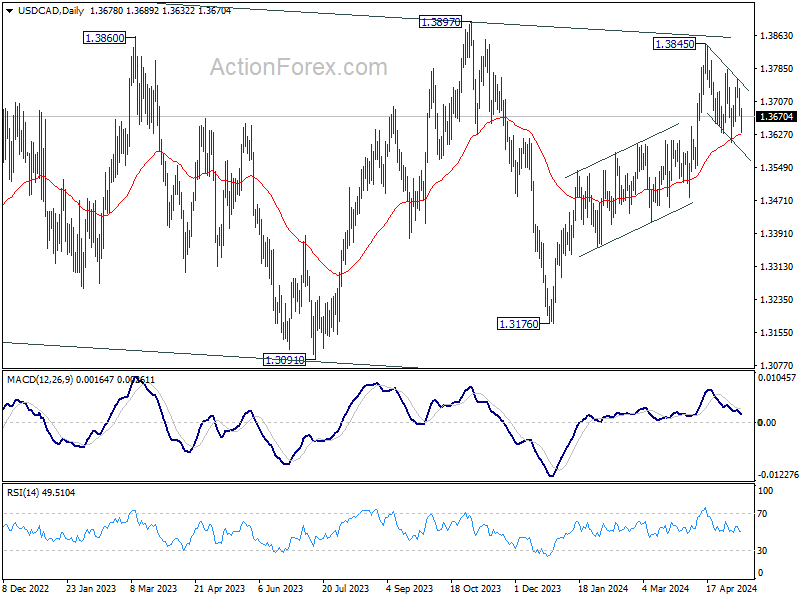
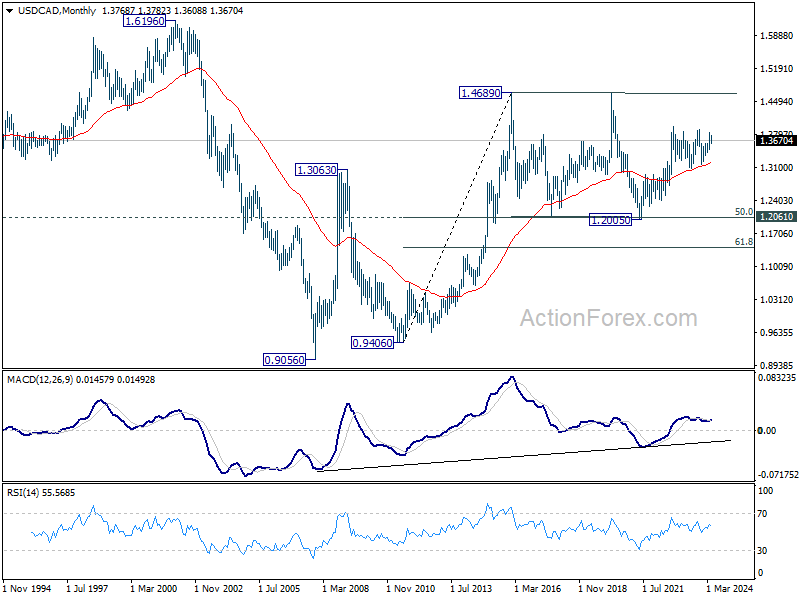
In the longer term picture, price actions from 1.4689 (2016 high) are seen as a consolidation pattern, which might have completed at 1.2005. That is, up trend from 0.9506 (2007 low) is expected to resume at a later stage. This will remain the favored case as long as 1.2947 resistance turned support holds.