Sample Category Title
Yen and Dollar Face Fresh Selling Pressure in Quiet Market
Fresh selling is seen in Yen and Dollar in early US session, as the markets are going through a quiet day. There is no immediate fundamental catalyst identified for these movements. Traders might be repositioning ahead of significant US economic data releases scheduled for later in the week. Producer Price Index on Tuesday will offer early insights into upstream inflation, but the primary focus remains on Wednesday's Consumer Price Index release.
Meanwhile, Australian Dollar is trading as the strongest performer, dismissing weak business conditions data. Aussie is set to face its own pivotal moment with the release of employment data on Thursday. Euro and Sterling follow as the second and third strongest currencies, respectively, with traders looking forward to German ZEW economic sentiment data and UK employment figures due tomorrow. New Zealand Dollar turn mixed, recovering from earlier selloff, while Canadian Dollar and Swiss Franc are mixed in the middle.
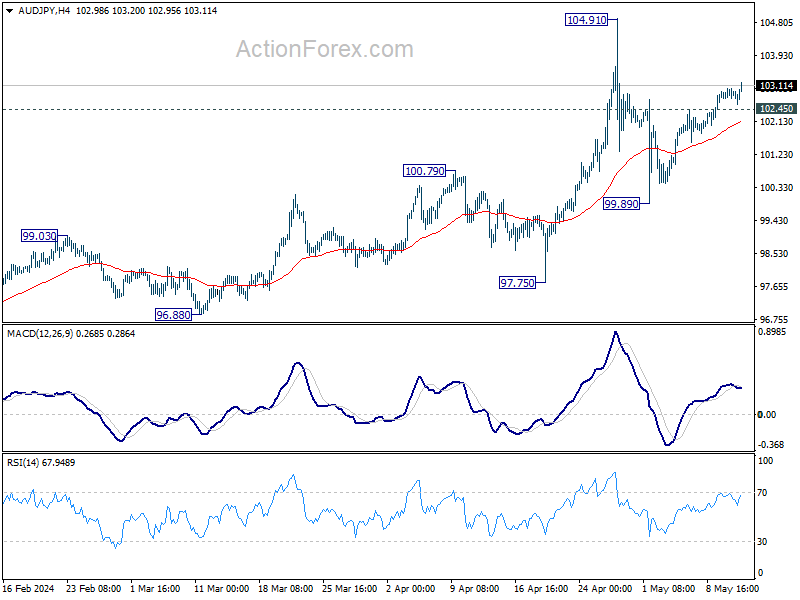
Technically, AUD/JPY's rebound continues today. Further rally is in favor as long as 102.45 minor support holds, despite loss of upside momentum as seen in 4H MACD. Rise from 99.89 is seen as the second leg of the corrective pattern from 104.91. Hence, upside should be capped by this resistance. On the downside, break of 102.45 will argue that the pattern has already started the third leg for 99.89 support.
In Europe, at the time of writing, FTSE is down -0.21%. DAX is down -0.25%. CAC is down -0.24%. UK 10-year yield is down -0.0335 at 4.140. Germany 10-year yield is down -0.302 at 2.494. Earlier in Asia, Nikkei fell -0.13%. Hong Kong HSI rose 0.80%. China Shanghai SSE fell -0.21%. Singapore Strait Times rose 0.39%. Japan 10-year JGB yield rose 0.0315 to 0.941.
China launches ultra-long bond sale
China's Ministry of Finance announced it will commence the sale of the first batch of a significant issuance of ultra-long special sovereign bonds this week, with plans to distribute CNY 1T across various tenors ranging from 20 to 50 years.
The ministry detailed that 30-year bonds would be issued in twelve tranches stretching from May 17 to November 15. Additionally, 20-year bonds will begin selling in seven phases starting May 24. 50-year bonds are scheduled for issuance in three parts, also commencing on May 17.
China's Premier Li Qiang has emphasized the importance of these bonds in supporting the execution of major national strategies and enhancing security capabilities in critical sectors, as reported by state media.
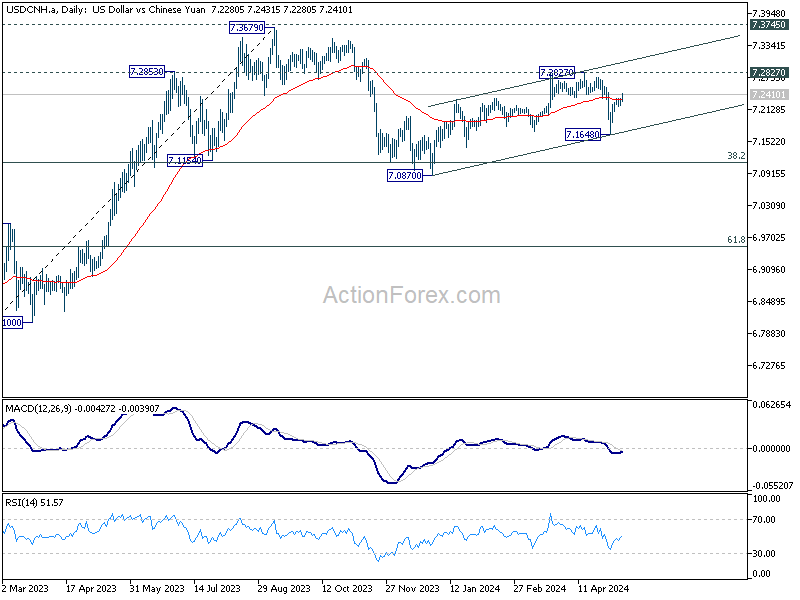
USD/CNH resumed the rebound from 7.1648 today, and the break of 55 D EMA argues that pull back from 7.2827 has completed already. Retest of 7.2827 will resume whole rise from 7.0870, as the second leg of the corrective pattern from 7.3679.
RBNZ survey shows moderating short-term inflation expectations
According to RBNZ Business Expectations Survey for Q2, respondents have lowered their expectations for CPI inflation in both the short-term and medium-term, while their long-term CPI inflation expectations have remained stable.
Specifically, one-year-ahead annual inflation expectations have notably decreased by 49 bps, moving from 3.22% to 2.73%. Two-year-ahead inflation expectations also saw a decline from 2.50% to 2.33%. Five-year-ahead inflation expectations are holding steady at 2.25%. Ten-year-ahead expectations edged up slightly by 3bps, from 2.16% to 2.19%.
Regarding the Official Cash Rate, survey respondents anticipate that it to 5.46% by the end Q2, similar to current rate at 5.50%. Looking further ahead, they forecast a reduction in OCR to 4.79% by the end of Q1 2025, marking a slight increase from last quarter's prediction of 4.74%. These expectations align with anticipation of approximately three rate cuts by the end of Q1 next year.
NZ BNZ services dips to 47.1, lowest since early 2022
New Zealand's BusinessNZ Performance of Services Index ticked down from 47.2 to 47.1 in April, marking the lowest level since January 2022.
Breaking down the components of the index reveals mixed signals: Activity and sales saw a modest improvement, rising from 44.8 to 46.5. However, employment took a downturn, dropping from 49.9 to 47.1, recording its lowest level since February 2022. New orders and business also declined slightly to 47.1, from 47.9. Stocks and inventories remained unchanged at 46.6, while supplier deliveries worsened, falling from 48.6 to 47.6—the lowest since November 2022.
The feedback from businesses has increasingly skewed negative, with 66.3% of comments in April being pessimistic, up from 63.0% in March and 57.3% in February. Many respondents highlighted the difficult economic environment and persistent inflationary pressures as significant concerns.
Doug Steel, a senior economist at BNZ, commented on the broader implications of these figures, stating, "combining today's weak PSI with last week's PMI yields a composite reading that would be consistent with GDP tracking below year earlier levels into the middle of this year." He further noted that the combined index suggests there could be "some downside risk" to their current economic forecasts.
Australia's NAB business confidence steady at 1, conditions normalize with slowing cost growth
Australia's NAB Business Confidence held steady at 1 in April. Business Conditions index fell from from 9 to 7. Notably, trading conditions declined from 15 to 12, while profitability was unchanged at 6. A significant reduction was observed in employment conditions, which dropped from 6 to 2.
NAB Chief Economist Alan Oster reflected on these figures: "All three components of business conditions were back at their long-run averages in April." He described this as a milestone, marking a normalization after the unusually high levels of 2022, "reflecting slowing economic growth."
Labour cost growth decreased to 1.5% from 1.7%, and purchase cost growth slowed to 1.2% from 1.5%. Meanwhile, product price growth rose slightly to 0.9% from 0.7%. Retail price growth moderated significantly to 0.9% from 1.4%.
Oster noted, "There was some further improvement in the pace of cost growth in April, and a step down in the pace of retail price growth." He suggested these changes could indicate easing in inflation in the second quarter, though further observation is needed to confirm this trend.
EUR/USD Mid-Day Outlook
Daily Pivots: (S1) 1.0757; (P) 1.0773; (R1) 1.0787; More...
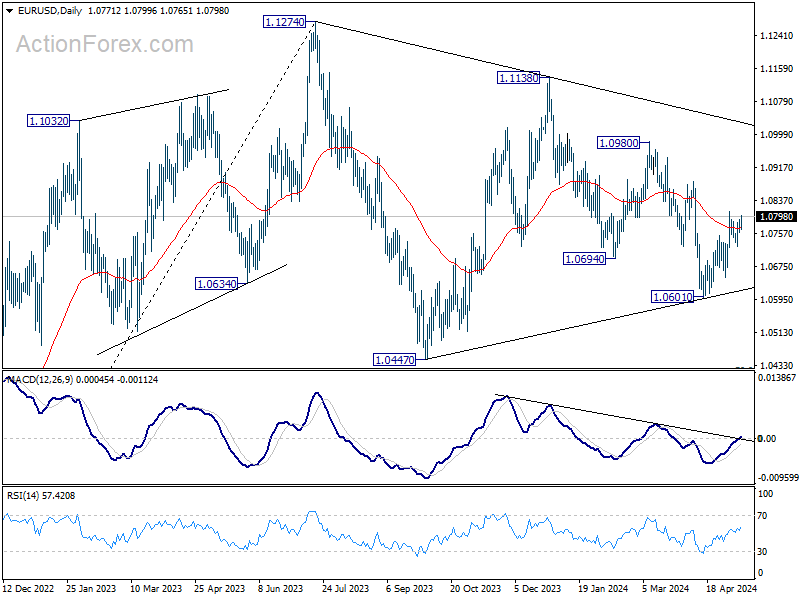
EUR/USD is staying below 1.0810 resistance despite today's rise. Intraday bias remains neutral at this point. Further rally is expected as long as 55 4H EMA (now at 1.0751) holds. On the upside, above 1.0810 will resume the rebound from 1.0601 to 1.0884 resistance next. However, firm break of 55 4H EMA will argue that the rebound has completed, and turn bias to the downside for 1.0648 support instead.
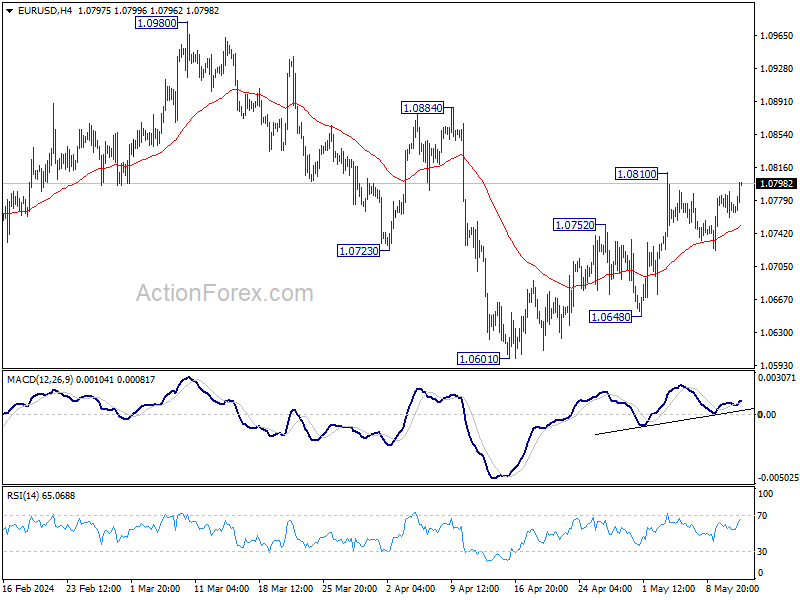
In the bigger picture, price actions from 1.1274 are viewed as a corrective pattern. Fall from 1.1138 is seen as the third leg and could have completed. Firm break of 1.1138 will argue that larger up trend from 0.9534 (2022 low) is ready to resume through 1.1274 high. On the downside, break of 1.0601 will extend the corrective pattern instead.
Economic Indicators Update
| GMT | Ccy | Events | Actual | Forecast | Previous | Revised |
|---|---|---|---|---|---|---|
| 22:30 | NZD | Business NZ PSI Apr | 47.1 | 47.5 | 47.2 | |
| 23:50 | JPY | Money Supply M2+CD Y/Y Apr | 2.20% | 2.50% | ||
| 01:30 | AUD | NAB Business Confidence Apr | 1 | 1 | ||
| 01:30 | AUD | NAB Business Conditions Apr | 7 | 9 | ||
| 03:00 | NZD | RBNZ Inflation Expectations Q/Q Q2 | 2.33% | 2.50% | ||
| 07:00 | CHF | SECO Consumer Climate Q2 | -38 | -40 | -38 | |
| 12:30 | CAD | Building Permits M/M Mar | -11.70% | -4.60% | 9.30% | 8.90% |
GBP/USD Higher With Eye on Employment Report
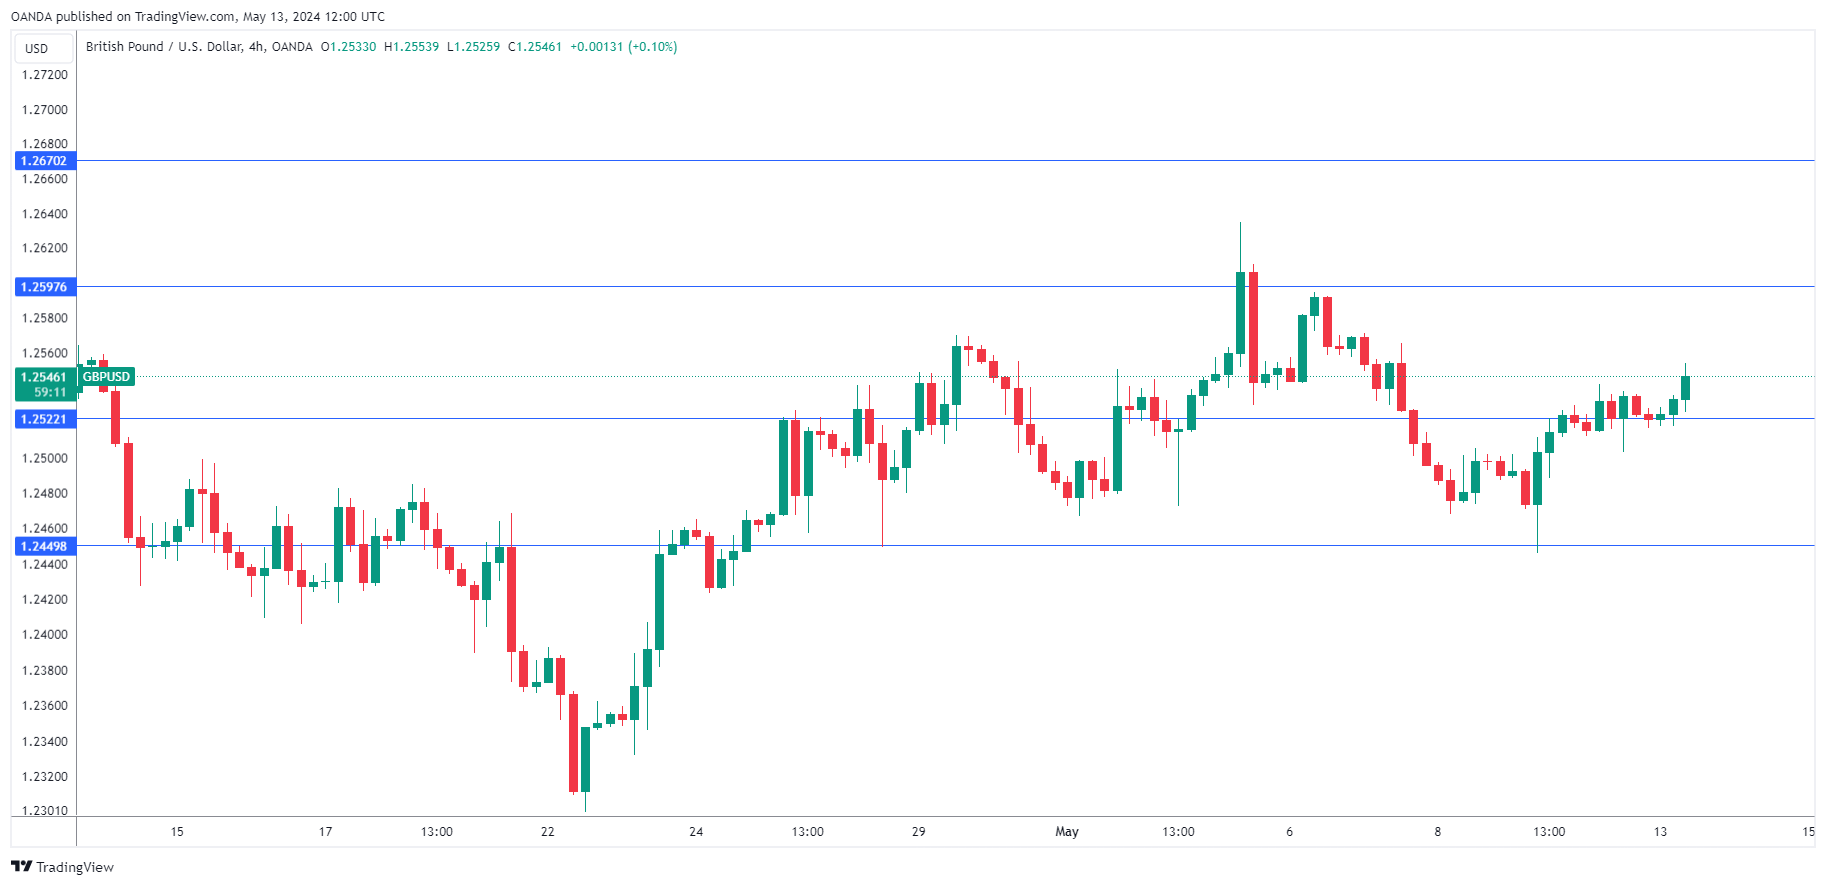
The British pound is slightly higher on Monday. GBP/USD is up 0.20%, trading at 1.2549 in the European session at the time of writing.
UK job growth expected to slide
The UK labor market has held up well despite high interest rates but cracks have appeared and Tuesday’s job report is expected to be soft. Employment change is expected to slide by 215,000 in the three months to March, after declining by 156,000 in the previous release.UK wage growth including bonuses is forecast to fall to 5.3%, down from 5.6% and the unemployment rate is expected to creep up to 4.3%, up from 4.2%.
The Bank of England will be keeping a close eye on Tuesday’s employment report. A decline in employment and wage growth will indicate that the labor market continues to cool down which could complicate the BoE’s plans to lower interest rates.
The UK ended last week on a high note, as GDP grew 0.6% q/q in the first quarter, higher than the 0.4% market estimate. The stronger data still left a question mark about the central bank’s rate path, as the market pricing of a rate cut in June is around 48%. BoE Governor was non-committal about a June hike at his press conference at last week’s policy meeting. Still, Bailey didn’t rule out a June hike and said that he was “optimistic that things are moving in the right direction”.
In the US, the University of Michigan consumer confidence index fell to 67.4 in May, compared to 77.2 in April and shy of the market estimate of 76.2. One-year inflation expectations rose from 3.2% to 3.5%, which indicates that consumers are less confident about inflation receding.
GBP/USD Technical
- GBP/USD tested support at 1.2522 earlier. Below, there is support at 1.2449
- 1.2597 and 1.2680 are the next resistance lines
China launches ultra-long bond sale
China's Ministry of Finance announced it will commence the sale of the first batch of a significant issuance of ultra-long special sovereign bonds this week, with plans to distribute CNY 1T across various tenors ranging from 20 to 50 years.
The ministry detailed that 30-year bonds would be issued in twelve tranches stretching from May 17 to November 15. Additionally, 20-year bonds will begin selling in seven phases starting May 24. 50-year bonds are scheduled for issuance in three parts, also commencing on May 17.
China's Premier Li Qiang has emphasized the importance of these bonds in supporting the execution of major national strategies and enhancing security capabilities in critical sectors, as reported by state media.
USD/CNH resumed the rebound from 7.1648 today, and the break of 55 D EMA argues that pull back from 7.2827 has completed already. Retest of 7.2827 will resume whole rise from 7.0870, as the second leg of the corrective pattern from 7.3679.
NZ Dollar Edges Lower as Inflation Expectations Fall
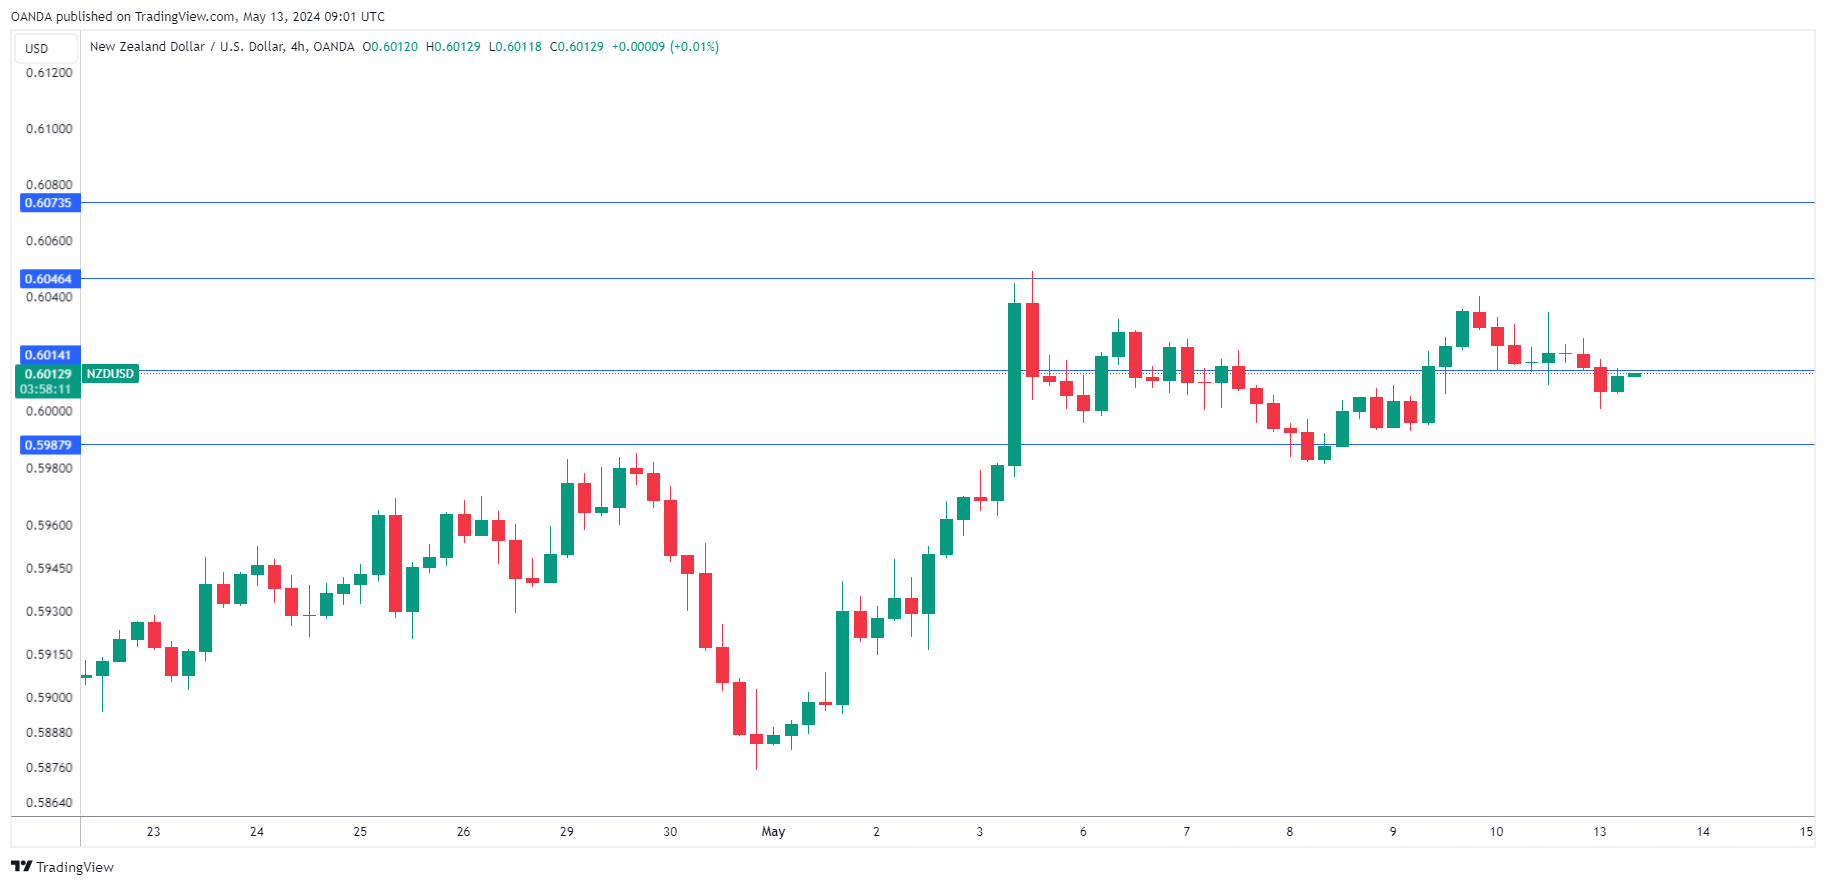
The New Zealand dollar has edged lower on Monday. NZD/USD is down 0.17% on the day, trading at 0.6009 in the European session at the time of writing.
NZ inflation expectations ease to 2.3%
New Zealand’s inflation expectations fell to 2.3% in the second quarter, its lowest point since Q3 2021. This marked a third straight deceleration and the New Zealand dollar responded with modest losses. The steady drop in inflation expectations is an encouraging sign for the Reserve Bank of New Zealand but won’t translate into a rate cut in the near-term.
The New Zealand economy is sputtering and inflation fell to 4% in the first quarter, down from 4.7% in the fourth-quarter of 2023. Inflation is expected to continue falling but it has been stickier than expected and remains above the upper range of the 1-3% target band.
The central bank has shown its willingness to continue a “higher for longer stance” and has maintained the cash rate at 5.25% for six successive times. RBNZ policy makers are reluctant to start lowering rates until there is evidence that inflation will remain sustainable around 2% and that goal may not be achieved until 2025. The money markets expect the RBNZ to start cutting in the fourth quarter. The RBNZ meets next on May 22nd.
Last week, The Organization for Economic Cooperation and Development (OECD) stated that New Zealand’s inflation is “likely to be persistent” and urged the RBNZ not to lower rates until there was “clear evidence that inflation will fall to the middle of the RBNZ’s target range”. The OECD report noted that it was “uncertain” when inflation would fall to the RBNZ’s target range and there was a risk of “further negative global shocks”.
NZD/USD Technical
- NZD/USD is testing support at 0.6014. Below, there is support at 0.5987
- 0.6046 and 0.6073 are the next resistance lines
US 100 Index Hovers Above Cloud as Rebound Loses Steam
- US 100 stock index eyes March all-time high
- But latest upleg may have run its course
- Is a correction on the way or is a record peak in sight?
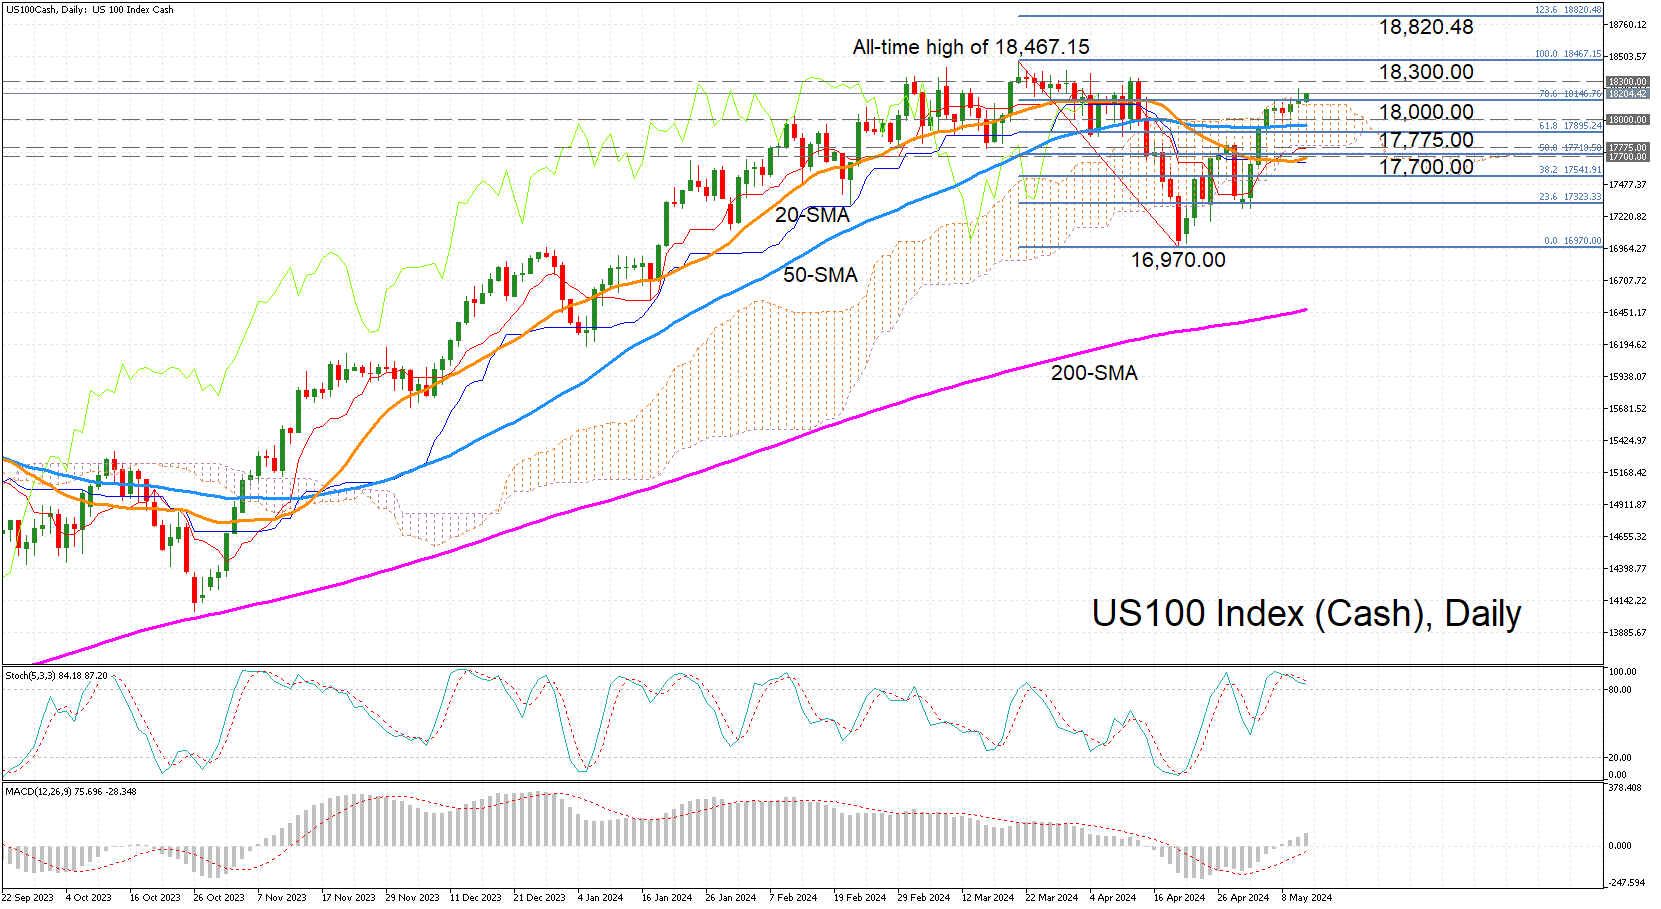
The US 100 stock index (cash) has recovered by more than 7% from the April dip when it hit a three-month low of 16,970.00. But despite climbing on top of the Ichimoku cloud and surpassing the 18,000.00 level, the bullish prospects for the near term have started to fade.
The stochastics are negatively aligned and edging lower within the overbought territory, while the 20-day simple moving average (SMA) has only just started to turn upwards. However, the MACD continues to send positive signals as it’s still rising above zero and above its red signal line.
If the bulls stay in charge, there could be some resistance near 18,300.00, as this has been a congested area in the past. Overcoming it would boost the index’s chances of challenging its record high of 18,467.15 and open the way for the 123.6% Fibonacci extension of the March-April downtrend at 18,820.48.
However, if the price slips back inside the Ichimoku cloud, the 18,000.00 mark is likely to be tested again – a support region that is signified by the 50-day SMA lurking slightly below it. Lower down, there are further strong support zones consisting of the cloud bottom and Tenkan-sen line around 17,775.00, and the 20-day SMA and 50% Fibonacci retracement around 17,700.00.
Should these barriers fail, the US 100 would be at risk of revisiting the April trough and entering a new bearish phase. But to sum up, as long as the price holds above the cloud, the short-term prospects should remain bullish, as should the longer-term outlook.
Crypto Market Under Pressure from Bitcoin
Market picture
Crypto market cap on Monday stands at $2.2 trillion, down 5.2% over seven days, although it showed some growth over the weekend. Local market capitalisation peaked on March 14th, but the active decline began about a month ago, with a sequence of lower lows and lower highs.
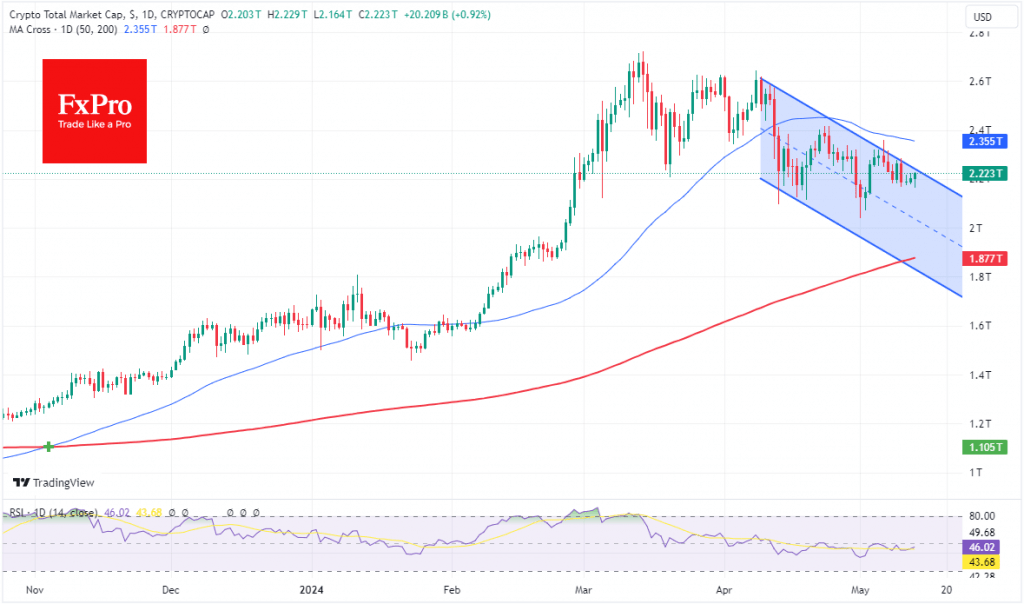
During the previous week, the crypto market held near the upper boundary of the descending channel. Cryptocurrencies are being helped by increased risk traction in stock markets. Still, there is also internal pressure, likely related to asset sell-offs by miners and fears of tighter regulation of cryptocurrencies.
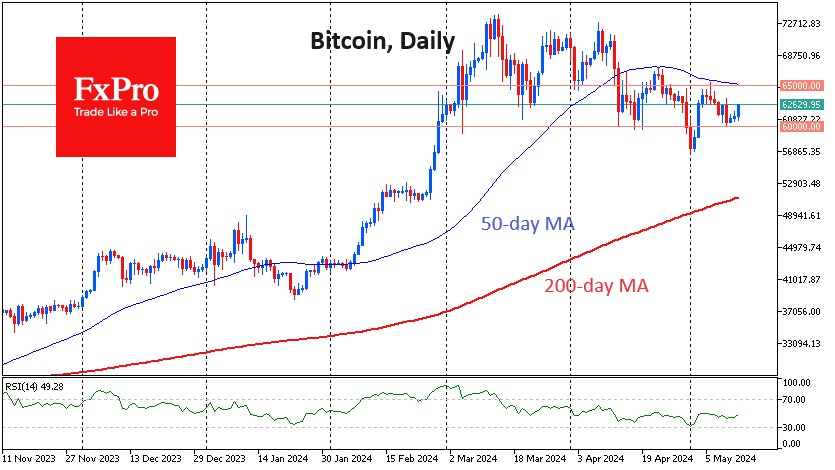
Bitcoin is largely negatively impacting the overall performance of the crypto market right now. However, it has been finding plenty of buyer interest over the past two months, on a decline towards $60K. A failure below it could trigger something of a panic sell-off. The positive scenario, in our opinion, will become the main one with a rise above $65K, fixing the price at the 50-day moving average and the reversal area in early May.
News background
US venture capital fund Pantera Capital said it has invested a record amount in TON, which has not yet been disclosed. Pantera attributed the decision to invest in TON to the project’s potential to become one of the largest crypto networks. Toncoin (TON) rose nearly 20 per cent over the week, showing the best growth in the top 100 cryptocurrencies.
Ethereum co-founder Joseph Lubin said the US SEC is deliberately hindering innovation, threatening the future of the country’s financial system. According to him, “It looks like the SEC has reclassified Ethereum into a security without telling anyone.”
ARK Invest and 21Shares have excluded staking from the application to launch a spot Ethereum-ETF. This situation may indicate an attempt to “tidy up the paperwork” based on SEC comments despite the lack of official statements, according to Bloomberg.
Factor’s CEO Peter Brandt suggested that cryptocurrency staking could soon be recognised as an illegal activity.
According to a report for the SEC, Susquehanna, a trading and technology behemoth with $481bn in assets under management, has invested $1.2bn in various spot bitcoin ETFs.
Could Wednesday’s CPI Report Change Fed’s Rate Outlook?
- US CPI inflation forecast to have eased a bit in April
- Retail sales to reveal the domestic demand’s strength
- Dollar might benefit from a strong inflation print but stocks could suffer
- The April CPI report will be released on Wednesday 12:30 GMT
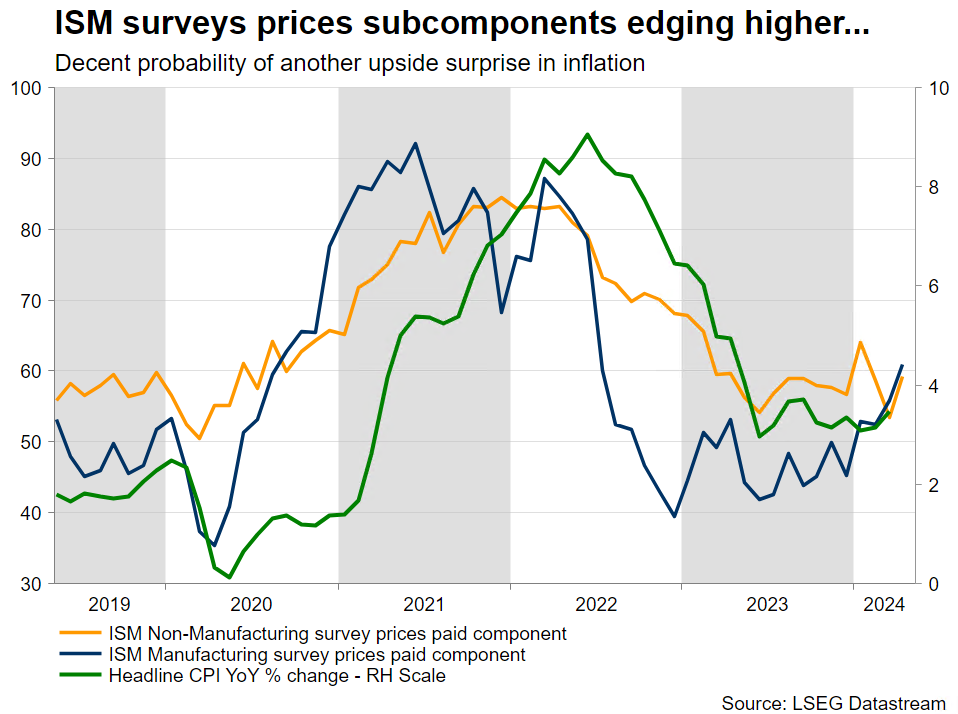
The aggressive deceleration in US inflation seen during 2022 has paused over the past few months with CPI proving stickier than widely expected. As a result, the market is now expecting just 42bps of monetary policy easing by the Fed during 2024 with the CPI dataset continuing to have a significant market impact.
What has happened since the last CPI report?
Last month, both the headline and core CPI components for March managed to surprise the market by printing above expectations. The US dollar enjoyed a boost across the board, but US stocks suffered as the probability of a June rate cut by the Fed dropped aggressively.
Since then, the data flow has been mostly on the weak side. Except for retail sales, the economy appears to be slowing down as made evident by the various business surveys, the preliminary GDP print of the first quarter of 2024 and the recent labour market report. However, various inflation indicators point to continued price pressures.
This is the main reason why the May 1 Fed meeting was relatively balanced. Fed members understand the need for patience as the economy progresses. Cutting rates at this juncture might further fuel the strong domestic demand, partly responsible for the current inflation stickiness, and potentially cause a heated reaction from the Republican Presidential candidate, Donald Trump.
The April CPI report will be released on Wednesday
The market is expecting a small deceleration across the board as the headline figure is seen rising by 3.4% year-on-year with the core indicator, which excludes food and energy prices, edging lower to 3.6% yoy. With both the food and energy price pressures remaining weak, the focus will be on shelter.
Considering this sector’s weight to the overall CPI figure, a further deceleration in shelter costs appears vital to opening the door to Fed rate cuts. House prices turned the corner about a year ago and are currently recording steady yearly growth. Assuming that there is a 12-18 months lag between house prices and shelter costs, there is an increasing possibility of the latter continuing its recent slowdown.
Will the Fed react to the CPI report?
There are two inflation reports until the June 12 Fed meeting. The market is currently assigning only a 5% probability for a June rate cut, with this percentage rising considerably for the September meeting. This market pricing matches the updated Fed expectations by certain key investment houses looking for just two rate cuts in 2024.
Considering the multiple Fed members’ appearances arranged for this week, one should expect a plethora of commentary on the inflation report. Rather conveniently, one of the arch hawks of the FOMC, Minneapolis President Kashkari, will be on the wires on Wednesday. He will most likely remain hawkish if CPI does not significantly surprise on the downside.
Strong market reaction upon another CPI shock
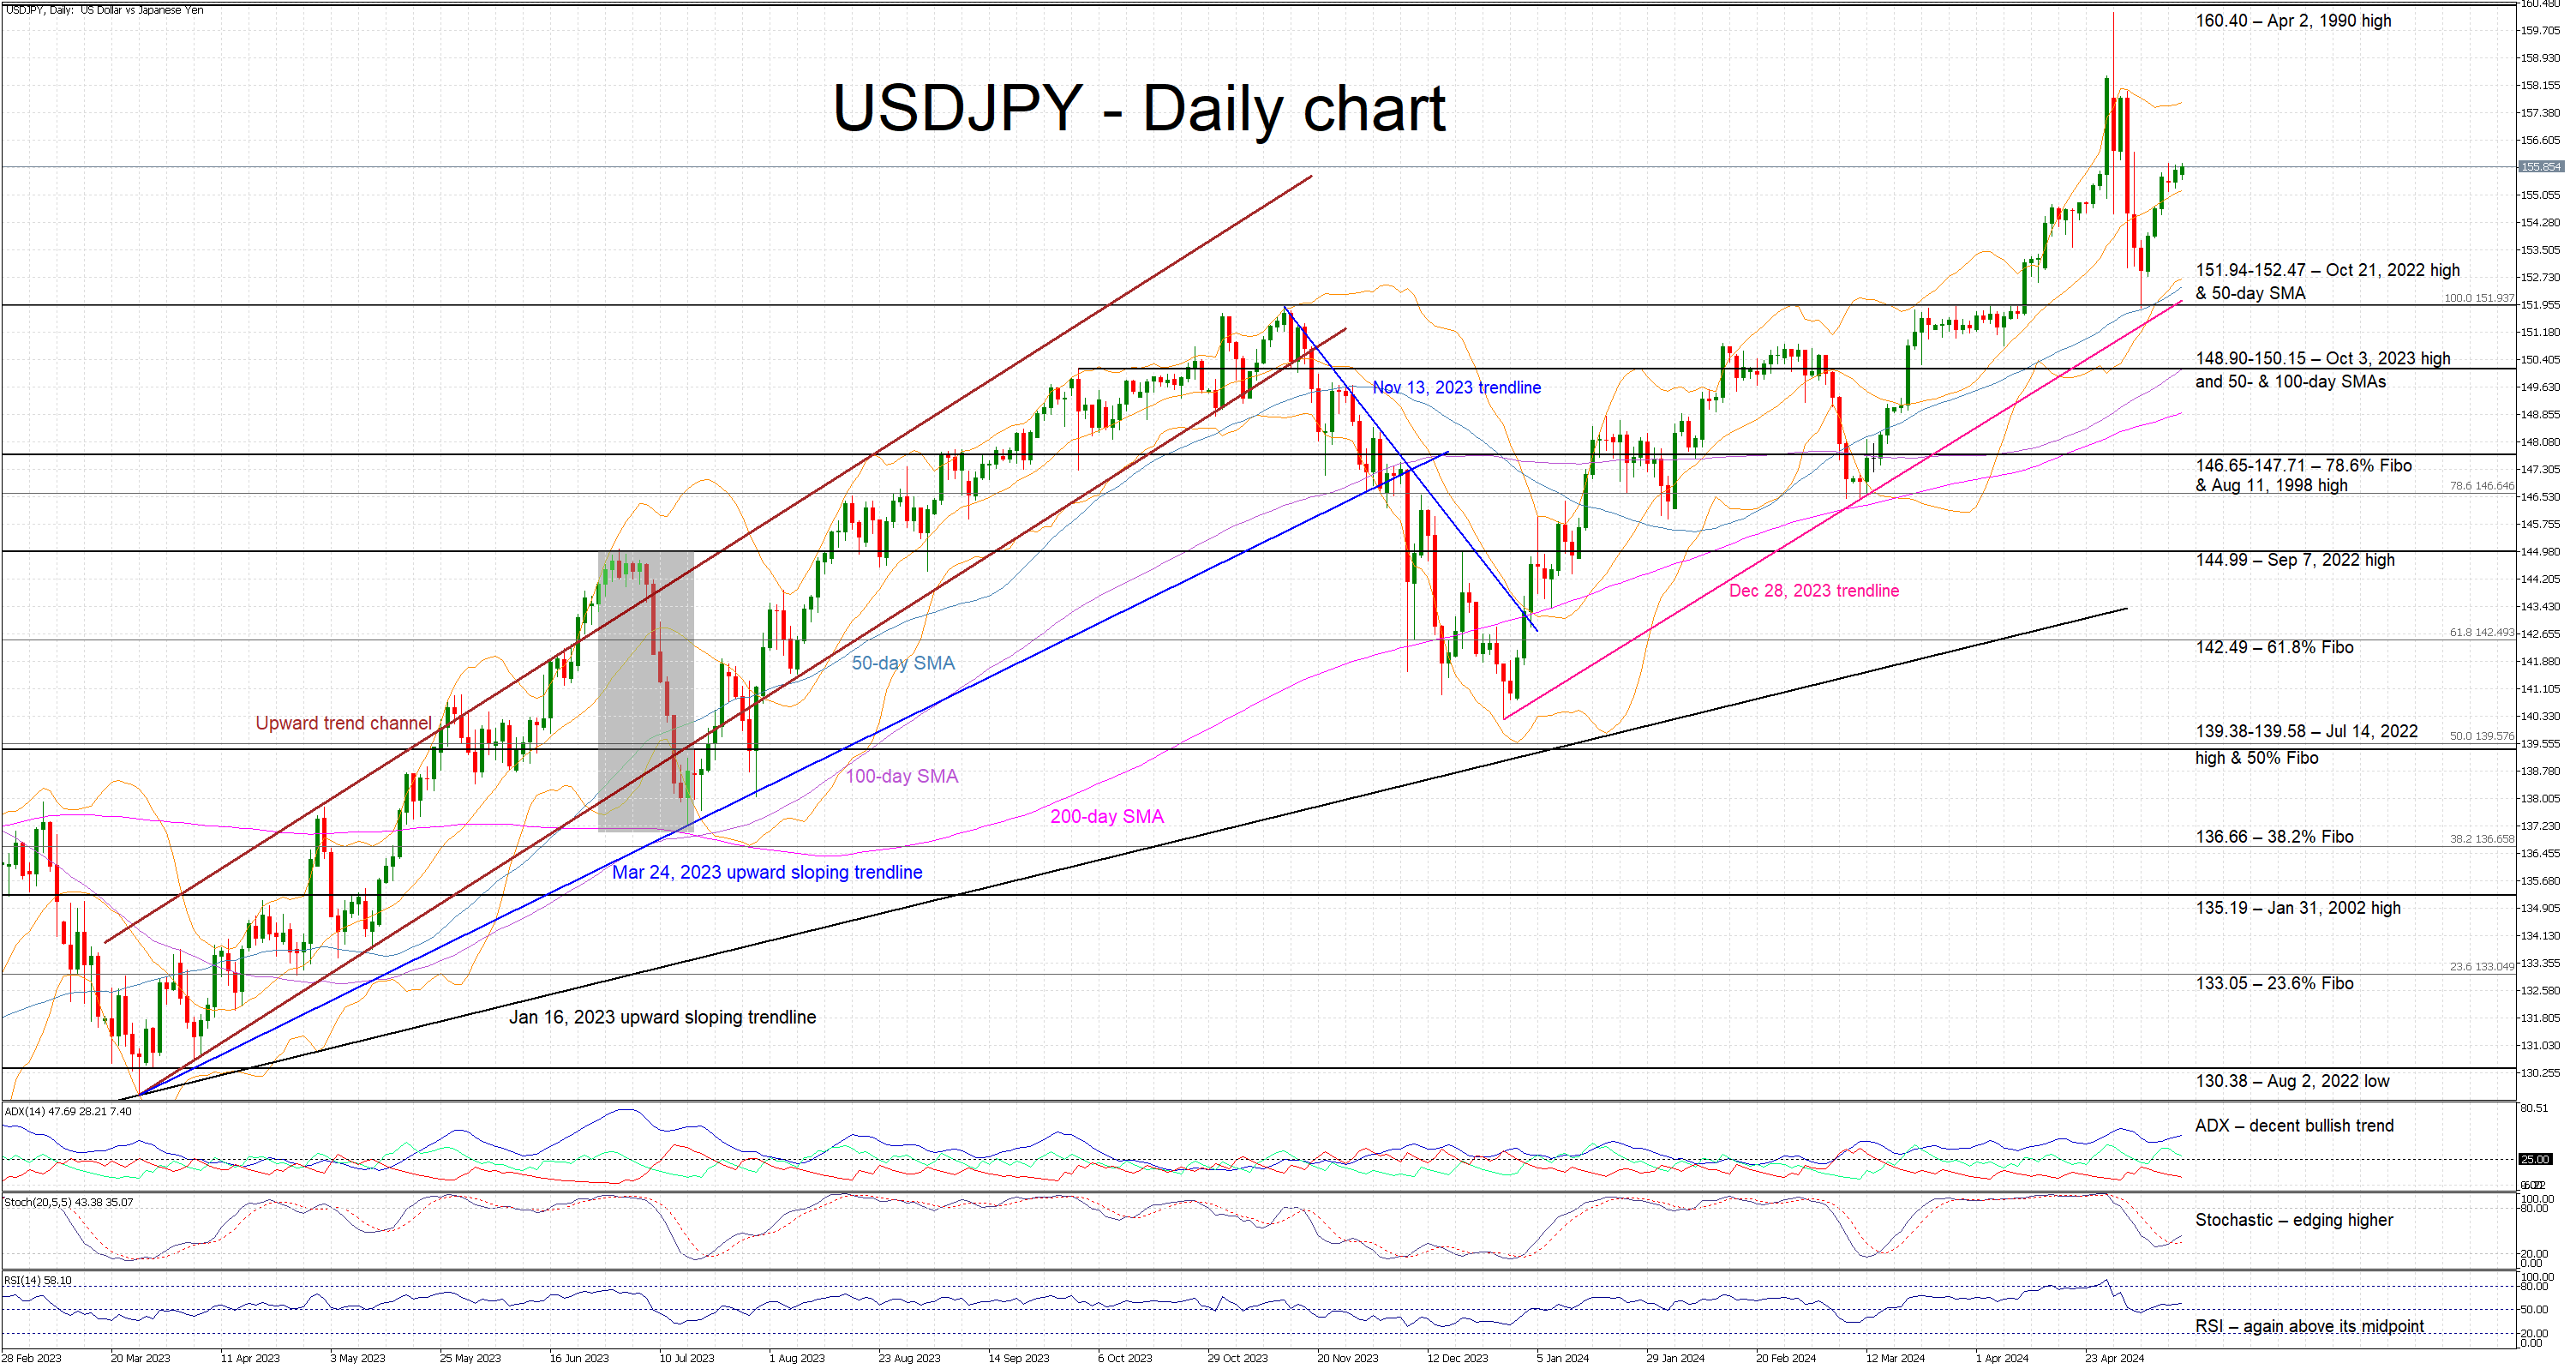
Should both the headline and core subcomponent surprise again to the upside, US equities stand to suffer, especially if retail sales released also on Wednesday point to an undying spending thirst from US consumers. The dollar could cancel out part of last week’s underperformance against the euro and fuel another rally in dollar/yen. More specifically, a move towards the recent 160.40 high could be on the cards, possibly forcing the BoJ to intervene again in the market.
On the flip side, a weaker inflation report could result in a significant upleg in US equities, especially if the headline CPI figure falls below the 3% threshold. The dollar might be under pressure with the euro/dollar pair finally managing to rally above the converging simple moving averages at the 1.0784-1.0821 range. Similarly, dollar/yen could reverse last week’s bullish move with the October 21, 2022 high of 151.94 looking like a plausible target.
Gold Loses Some Ground But Still Bullish
- Gold loses momentum after reaching a two-week high
- Short-term risk remains skewed to the upside above 2,325
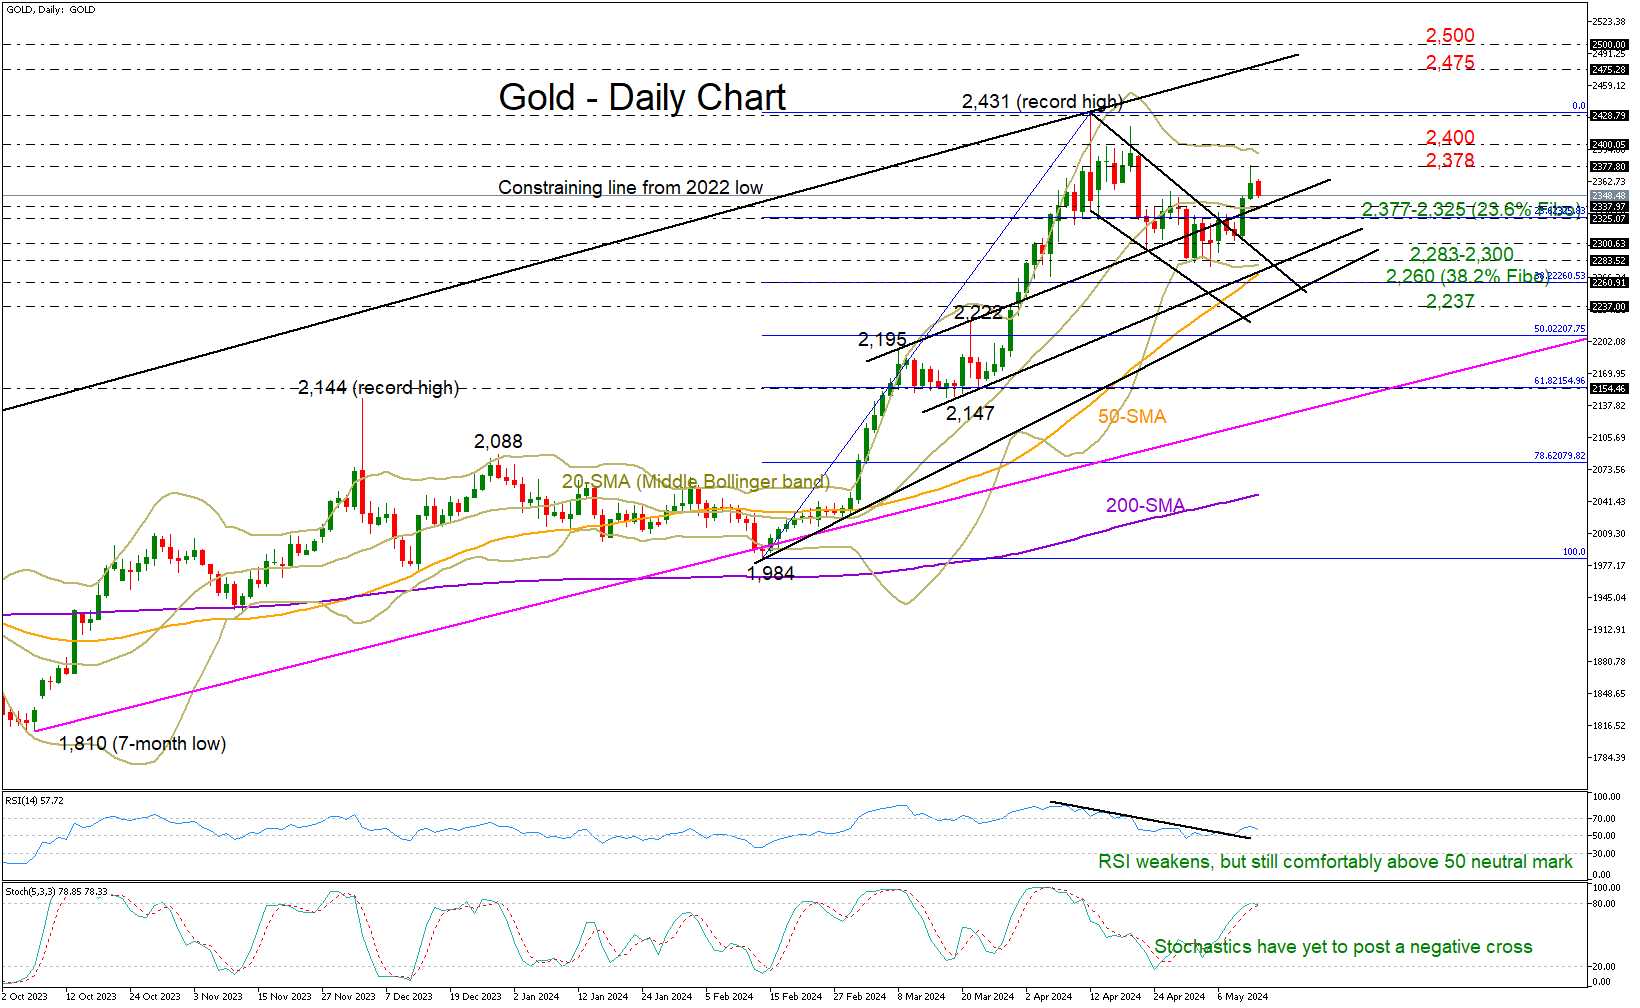
The week began with gold losing ground and giving up the gains it made on Friday when it reached a two-week high of 2,378.
Technically, the bounce back above the resistance line from March and the 20-day simple moving average (EMA) feeds optimism that the latest upturn could resume as the RSI keeps fluctuating clearly above its 50 neutral mark and the price has yet to reach the upper Bollinger band.
Still, if the current bearish pressures strengthen below the 2,325-2,337 area, reducing the odds for a bullish continuation, the focus might shift to the 2,283-2,300 trendline territory where the 50-day SMA is converging. Should the bears breach the 38.2% Fibonacci retracement of the February-April uptrend at 2,260 too, the decline could then stretch towards the support trendline from February seen at 2,237.
Should the opposite scenario occur, the bulls might aim to breach the range of 2,378 to 2,400, with the possibility of retesting the all-time high of 2,431 or creating a new higher high between the ascending line from the 2022 low at 2,475 and the psychological level of 2,500.
All in all, the latest rebound in the market might remain attractive in the short term if the price manages to hold above 2,337-2,325. Otherwise, the yellow metal might revisit May’s lows.
Gold Price (XAU/USD) Is Testing an Important Resistance Zone
On April 16, we wrote why the $2,380 zone is an important resistance area.
The XAU/USD chart shows that:
1) After fading fluctuations (they formed a narrowing consolidation triangle - shown in green), the price of gold dropped sharply (shown by a black arrow) on April 22-23.
2) Then, the price found support in the form of the lower border of the ascending channel (shown in blue), which has been in effect since the beginning of March. This led to the formation of another consolidation pattern between the blue lines.
3) An upward breakdown of the red lines on May 9 could be interpreted as an attempt by the bulls to resume the upward trend within the blue channel, but we could expect that the green triangle with its axis around 2380 would provide resistance.
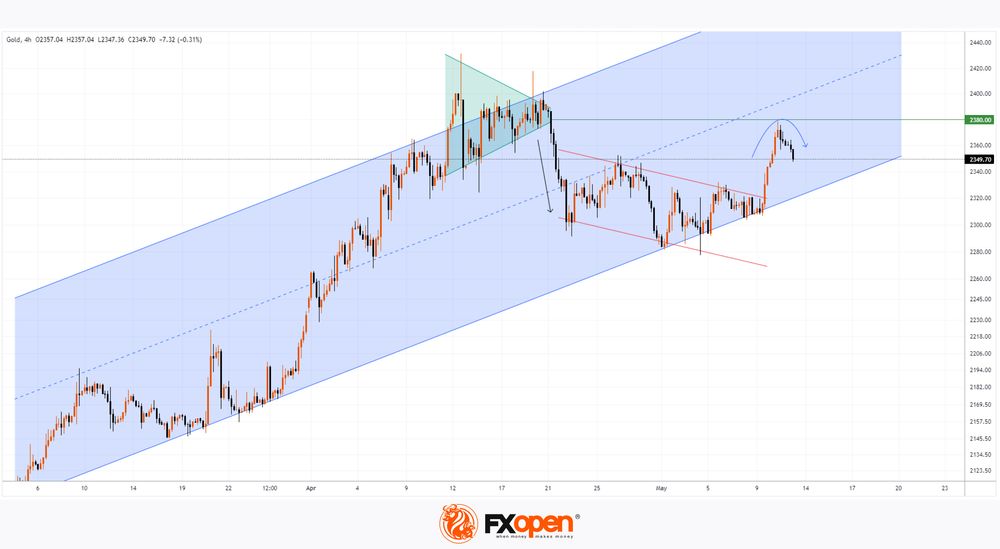
However, it is important to pay attention to the nature of buyers’ behaviour when the price approaches an important resistance - the XAU/USD chart shows that the bulls’ persistence has quickly depleted. From the point of view of technical analysis of the gold price, a bearish engulfing has formed on the chart (shown by a blue arrow) in the area of 2380. In other words, the price of gold tested the resistance level, revealing the activity of bears defending their territory.
From the point of view of fundamental analysis, market participants can position themselves ahead of the key news for the beginning of the week: the CPI index will be published on Wednesday at 15:30 GMT+3.
But if economic or geopolitical news does not change the balance, in which, as we observe, the initiative is on the side of the bears, then this may create a threat of a breakdown of the blue channel’s lower border.
Fed Speak Cemented Higher-for-Longer Case Last Week
Markets
Fed speak cemented the higher-for-longer case last week. On Friday, governor Bowman said she doesn’t expect any policy rate cuts this year. Following three or four months on inflation disappointments, she wants to see a number of months of progress (and a number of probably meetings as well) to be confident that inflation is returning to the 2% target. Earlier in the week, Boston Fed Collins, SF Fed Daly and Atlanta Fed Bostic all said that reaching that confidence will “take more time” than previously thought with Minneapolis Fed Kashkari also hinting that policy rates will remain at the peak levels for an extended period of time. Chicago Fed Goolsbee, dove by nature, was the odd one out last week. He said that he doesn’t see much evidence of inflation stalling out at 3%, but doesn’t want to tie his hands when it comes to the timing of making monetary policy less restrictive. Recent eco data confirmed the inflation threat/risks. Accelerating prices paid components for example clashed with weakening growth momentum in ISM surveys. Friday’s University of Michigan consumer survey showed a similar split. Economic sentiment hit a YtD low while inflation expectations rose to a YtD high for the short-term (1-yr; 3.5%) and the long-term (5-10-yr; 3.1%). US Treasuries underperformed German Bunds with US yields closing 5 bps (2-yr) to 3.1 bps (10-yr) higher. Changes on the German curve ranged between +3.1 bps (2-yr) and +2.1 bps (30-yr). Correcting oil prices ($84.5/b to $82.5/b) partially help explain the curve move. The dollar kept a narrow trading range with EUR/USD closing at 1.0771. The eco calendar is thin today with NY Fed inflation expectations and more Fed speak. US PPI data are a step-up tomorrow to Wednesday’s April CPI print. Retails sales are due the same day.
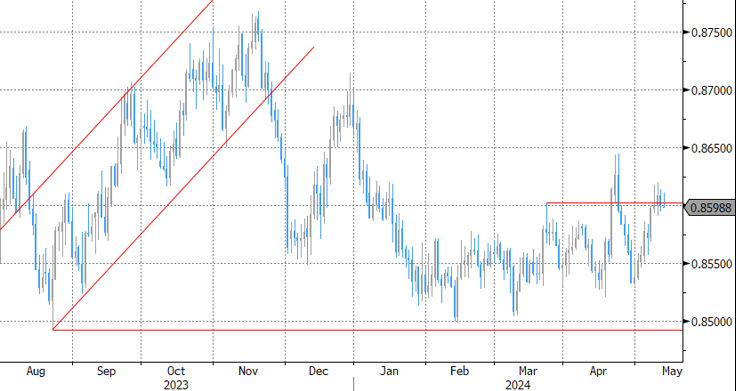
EUR/GBP closed the week below 0.86 (0.8595) even as the Bank of England May policy meeting suggested that the BoE could cut its policy rate when it meet next in June. BoE Ramsden joined Dhingra in already voting for a rate cut (7-2) with the forward guidance in the policy statement now extended with the sentence “The Committee will consider forthcoming data releases and how these inform the assessment that the risks from inflation persistence are receding”. New inflation forecasts (based on the current market rate path) suggest inflation to drop to 1.9% by Q2 2026 (from 2.2%) and to 1.6% by Q2 2027. It prompted comments by BoE governor Bailey that the central bank could end up easing somewhat more. This week’s labour market report and Q1 wage data (PAYE) will immediately give an indication if current market pricing (50% probability for June) is too conservative or not. We err on the side of a June rate cut, sticking with our negative GBP-bias.
News & Views
Chinese inflation rose by 0.1% M/M and 0.3% Y/Y in April, up from 0.1% Y/Y in March. Core inflation, excluding food and energy, rose 0.7% Y/Y (0.6% in March). Services price rose 0.8% Y/Y. Food prices continue to decline (-2.7% Y/Y). While slightly higher than expected, the data still indicate mediocre demand in the Chinese economy as authorities are putting in place a policy of balanced economic stimulus. Chinese producer price growth in April remained deep in deflationary territory at -2.5% Y/Y. Even as it improved from -2.8% in March, it remained lower than expected and negative since October 2022. Other data this weekend also showed that aggregate financing in the country unexpectedly declined in April, the first decline since 2005. Lower than expected government bond issuance and weak overall demand for borrowing contributed. In this respect, the government announced to start selling a total of CNY 1 tn government bonds with ultra-long maturities with a first sale of 30-y bonds expected as soon as next Friday.
US president Biden is rumoured to announce a sharp rise of tariffs of several (strategic) goods the country is importing from China. The US is said to maintain existing tariffs on many goods that were decided by the previous government. At the same time, tariffs would be raised in sectors like semi-conductors and solar equipment, batteries, but also steel and aluminum. The Tariff on Electrical Vehicles for China even is said to be raised from 27.5% to 102.5%.
Graphs
GE 10y yield
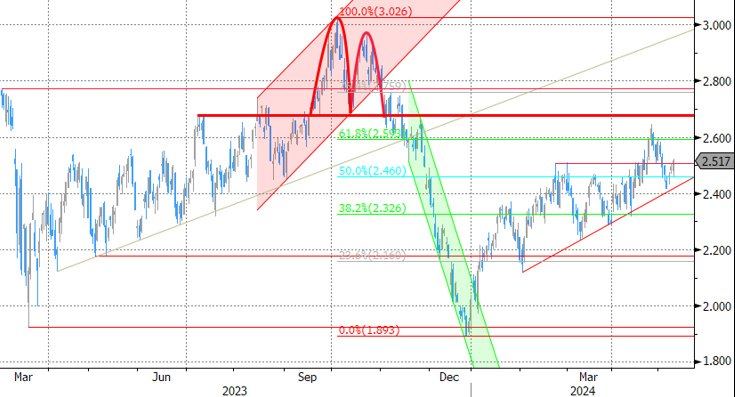
ECB President Lagarde clearly hinted at a summer (June) rate cut which has broad backing. EMU disinflation continued in April and brought headline CPI closer to the 2% target. Together with weak growth momentum, this gives backing to deliver a first 25 bps rate cut. A more bumpy inflation path in H2 2024 and the Fed’s higher for longer strategy make follow-up moves difficult. Markets have come to terms with that.
US 10y yield
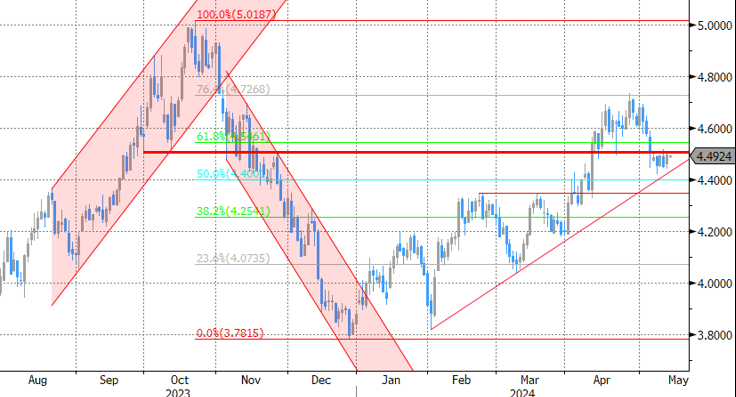
The Fed in May acknowledged the lack of progress towards the 2% inflation objective, but Fed’s Powell left the door open for rate cuts later this year. Soft US ISM’s and weaker than expected payrolls supported markets’ hope on a first cut post summer, triggering a correction off YTD peak levels. Sticky inflation suggests any rate cut will be a tough balancing act. 4.37% (38% retracement Dec/April) already might prove strong support for the US 10-y yield.
EUR/USD
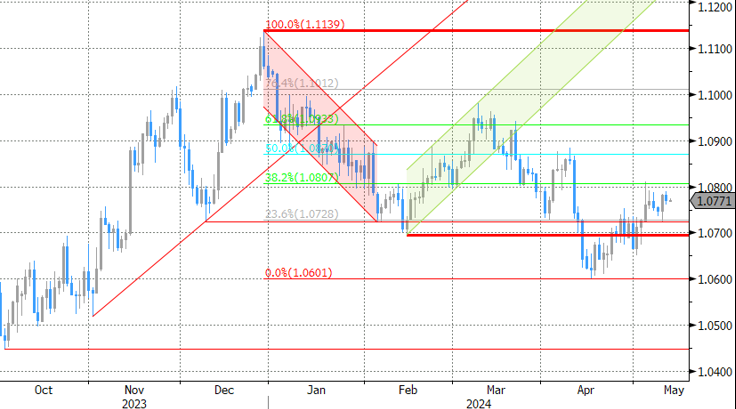
Economic divergence, a likely desynchronized rate cut cycle with the ECB exceptionally taking the lead and higher than expected US CPI data pushed EUR/USD to the 1.06 area. From there, better EMU data gave the euro some breathing space. The dollar lost further momentum on softer than expected early May US data. Some further consolidation in the 1.07/1.09 are might be on the cards short-term.
EUR/GBP
Debate at the Bank of England is focused at the timing of rate cuts. Most BoE members align with the ECB rather than with Fed view, suggesting that the disinflation process provides a window of opportunity to make policy less restrictive (in the near term). Sterling’s downside turned more vulnerable with the topside of the sideways EUR/GBP 0.8493 - 0.8768 trading range serving as the first real technical reference.