Sample Category Title
Gold Price Regains Strength While Crude Oil Price Recovers
Gold price started a fresh increase above $2,320. Crude oil is recovering and might rise toward the $81.20 resistance zone.
Important Takeaways for Gold and Oil Price Analysis Today
Gold price started a decent increase from the $2,300 zone against the US Dollar.
It broke a key descending channel with resistance at $2,315 on the hourly chart of gold at FXOpen.
Crude oil is recovering losses and trading above the $78.55 support.
There was a break above a connecting bearish trendline with resistance near $78.40 on the hourly chart of XTI/USD at FXOpen.
Gold Price Technical Analysis
On the hourly chart of Gold at FXOpen, the price formed support near the $2,275 zone, remained in a bullish zone, and started a strong increase above $2,300.
It broke a key descending channel with resistance at $2,315. The bulls even pushed the price above the $2,345 level and the 50-hour simple moving average. Finally, it traded as high as $2,358. XAU/USD is now consolidating gains near the $2,355 zone and the RSI is above 70.
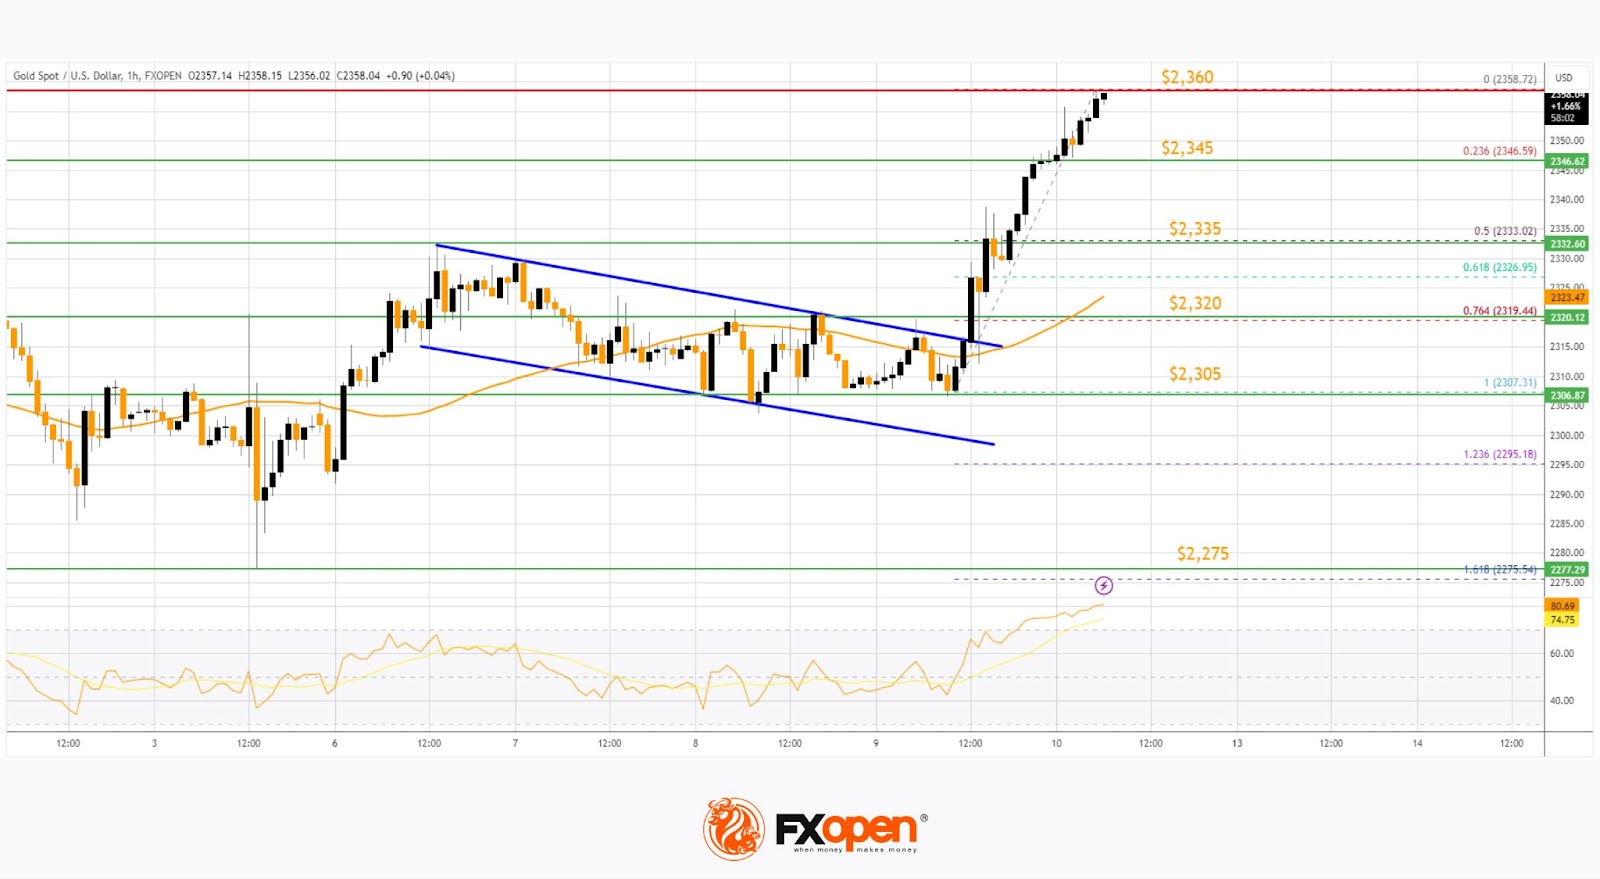
Initial support on the downside is near the 23.6% Fib retracement level of the upward move from the $2,307 swing low to the $2,358 high at $2,345.
The first major support is near the $2,335 zone. It is close to the 50% Fib retracement level of the upward move from the $2,307 swing low to the $2,358 high. If there is a downside break below the $2,335 support, the price might decline further.
In the stated case, the price might drop toward $2,320 and the 50-hour simple moving average.
Immediate resistance is near the $2,360 level. The next major resistance is near the $2,372 level. An upside break above the $2,372 resistance could send Gold price toward $2,385. Any more gains may perhaps set the pace for an increase toward the $2,400 level.
Oil Price Technical Analysis
On the FXOpen hourly chart of WTI Crude Oil, the price found support near the $76.70 zone, formed a base, and started a recovery wave above $77.75 and the 50-hour simple moving average.
The bulls were able to push the price above the 50% Fib retracement level of the downward move from the $81.22 swing high to the $76.68 swing low. Besides, there was a break above a connecting bearish trendline with a resistance near $78.40.
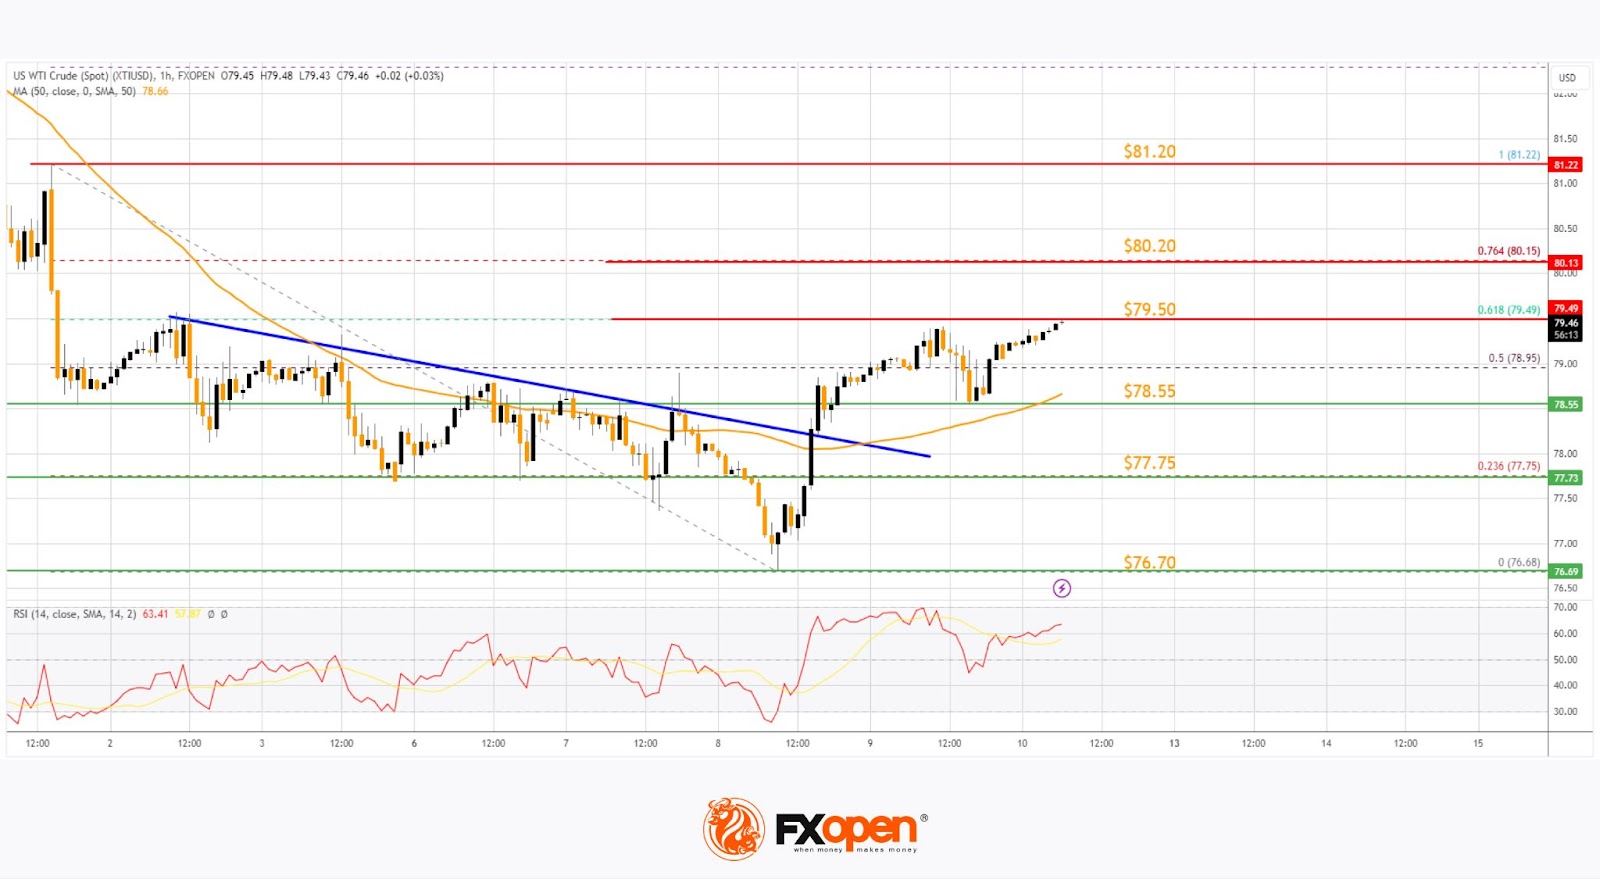
The hourly RSI is near the 65 level, but the price is struggling near $79.50. It is close to the 61.8% Fib retracement level of the downward move from the $81.22 swing high to the $76.68 swing low.
A clear move above $79.50 could send the price toward the $81.20 resistance. Any more gains might send the price toward the $83.00 level. Conversely, the price might start a fresh decline from the $79.50 resistance.
Immediate support sits near $78.55. The next major support on the WTI crude oil chart is $77.75. If there is a downside break, the price might decline toward $76.70. Any more losses may perhaps open the doors for a move toward the $75.00 support zone.
Start trading commodity CFDs with tight spreads. Open your trading account now or learn more about trading commodity CFDs with FXOpen.
This article represents the opinion of the Companies operating under the FXOpen brand only. It is not to be construed as an offer, solicitation, or recommendation with respect to products and services provided by the Companies operating under the FXOpen brand, nor is it to be considered financial advice.
EURUSD Elliott Wave: Forecasting the Rally from Equal Legs Area
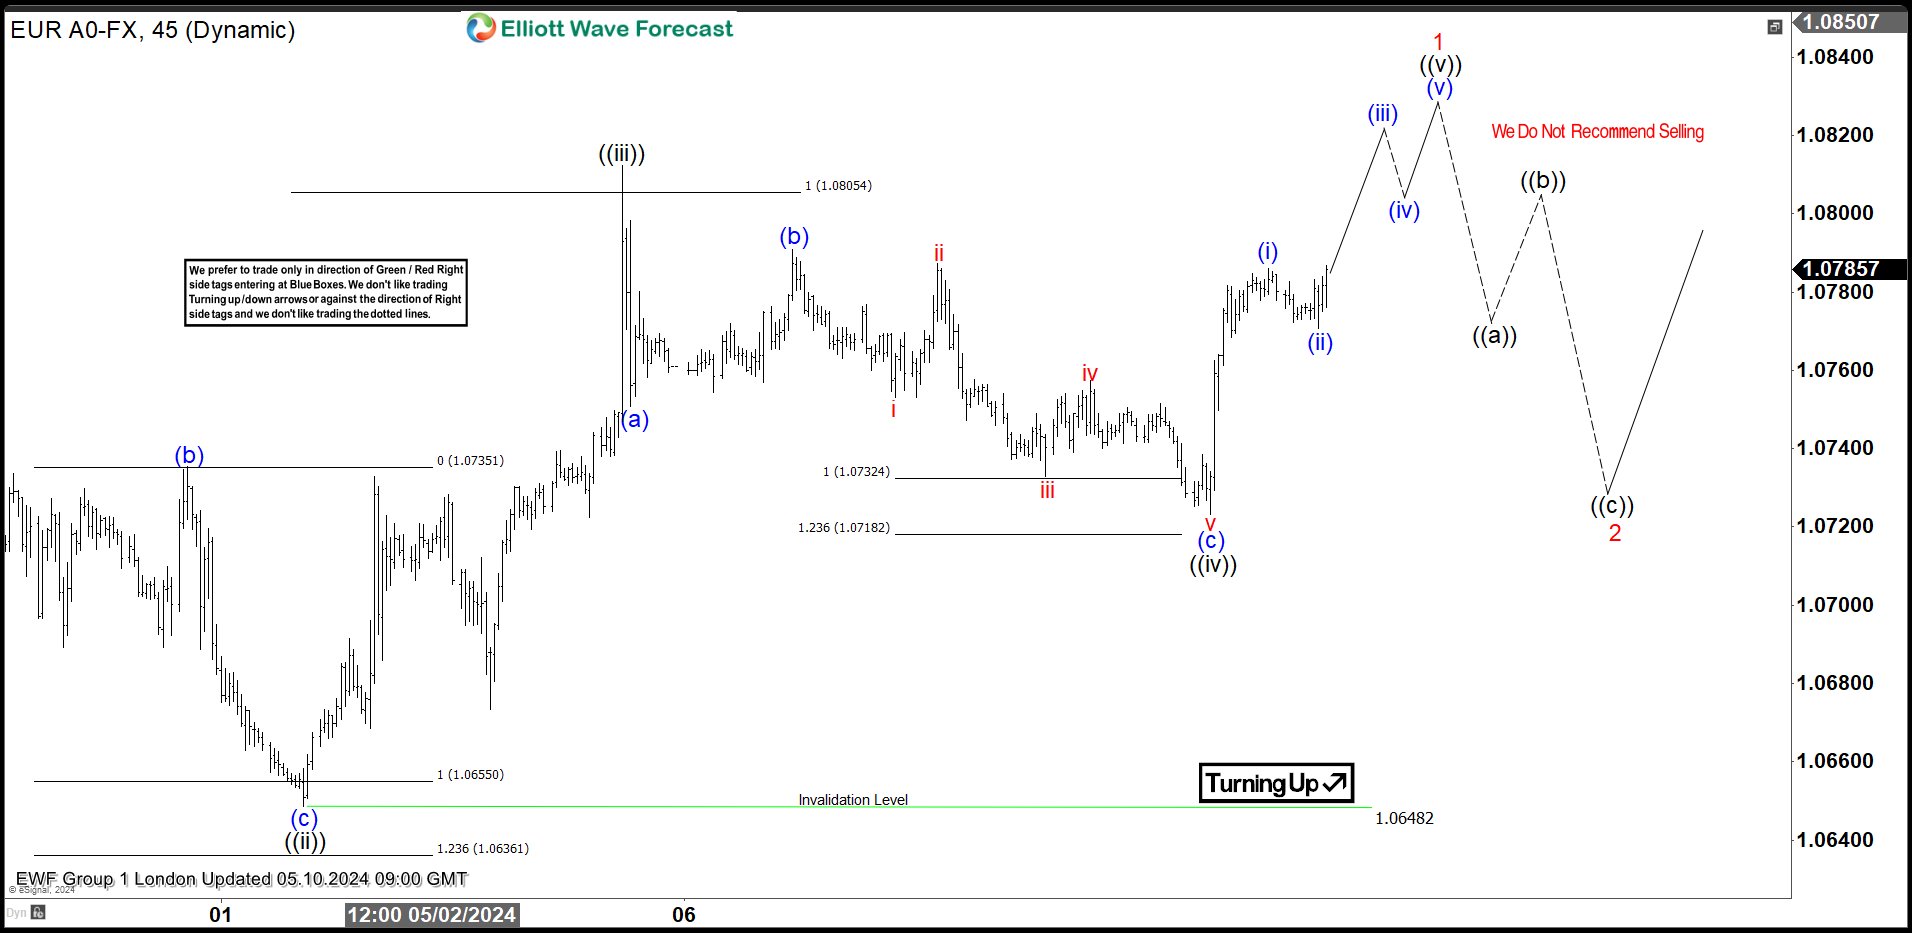
Greetings fellow traders. In this technical article we’re going to take a quick look at the Elliott Wave charts of EURUSD, published in members area of the website. As our members know, EURUSD has ended the cycle from the December’s 2023 peak. The pair has recently pulled back in a 3-wave pattern, with buyers stepping in right at the equal legs zone. Let’s break down our Elliott Wave forecast further in this article.
EURUSD H1 Asia Update 05.09.2024
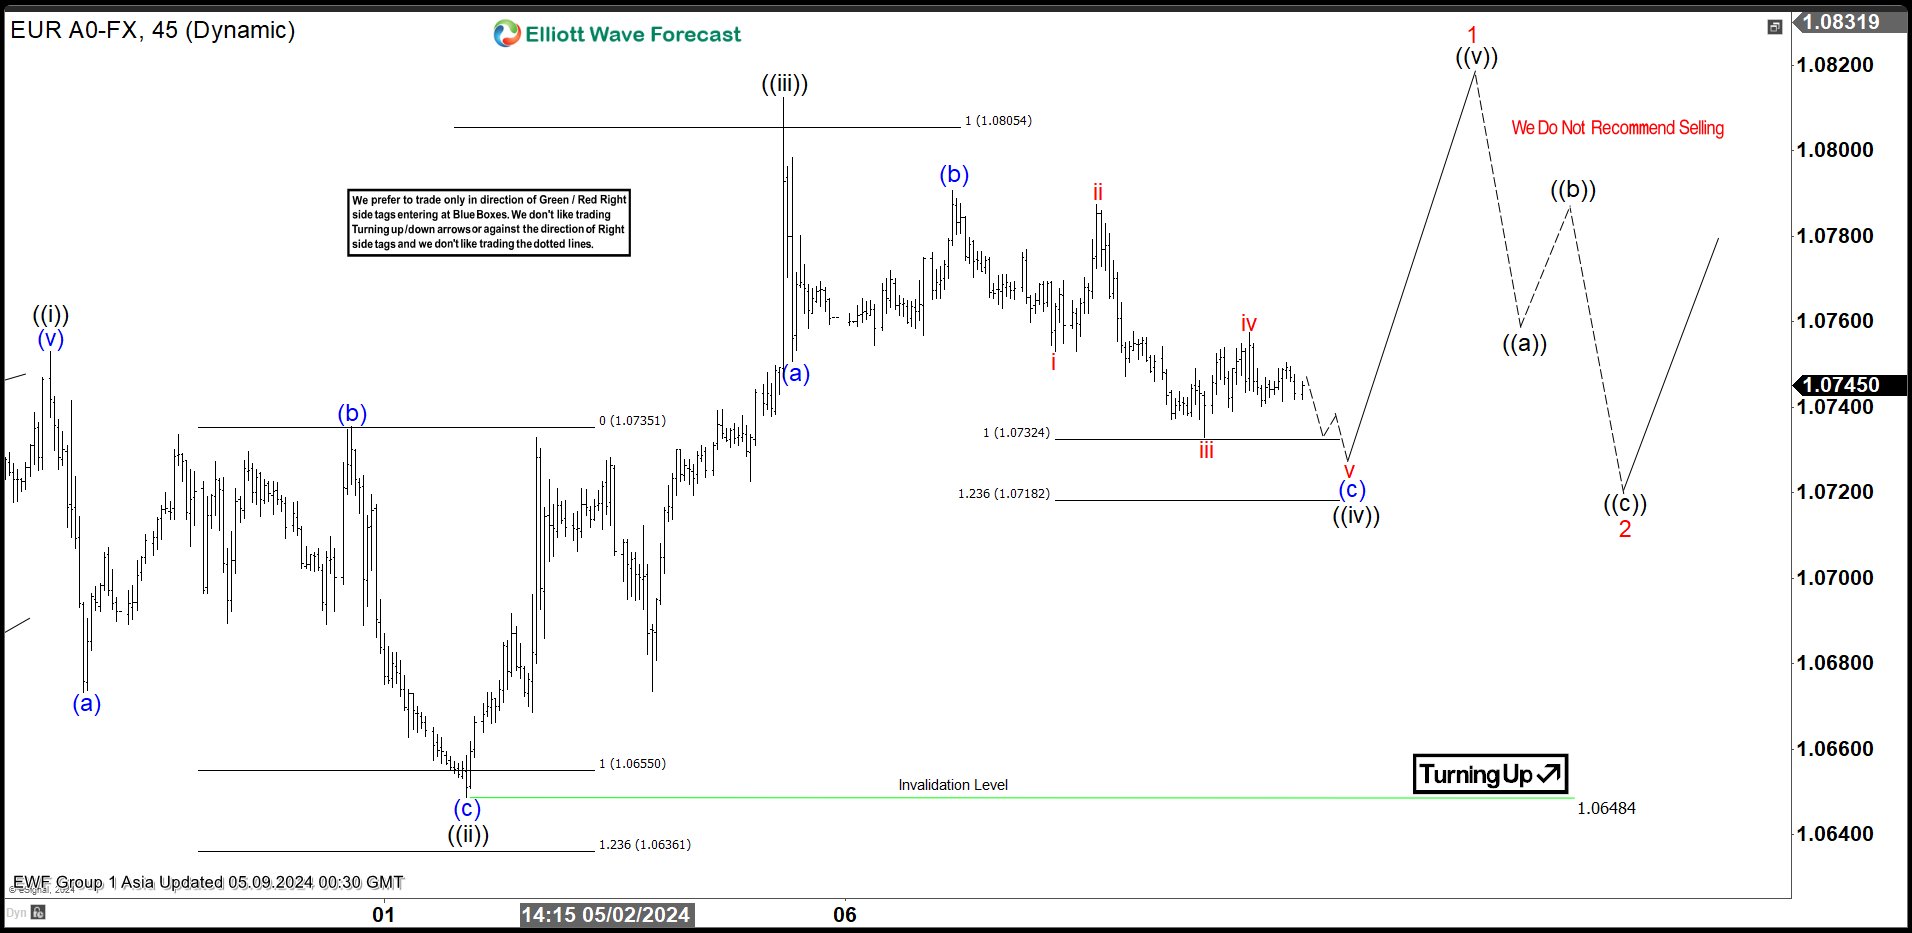
The current view suggests that the EURUSD pair is doing a ((iv)) pullback, which is correcting the cycle from the 1.0648 low. This pullback still looks incomplete at the moment. We expect to see another leg down toward equal legs area : 1.07324-1.07182. We expect potential buyers to appear in this area, which could lead to a further rally towards new high or a three-wave bounce at least.
EURUSD H1 London Update 05.10.2024
EURUSD has made a nice bounce from the Equal Legs-Buyers zone, as anticipated. We consider the wave ((iv)) pullback completed at the 1.0725 low. Confirmation of the next leg up will come with a break of the ((iii)) black peak. We advise against selling the pair during any suggested pullback and favor the long side.
Hang Seng Index: Oversold-Led Positive Animal Spirits Overshadowed Currency War Risk
- The Hang Seng Index has transformed into a medium-term uptrend phase with key support at 17,110.
- Momentum factor is now taking a front seat over fundamentals such as the deflationary risk spiral.
- A softer than-expected China CPI and PPI prints for April may further erode consumer confidence.
- A yuan devaluation cannot be ruled out to offset weak domestic demand via a boost in export growth that can spark a currency war.
In an abrupt turn of events, after being the worst-performing stock market in the world since 2022, the major benchmark China and its proxy Hong Kong stock indices reversed up in April and even outperformed the highflying technology and artificial intelligence (AI) heavily weighted US Nasdaq 100.
A more pronounced outperformance can be seen in the Hong Kong benchmark stock indices where the Hang Seng China Enterprises Index gained by +8% in April followed by Hang Seng Index (+7.4%) and Hang Seng TECH Index (+6.42%) while the China CSI 300 recorded a smaller gain of +1.9%.
In contrast, the Nasdaq 100 and the MSCI All-Country World Index exchange-traded fund were battered with monthly losses of -4.5% and -3.5% in April.
Momentum factor and under-positioning are likely the key catalysts
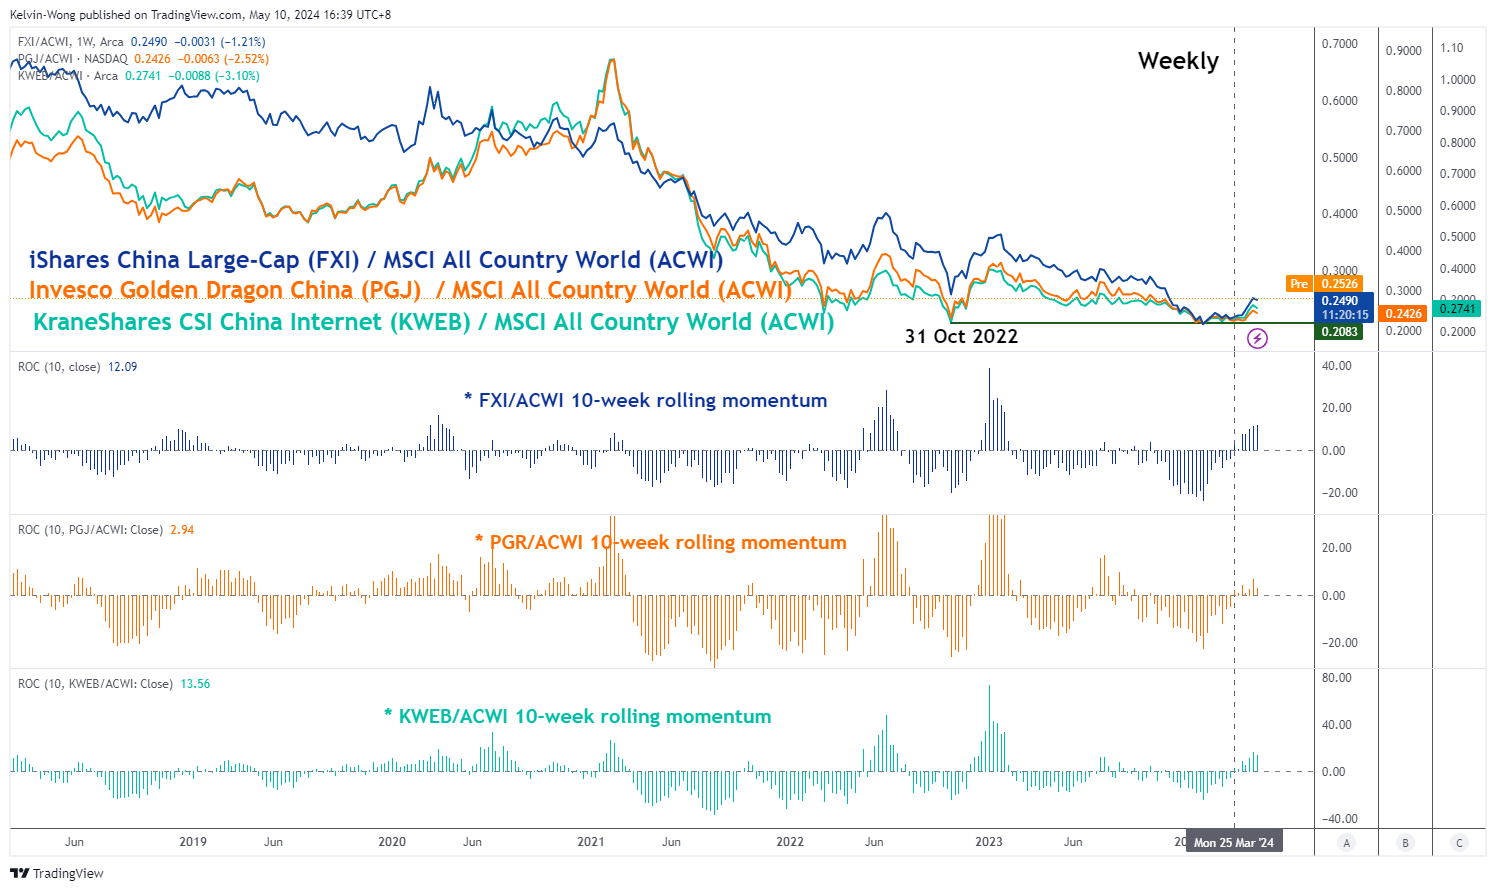
Fig 1: Key China thematic equities ETF / MSCI All Country World Index ETF ratios as of 9 May 2024 (Source: TradingView, click to enlarge chart)
The ratios of key China-related equities exchange-traded funds (ETF) listed in the US; iShares China Large-Cap (FXI), Invesco Golden Dragon China (PGR), and KraneShares CSI China Internet (KWEB) over the MSCI All-Country World Index ETF (ACWI) have seen their major underperformance stalled in late January 2024 as these ratios managed to find support at their respective late October 2022 swing lows.
Thereafter, the 10-week rolling momentum factor of these ratios has turned positive concurrently in the week of 25 March 2024 which in turn triggered the positive momentum feedback loop (see Fig 1).
Also, according to the Bank of America Merrill Lynch fund manager’s survey conducted in early April, respondents have highlighted China was the most underweighted geographical region in their portfolios (net 13%). Thus, a picked-up in positive momentum can easily spark a FOMO (fear of missing out) induced behaviour due to its grossly underweighted positioning that led to further rallies.
Can the rally in the Hang Seng Index continue?
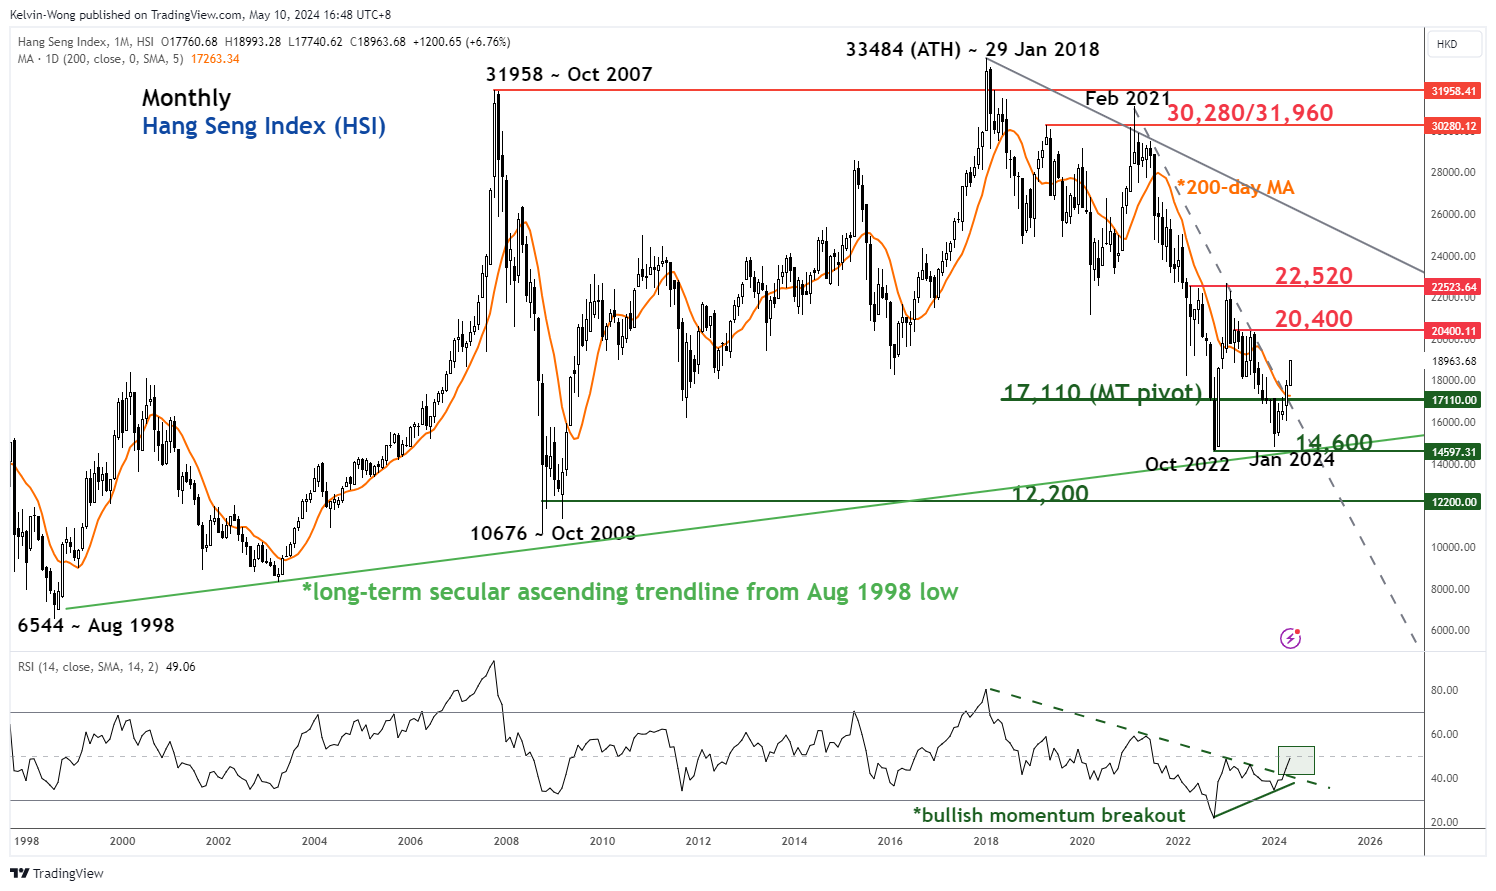
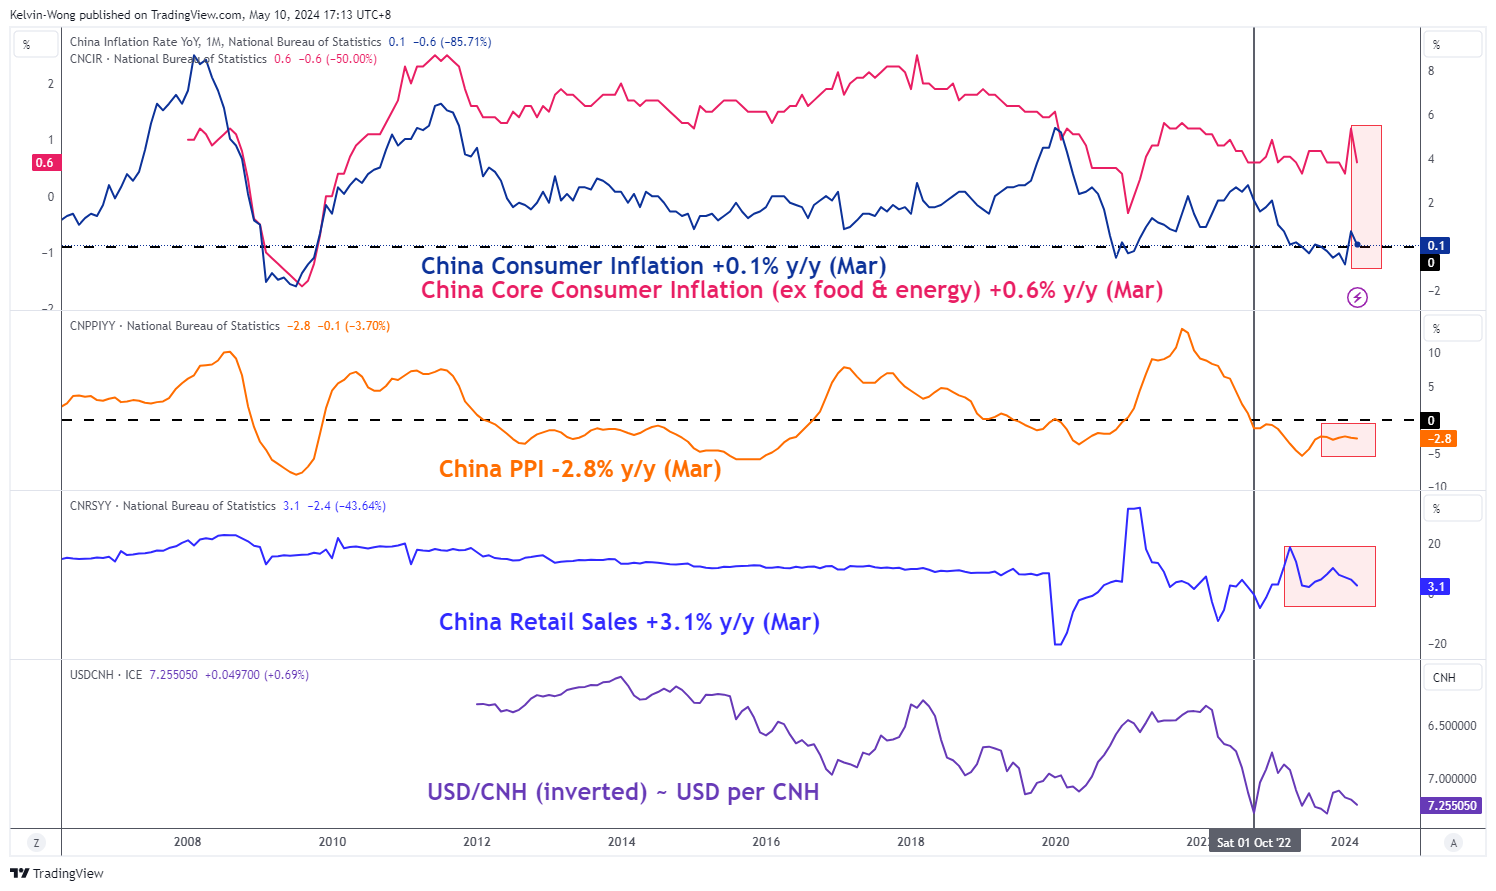
Fig 3: China consumer & producer inflationary trends with USD/CNH as of 10 May 2024 (Source: TradingView, click to enlarge chart)
For this week, the Hang Seng Index has continued to add to its gains as it ended today, 10 May with a weekly gain of +4.7%, its third consecutive week of positive return and a month-to-date gain of +6.8% for May that outperformed the Nasdaq 100 (+3.9%), and MSCI All-Country World Index ETF (3.6%) as of 9 May.
In the lens of technical analysis, the monthly RSI momentum indicator has staged a bullish momentum breakout below the 50 level. Also. it has yet to reach its overbought region of 70 and above which suggests that there is still potential medium-term (multi-week to multi-month) bullish impulsive upmove sequence as the price actions of the Hang Seng Index transformed into a medium-term uptrend phase via the bullish breakout of its former major descending trendline resistance from February 2021 (see Fig 2).
Watch the 17,110 key medium-term pivotal support on the Hang Seng Index with the next medium-term resistances coming in at 20,400 and 22,520.
The key risk that may derail the bullish tone seen in the Hang Seng Index is the revival of the deflationary risk spiral in China. Tomorrow, 11 May, we will have the latest set of China consumer (CPI) and producer inflation (PPI) data for April. In March, both the CPI and PPI inched lower to 0.1% y/y and -2.8% y/y respectively which also saw a decelerated growth in retail sales in the same month (3.1% y/y versus 5.5% y/y in February).
If China’s consumer and producer inflation trends continue to plummet lower in April, it suggests that the deflationary risk spiral is still intact which in turn can lead to a further erosion of consumer confidence followed by a potential deceleration in domestic demand (see Fig 3).
To make up for a tepid domestic demand environment, China’s policymakers may opt for a devaluation of the yuan to boost export growth that in turn likely to trigger a currency war among nations that are dependent on exports; such beggar-thy-neighbour monetary policies are not conducive for a risk-on environment.
Canadian Dollar Quiet Ahead of Jobs Data
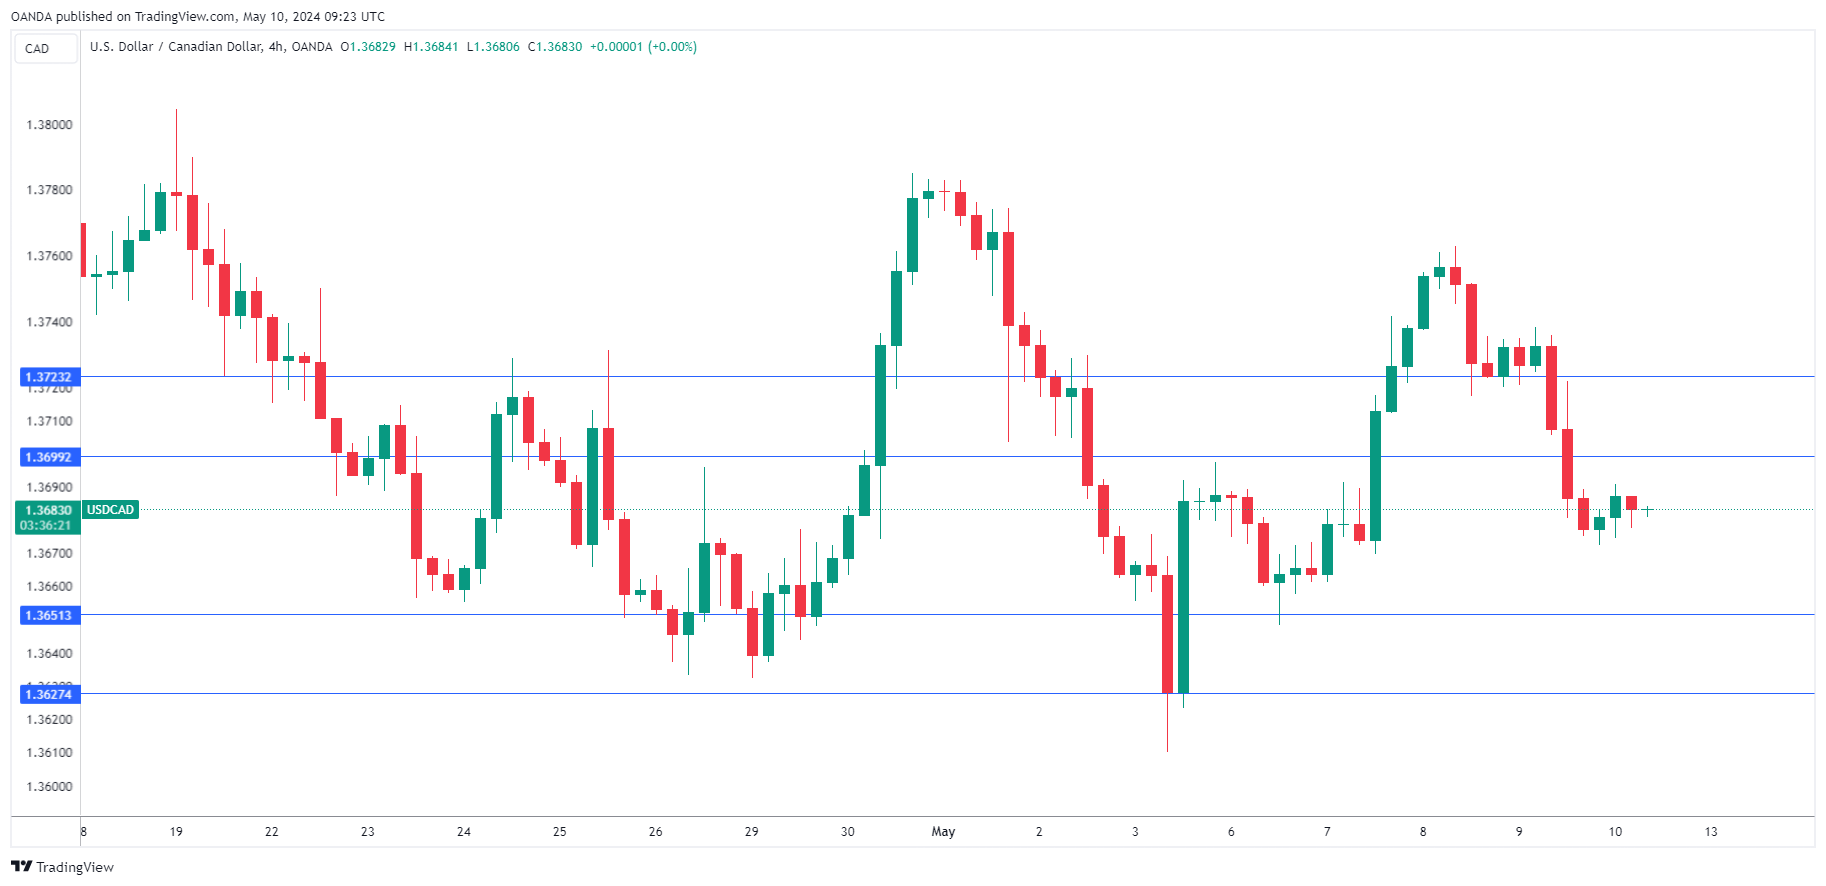
The Canadian dollar is almost unchanged on Friday. USD/CAD is up 0.03%, trading at 1.3680 in the European session at the time of writing.
Canada’s job growth expected to rebound
Canada releases the April employment report later today. The economy shed 2200 jobs in March, a shocking figure as the market forecast stood at a gain of 25,900. Job growth is expected to get back on track, with an estimate of 18,000. The unemployment rate has been high and is expected to creep up to 6.2%, compared to 6.1% in March. Wage growth, an important driver of inflation, is expected to tick lower to 4.9% in April, down from 5% in March.
The Bank of Canada has kept rates unchanged at 5% for a sixth straight time at the April meeting, and is under pressure to ease rates as inflation falls lower. The BoC remains cautious, however, as policy makers are reluctant to lower rates before they are confident of sustainable price stability around the 2% inflation target. At the press conference after the April announcement, Governor Macklem said that a June rate cut was “within the realm of possibilities”, which wasn’t much of an endorsement.
The BoC would prefer not to cut before the Federal Reserve, since that would push the Canadian dollar lower and likely boost inflation. At the same time, the BoC is under pressure to ease the pain of households which have been hit hard by elevated rates and will likely press the rate trigger ahead of the Fed if it feels that inflation is low enough.
It’s a light data calendar in the US, with UoM Consumer Sentiment the sole tier-1 event. The index is expected to drop to 76.0 in May, down from 77.2 in April.
USD/CAD Technical
- USD/CAD is putting pressure on resistance at 1.3699. Above, there is resistance at 1.3723
- 1.3651 and 1.3627 are providing support
GBP/USD Analysis: Pound Recovers After the Bank of England Decision
Yesterday, the Bank of England published its interest rate decision. According to ForexFactory, the votes were distributed as follows:
→ rate hike - 0 votes, cut - 2 votes, unchanged - 7 (0 - 2 - 7);
→ forecast: 0 - 0 - 9;
→ previous values: 0 - 1 - 8.
For the first time in the current cycle of interest rate hikes aimed at inflation lowering, two members of the Monetary Policy Committee voted in favour of the rate cut. The dovish tone was echoed by Bank of England Governor Andrew Bailey: “It is likely that we will need to cut the bank rate over coming quarters, possibly more so than is currently priced into markets.”
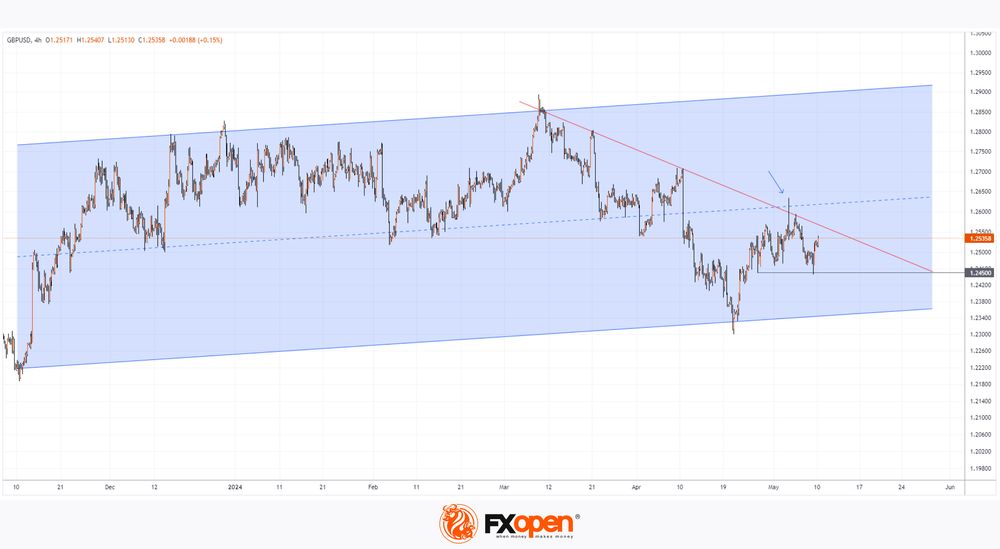
The market's first reaction to the clear signals of the imminent easing monetary policy was the weakening of the pound, including against the US dollar. Thus, yesterday, the GBP/USD rate dropped below the low of April 26 at around 1.245.
However:
→ the US dollar is also affected by the prospect of the Fed's easing monetary policy because the current tight policy puts pressure on the labour market - according to data from May 9, the number of applications for unemployment benefits in the US was the highest since November 2023;
→ Today's UK GDP data (which turned out to be better than expected) supported the pound.
As a result, today, the GBP/USD rate surged to 1.2537 from yesterday's low below 1.2450.
Technical analysis of the GBP/USD chart shows:
→ the price is within the channel (shown in blue);
→ the median line (as shown by the arrow) acts as resistance - a long upper shadow can be interpreted as evidence of sellers' activity above 1.26;
→ recent events have shown the presence of demand in the area of the psychological level of 1.25.
Thus, fluctuations in the GBP/USD rate may continue to compress within the formation between the trendline – resistance – (shown in red) and support around 1.25. The exit from this consolidation pattern may develop into a stable trend against the background of prospects for lowering interest rates by central banks.
Trade over 50 forex markets 24 hours a day with FXOpen. Take advantage of low commissions, deep liquidity, and spreads from 0.0 pips. Open your FXOpen account now or learn more about trading forex with FXOpen.
This article represents the opinion of the Companies operating under the FXOpen brand only. It is not to be construed as an offer, solicitation, or recommendation with respect to products and services provided by the Companies operating under the FXOpen brand, nor is it to be considered financial advice.
British Pound Listless Despite Strong GDP
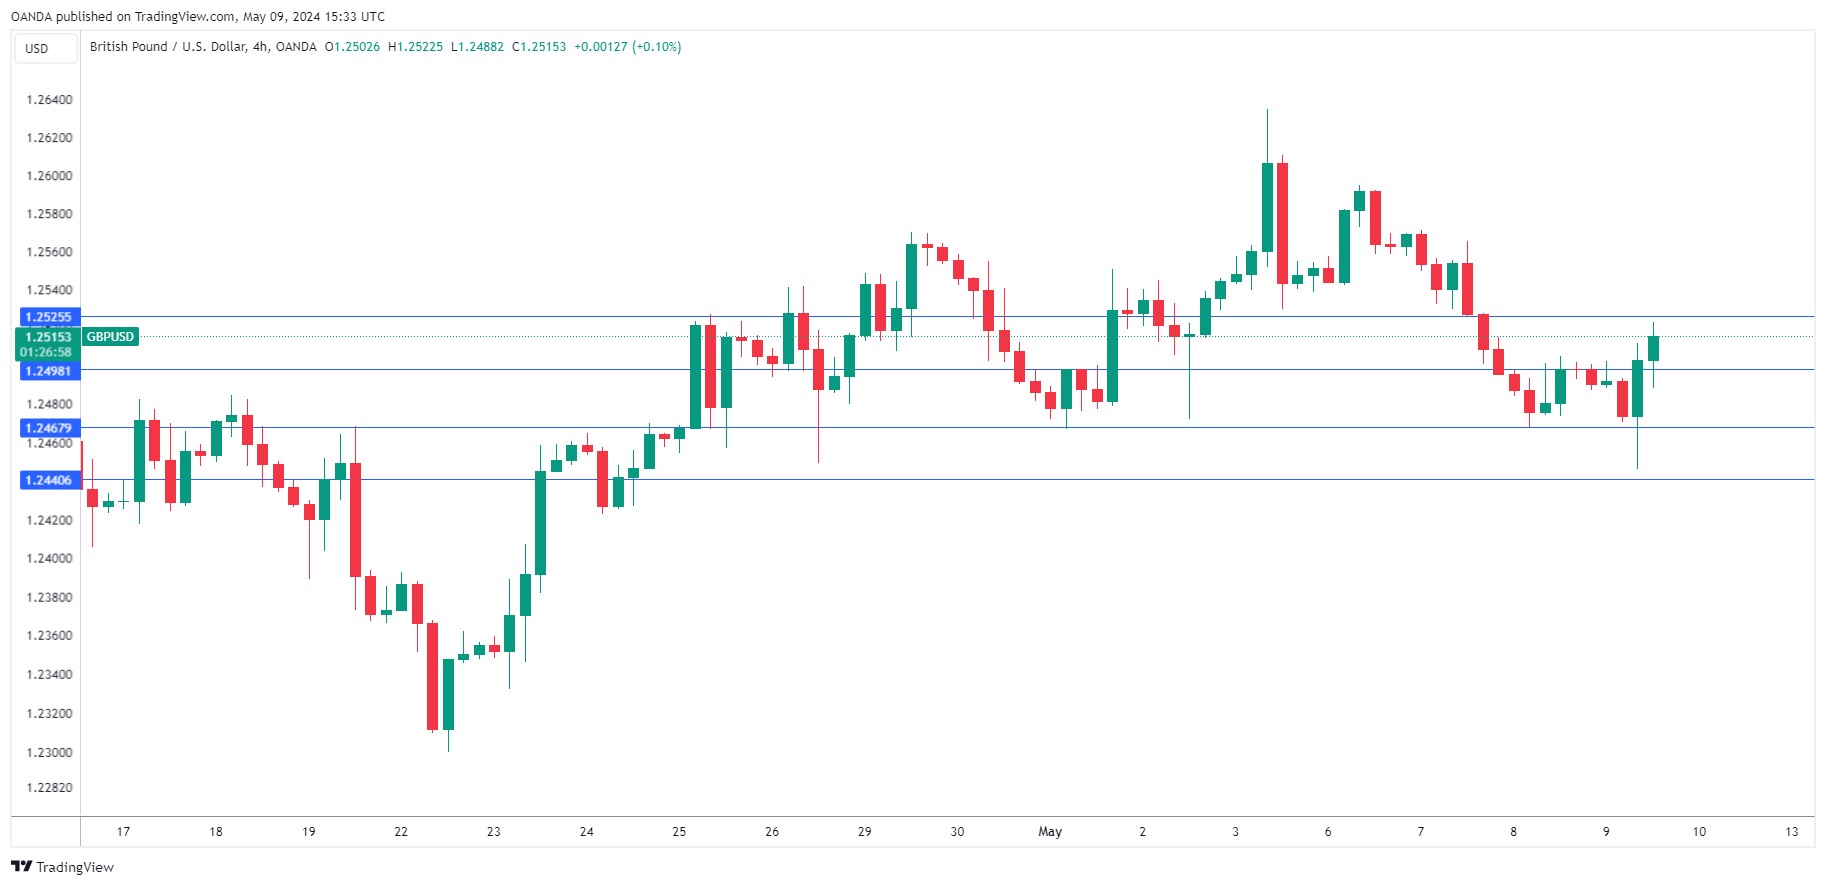
The British pound is drifting on Friday. GBP/USD is up 0.05%, trading at 1.2531 in the European session at the time of writing.
UK GDP rises 0.6%
The British economy grew by 0.6% q/q in the first quarter, higher than the market estimate of 0.4% and above the Q4 2023 decline of 0.3%. This marks a rebound after a mild recession in the second half of 2023. GDP posted its best quarterly growth since Q4 of 2021and was driven by increased expansion in the services sector. On a monthly basis, GDP rose 0.4% in March, up from 0.2% in February and above the forecast of 0.1%. This was its best performance in nine months. The British pound showed little reaction to the GDP data.
The positive GDP report is unlikely to change the BoE’s rate path, which admittedly isn’t all that clear. The modest economic turnaround in the first quarter isn’t expected to be inflationary, which leaves the BoE on course to lower rates later this year.
The Bank of England maintained the cash rate at 5.25% at yesterday’s meeting. The markets were hoping for a signal of a rate cut in June, but Governor Bailey didn’t play along, saying that the central bank needed to see more evidence that inflation will remain low prior to cutting rates. Bailey added he was “optimistic that things are moving in the right direction”, which could be a signal that rate cuts are on the way. The markets have priced a June cut at around 50% and have fully priced a cut in August.
It’s a light data calendar in the US, with UoM Consumer Sentiment the sole tier-1 event. The index is expected to drop to 76.0 in May, down from 77.2 in April.
GBP/USD Technical
- There is support at 1.2499 and 1.2471
- 1.2552 and 1.2580 are the next resistance lines
AUDUSD Remains Undecided Near Crucial Technical Region
- AUDUSD repeatedly fails to conquer the 0.6643-0.6666 range
- But outlook is positive as price holds above 50 and 200-day SMAs
- Momentum indicators deteriorate but remain in positive zones
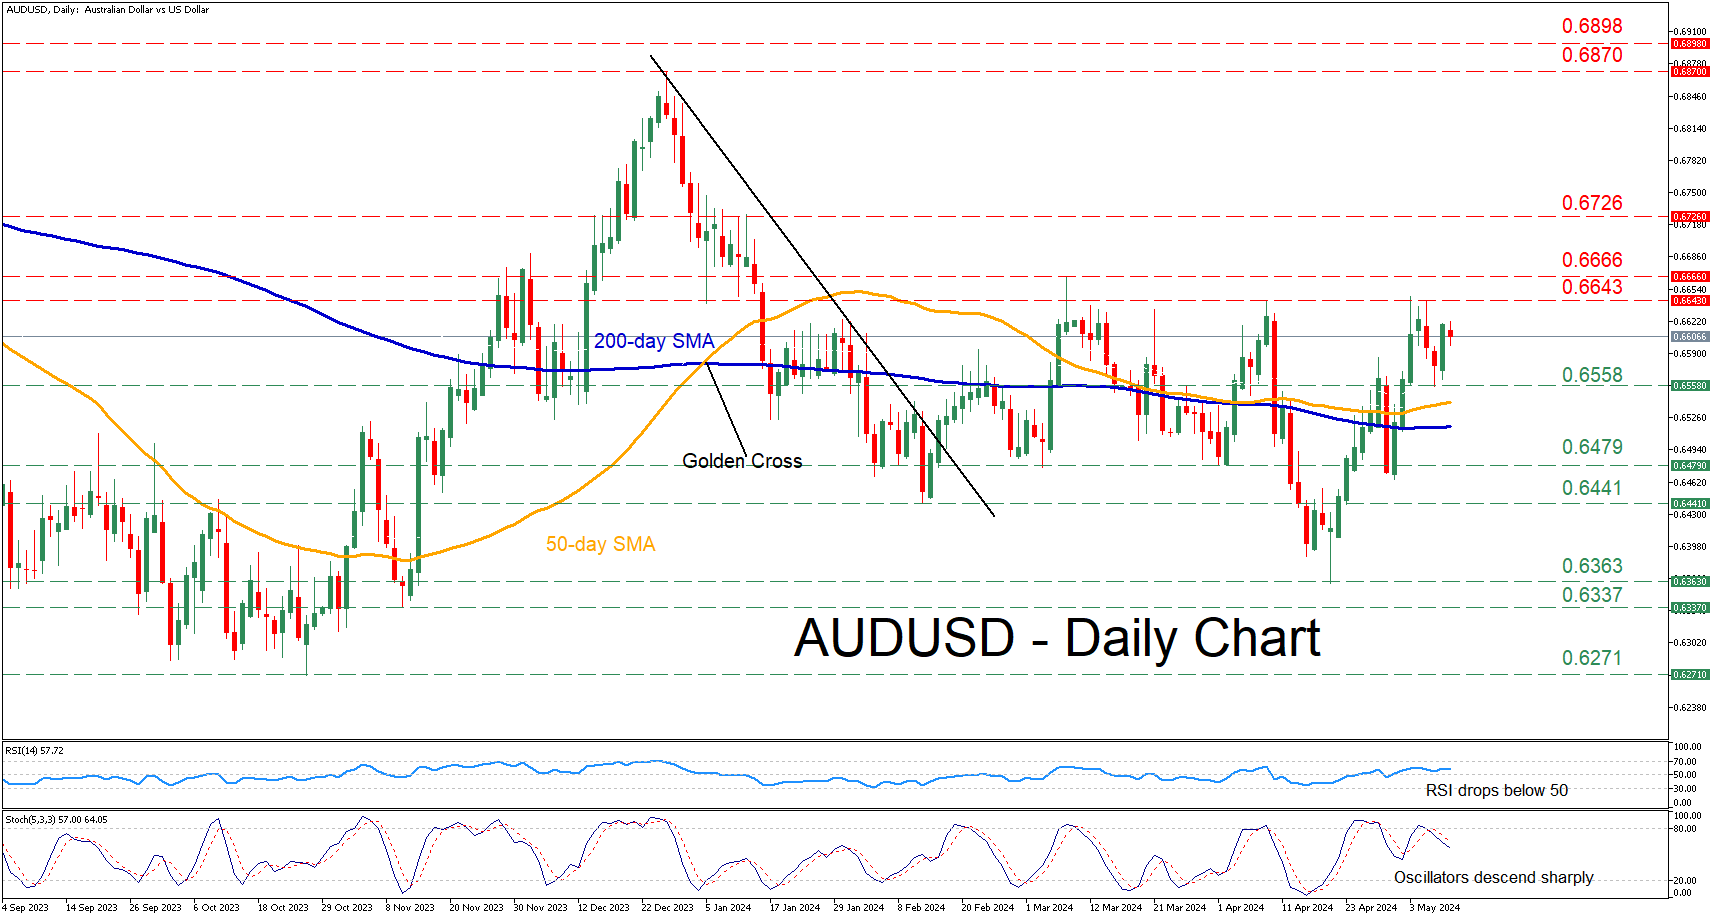
AUDUSD has been in a steady advance since its bounce off the five-month low of 0.6363 in mid-April. Although the pair has been rejected at the 0.6643-0.6666 range three times so far in 2024, the bulls do not seem ready to give up.
If buying pressures persist, the price may initially test the recent rejection region of 0.6643, which also held its ground in early April. A break above that zone could set the stage for the 2024 peak of 0.6666. Even higher, the December-January resistance territory of 0.6726 could prevent further upside attempts.
On the flipside, should the pair reverse lower, the recent support of 0.6558 could act as the first line of defence. In case of a downside violation, the bears may attack the February-March support of 0.6479. Failing to halt there, the price might challenge the February bottom of 0.6441.
In brief, AUDUSD has repeatedly failed to conquer the congested 0.6643-0.6666 region, but the technical picture remains bullish as the price holds above both its 50 and 200-day simple moving averages (SMAs).
USDCAD Slips Beneath 20-day SMA
- USDCAD may retest the uptrend line
- MACD and RSI lose steam
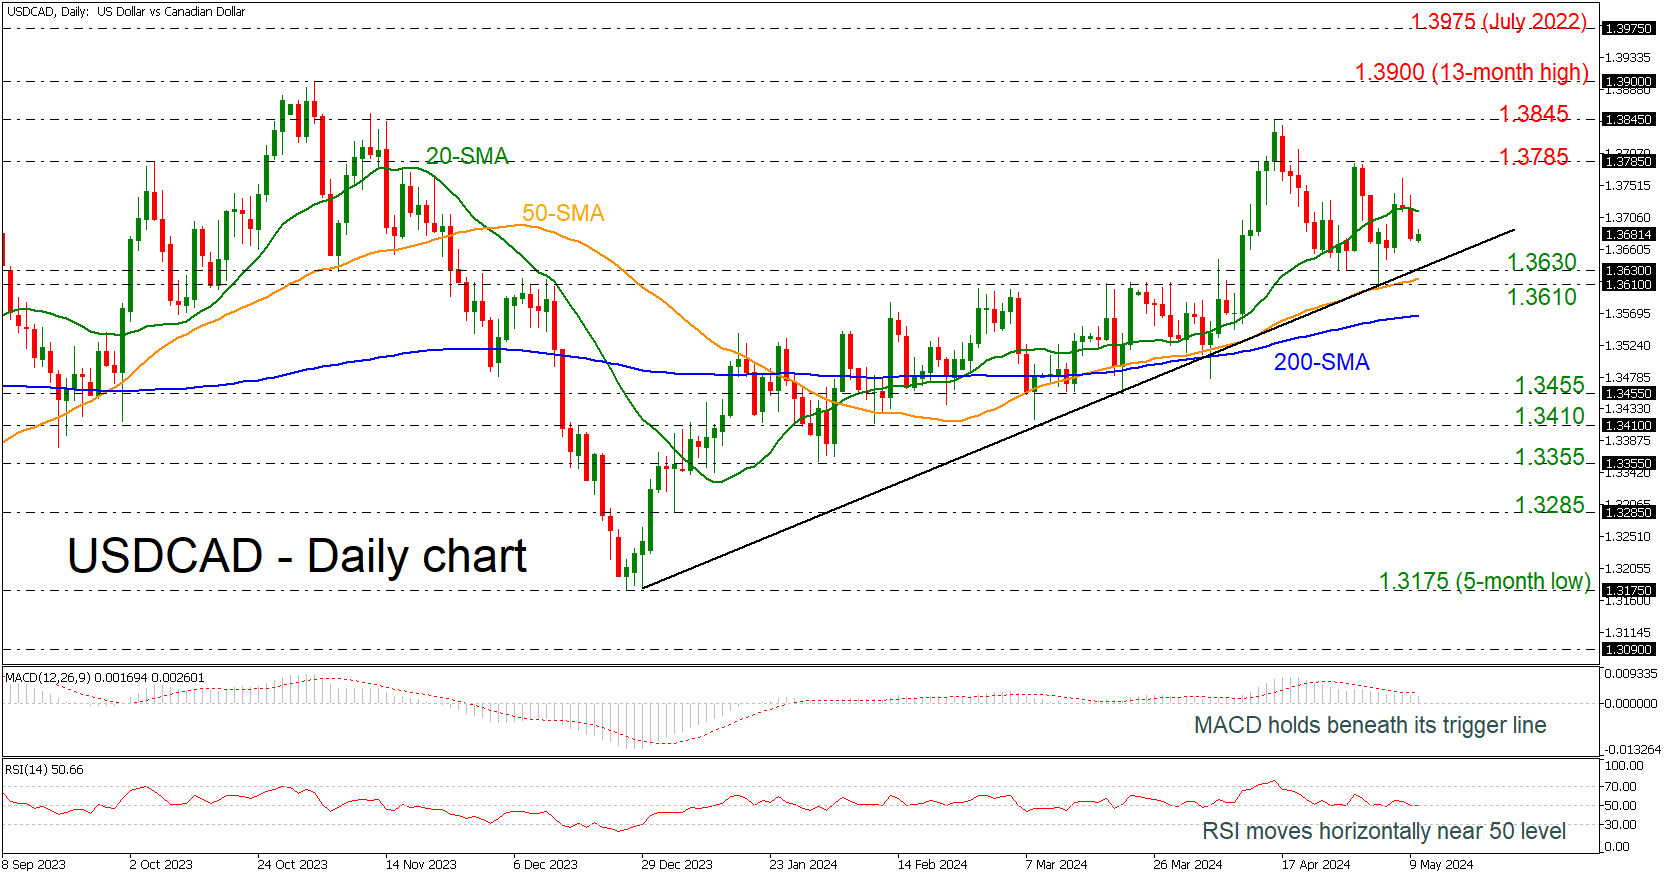
USDCAD is sliding beneath the 20-day simple moving average (SMA) and is approaching the medium-term ascending trend line around the 1.3630-1.3610 support region.
Technically, the MACD oscillator is holding beneath its trigger line in the positive area; however, the RSI is weakening and is moving horizontally near the neutral threshold of 50.
In case of steeper decreases the market may rest near the 50-day SMA at 1.3618 and any movements below the 1.3610 region could open the way for challenging the 200-day SMA at 1.3565. Even lower, the outlook could switch to negative, hitting the 1.3455 hurdle.
On the other hand, a climb beyond the 20-day SMA could endorse the bullish structure, meeting the immediate resistance at 1.3785 and the previous peak of 1.3845. If the bulls extend the bullish move, then the price could rally towards the 13-month high of 1.3900.
Summarizing, the current picture of USDCAD is positive unless the price plunges below the 200-day SMA.
EUR/USD Daily Outlook
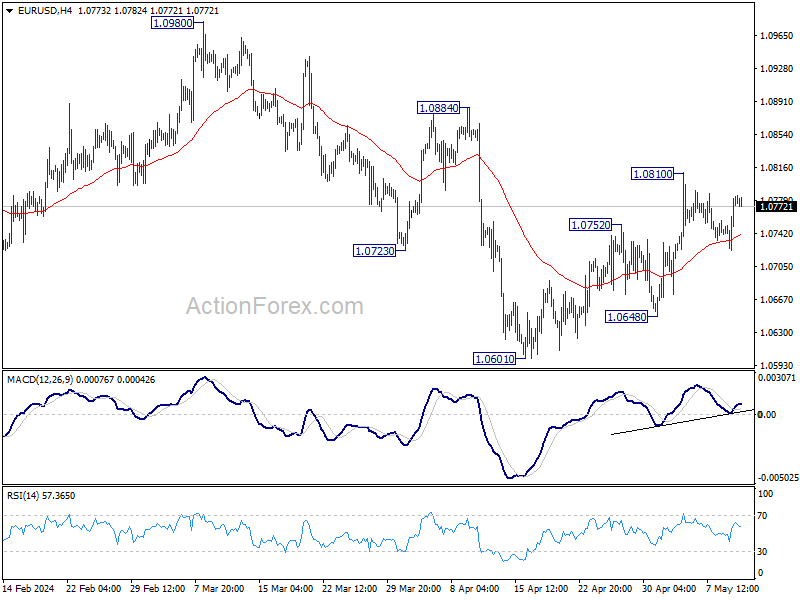
Daily Pivots: (S1) 1.0742; (P) 1.0764; (R1) 1.0803; More...
Intraday bias in EUR/USD stays neutral at this point. Further rally is expected as long as 55 4H EMA (now at 1.0741) holds. On the upside, above 1.0810 will resume the rebound from 1.0601 to 1.0884 resistance next. However, firm break of 55 4H EMA will argue that the rebound has completed, and turn bias to the downside for 1.0648 support instead.
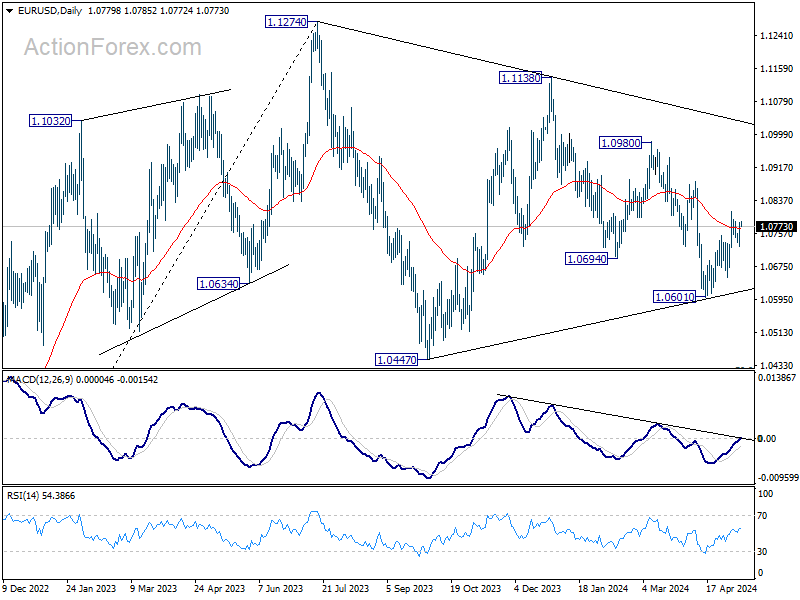
In the bigger picture, price actions from 1.1274 are viewed as a corrective pattern. Fall from 1.1138 is seen as the third leg and could have completed. Firm break of 1.1138 will argue that larger up trend from 0.9534 (2022 low) is ready to resume through 1.1274 high. On the downside, break of 1.0601 will extend the corrective pattern instead.
GBP/USD Daily Outlook
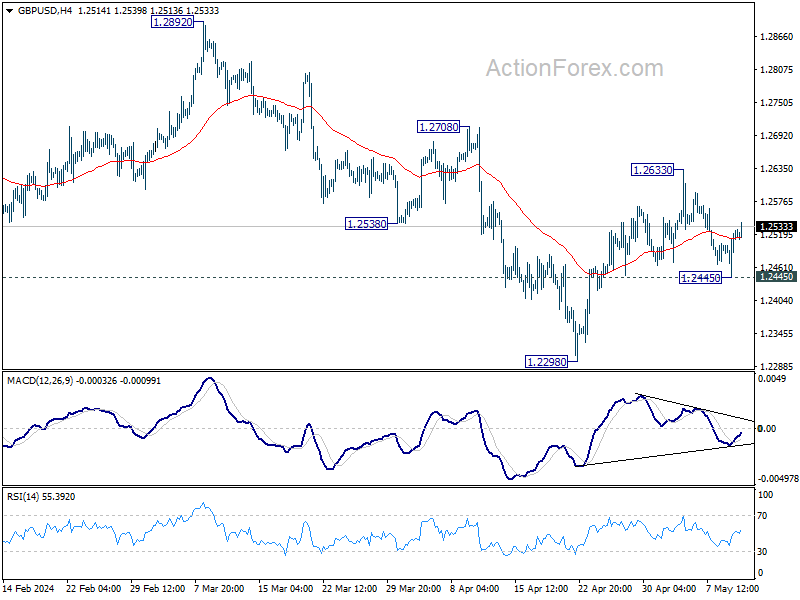
Daily Pivots: (S1) 1.2471; (P) 1.2499; (R1) 1.2552; More...
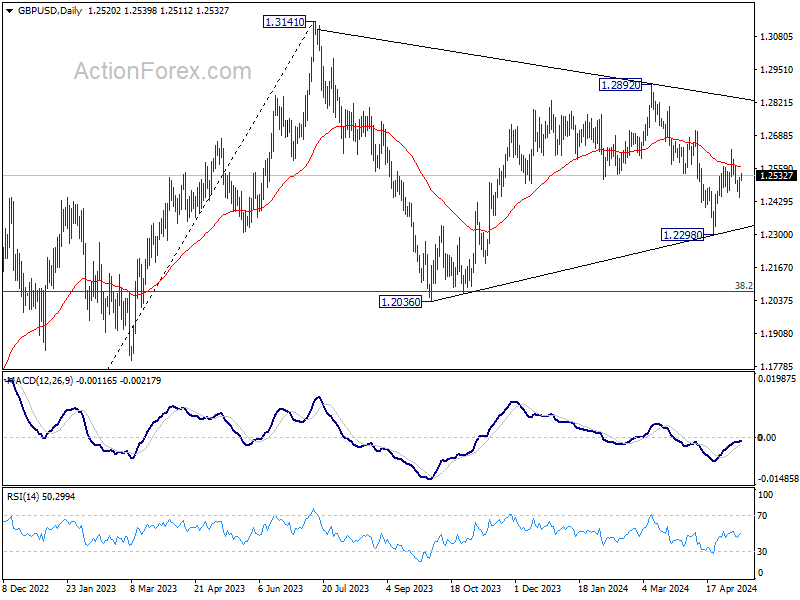
Intraday bias in GBP/USD remains neutral at this point, as it recovered after dipping to 1.2445. Strong bounce from current level will retain near term bullishness. Further break of 1.2633 will resume the rebound from 1.2298 to 1.2708 resistance next. However, firm break of firm break of 1.2445 will indicate that this rebound has completed, and revive near term bearishness. Retest of 1.2298 should then be seen in this case.
In the bigger picture, price actions from 1.3141 medium term top are seen as a corrective pattern. Fall from 1.2892 is seen as the third leg which might have completed already. Break of 1.2892 resistance will argue that larger up trend from 1.0351(2022 low) is ready to resume through 1.3141. Meanwhile, break of 1.2298 support will extend the corrective pattern instead.