Sample Category Title
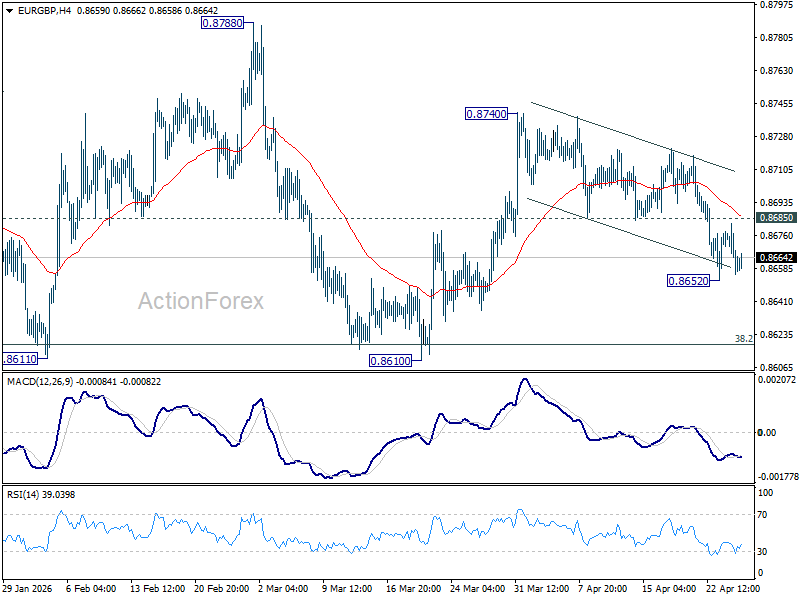
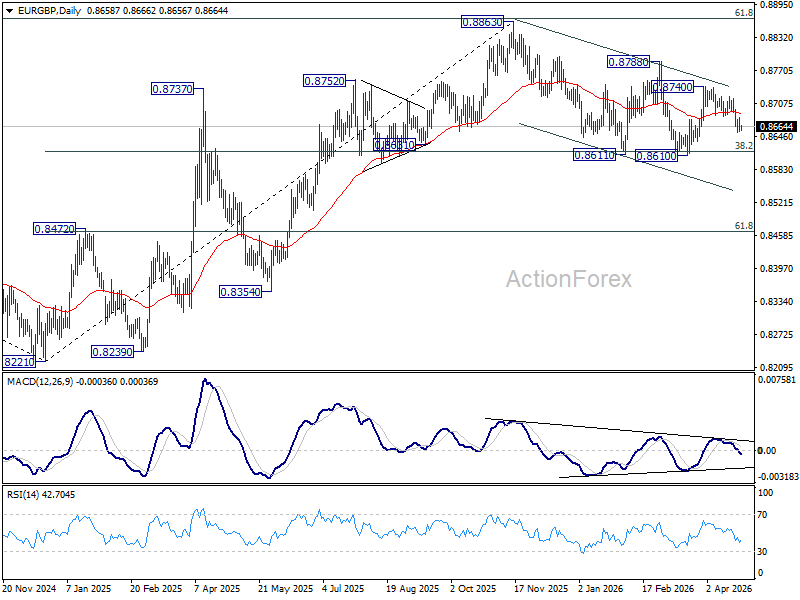
EUR/GBP Daily Outlook
Daily Pivots: (S1) 0.8650; (P) 0.8668; (R1) 0.8678; More…
Intraday bias in EUR/GBP remains neutral and further fall is expected with 0.8685 support turned resistance intact. On the downside, below 0.8652 will resume the fall from 0.8740 to retest 0.8610 support next. Nevertheless, firm break of 0.8685 will dampen the bearish view and turn bias back to the upside for 0.8740 again.
In the bigger picture, strong support was seen again from 38.2% retracement of 0.8821 to 0.8863 at 0.8618. Break of 0.8788 resistance will argue that larger rise from 0.8221 might be ready to resume through 0.8863 (2025 high). Nevertheless, sustained trading below 0.8618 should confirm bearish reversal, and bring deeper fall to 61.8% retracement at 0.8466 at least.
EUR/AUD Daily Outlook
Daily Pivots: (S1) 1.6365; (P) 1.6392; (R1) 1.6414; More...
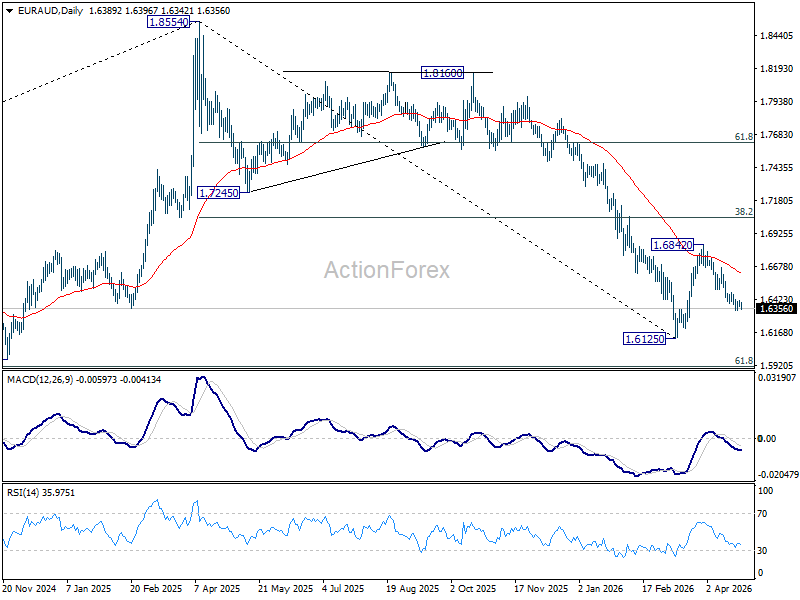
Intraday bias in EUR/AUD remains neutral for consolidations and further decline is expected as long as 1.6497 support turned resistance holds. Below 1.6340 will resume the fall from 1.6842 and target a retest on 1.6125 low. Nevertheless, firm break of 1.6497 will turn bias back to the upside for stronger rebound.
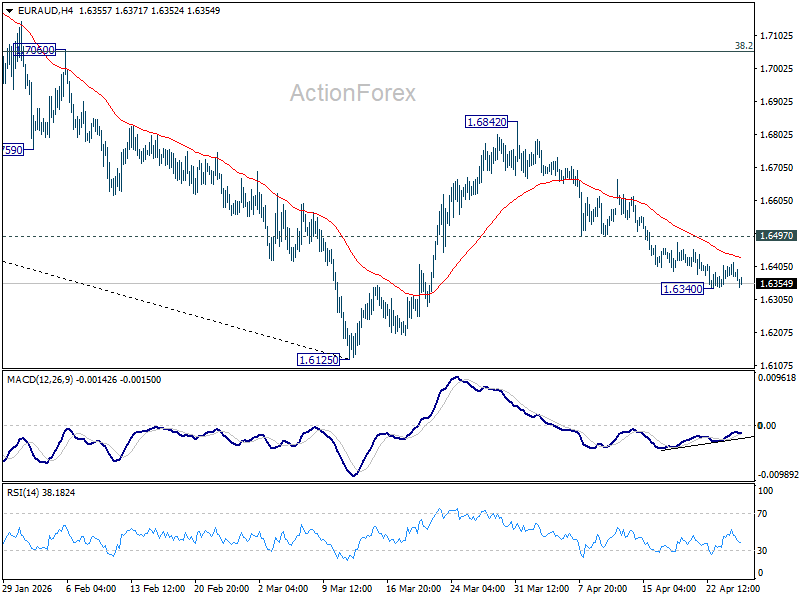
In the bigger picture, fall from 1.8554 (2025 high) is in progress and deeper decline should be seen to 61.8% retracement of 1.4281 to 1.8554 at 1.5913, which is slightly below 1.5963 structural support. Decisive break there will pave the way back to 1.4281 (2022 low). For now, risk will stay on the downside as long as 55 W EMA (now at 1.7129) holds, even in case of strong rebound.
EUR/CHF Daily Outlook
Daily Pivots: (S1) 0.9174; (P) 0.9198; (R1) 0.9222; More....
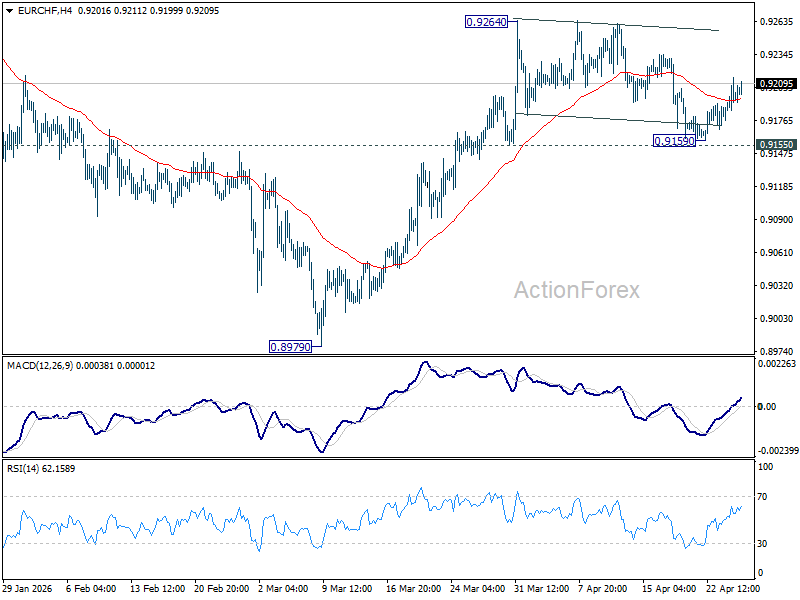
Intraday bias in EUR/CHF remains neutral for the moment and more consolidations could be seen below 0.9264. Further rise is expected with 0.9155 support intact. On the upside, firm break of 0.9264 will resume the rise from 0.8979 to 0.9394 resistance next. However, break of 0.9155 will turn bias back to the downside for deeper pullback.
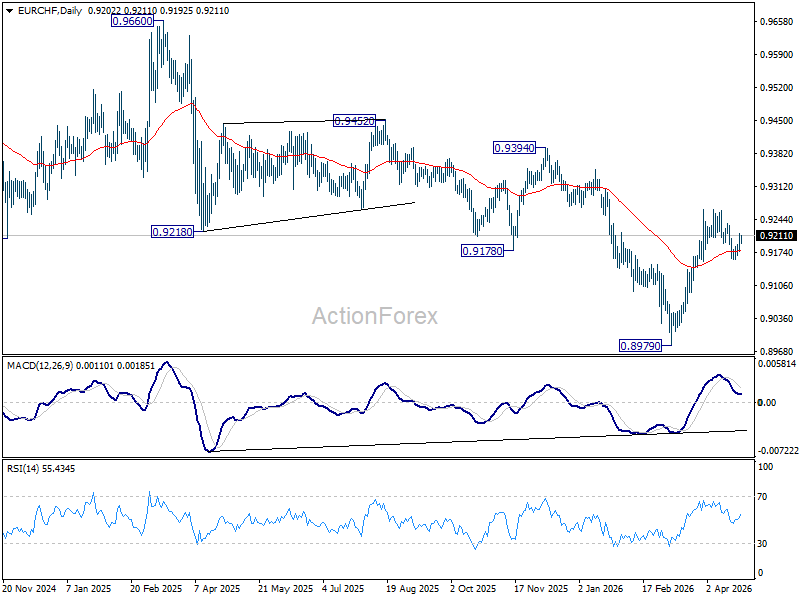
In the bigger picture, considering bullish convergence condition in W MACD, a medium term bottom should be in place at 0.8979. Sustained trading above 55 W EMA (now at 0.9277) will add more credence to this case. Further break of 0.9394 resistance will pave the way to 0.9660 resistance next. However rejection by the 55 W EMA will set up another fall through 0.8979 low at a later stage.
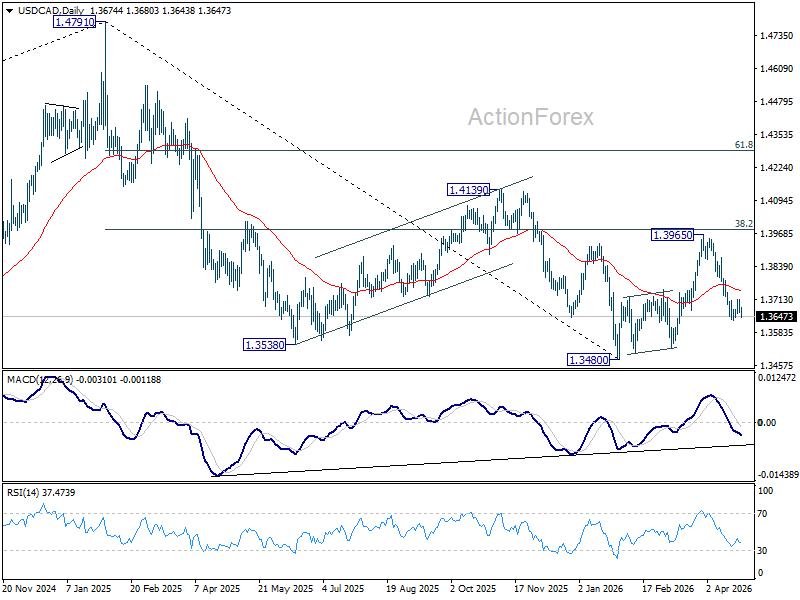
USD/CAD Daily Outlook
Daily Pivots: (S1) 1.3651; (P) 1.3683; (R1) 1.3705; More...
Intraday bias in USD/CAD stays neutral and more consolidations could be seen above 1.3629. Further decline is expected with 1.3729 resistance intact. On the downside, sustained trading below 61.8% retracement of 1.3480 to 1.3965 at 1.3665 will pave the way to retest 1.3480 low. Nevertheless, break of 1.3729 minor resistance will turn bias back to the upside for stronger rebound first.
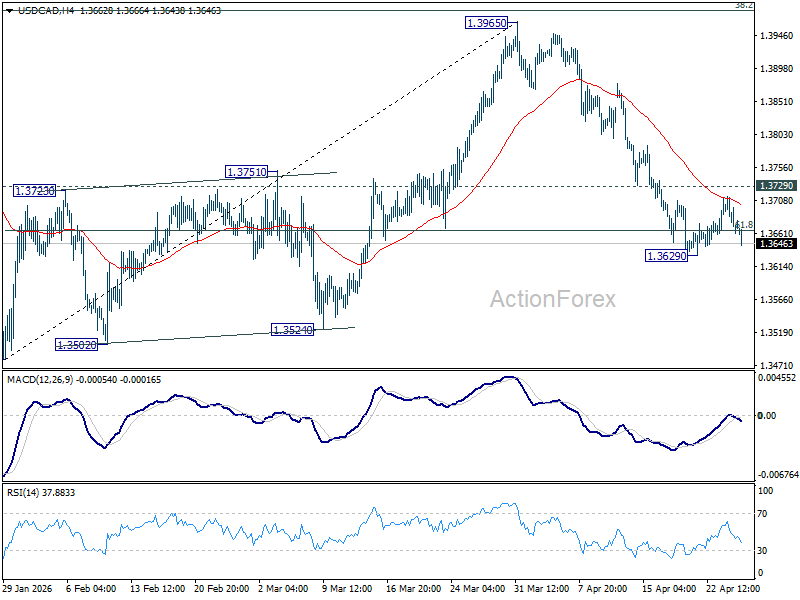
In the bigger picture, price actions from 1.4791 are seen as a corrective pattern to the whole up trend from 1.2005 (2021 low). Deeper fall could be seen, as the pattern extends, to 61.8% retracement of 1.2005 to 1.4791 at 1.3069. However, decisive break of 38.2% retracement of 1.4791 to 1.3480 at 1.3981 will argue that the correction has completed with three waves down to 1.3480 already. Further break of 1.4139 will confirm and bring retest of 1.4791 high.
AUD/USD Daily Report
Daily Pivots: (S1) 0.7125; (P) 0.7140; (R1) 0.7166; More...
Intraday bias in AUD/USD stays neutral at this point and more consolidations could be seen below 0.7221. Further rally is expected with 0.7076 support intact. On the upside, firm break of 0.7221 will extend larger up trend to 61.8% projection of 0.6420 to 0.7187 from 0.6832 at 0.7306. On the downside, break of 0.7076 minor support will turn bias back to the downside for deeper pullback.
In the bigger picture, rise from 0.5913 (2024 low) is still in progress. Decisive break of 61.8% retracement of 0.8006 to 0.5913 at 0.7206 will solidify the case that it's already reversing the down trend from 0.8006 (2021 high). Further rally should then be seen to retest 0.8006. For now, outlook will remain bullish as long as 0.6832 support holds, in case of pullback.
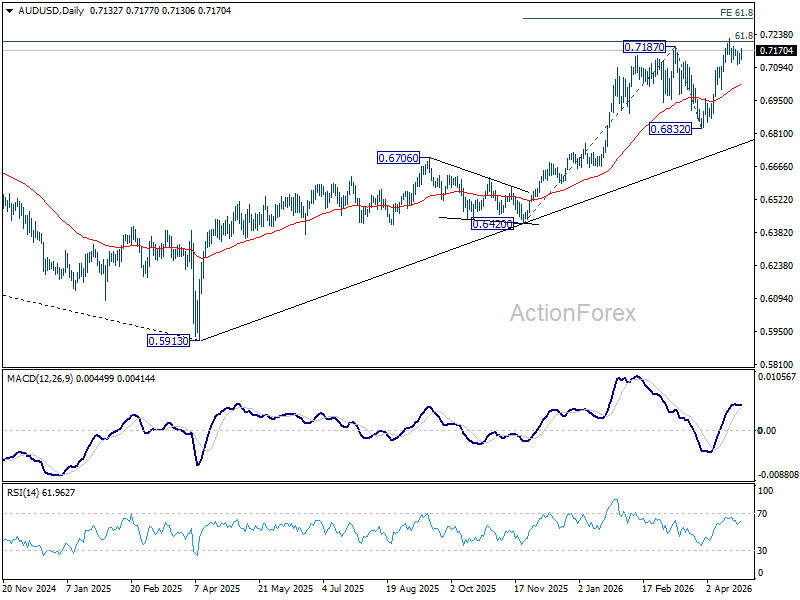
Chart Alert: AUD/USD Kickstarts Fresh Bullish Impulsive Sequence Above 0.7090 Key Support
Key takeaways
- AUD/USD driven by risk sentiment in the near-term, not fundamentals: The pair continues to behave like a high-beta risk asset, with its correlation to global equities surging to 0.95 as stagflation fears and geopolitics dominate over RBA policy signals.
- Geopolitical optimism fuels rebound: Hopes of a potential breakthrough in reopening the Strait of Hormuz triggered a risk-on move, lifting AUD/USD back above 0.7120 and aligning with gains in US equity futures.
- Technical setup supports bullish continuation: Holding above 0.7090 keeps the uptrend intact, with a break above 0.7211 opening upside toward 0.7244–0.7300; failure below support risks a pullback toward 0.7033.
Since its 17 April 2026 intraday high of 0.7222, the AUD/USD has staged a minor corrective pull-back of -1.6% within its medium-term uptrend phase in place since 30 March 2026, towards a near-term support of 0.7120 on Friday, 24 April 2026.
The recent minor consolidation seen in the price actions of the AUD/USD has been primarily driven by the fluid situation in the US-Iran war that is now entering its 9th week.
The extended ceasefire agreement without a definite date announced last week by US President Trump does not lead to a second round of peace deal resolution talks, as both sides continue to impose blockages in the Strait of Hormuz that disrupt a crucial waterway for global oil and energy flows, putting lingering fears of stagflation on the radar.
AUD/USD is now behaving like a “risk asset”
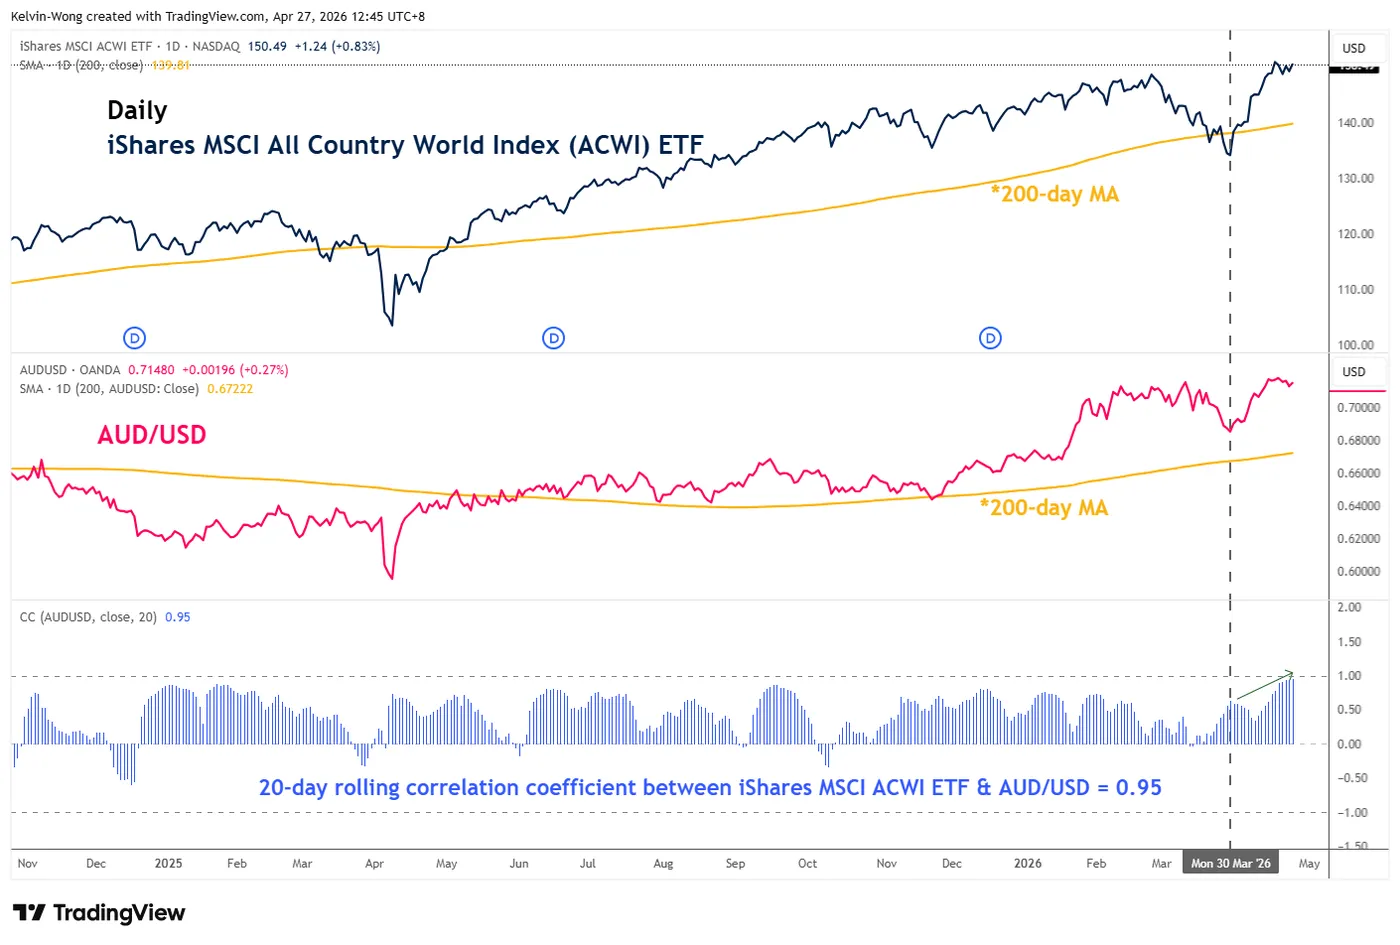
Fig. 1: Movement of iShares MSCI All Country World Index ETF with AUD/USD as of 27 Apr 2026 (Source: TradingView).
As a result, the Australian dollar has become increasingly sensitive to shifts in risk sentiment, with stagflation fears overshadowing its traditional characteristics as a “commodity currency” and hawkish guidance from the Australian central bank, RBA.
Since mid-March 2026, AUD/USD has exhibited a much closer alignment with global equities. The 20-day rolling correlation with the iShares MSCI All Country World Index (ACWI) ETF has surged to 0.95, up sharply from 0.62 on 30 March 2026 (see Fig. 1).
In today’s early Asia session on Monday, 27 April 2026, a potential breakthrough to allow the Strait of Hormuz to return to its operations may bear fruit.
Axios reported that Iran has given the US a new proposal to reopen the Strait of Hormuz and end the war, which includes putting off nuclear negotiations through Pakistan. So far, no official statements on this matter from the US White House administration.
Global markets reacted with risk-on optimism today, where an earlier gapped down of -0.3% at the start of Monday’s Asian session inflicted on the S&P 500, and Nasdaq 100 E-mini futures have been totally erased, while the S&P 500 E-mini futures is trading almost unchanged and the Nasdaq 100 E-mini futures is up marginally by 0.17% to a fresh intraday all-time high at 27,480 at this time of writing.
The AUD/USD has reacted positively in tandem with the US stock index futures, as it rose by 0.25% to trade higher at 0.7165, above Friday’s 24 April minor swing low of 0.7120.
Let’s now focus on the technical factors to determine AUD/USD’s potential short-term trajectory (1 to 3 days).
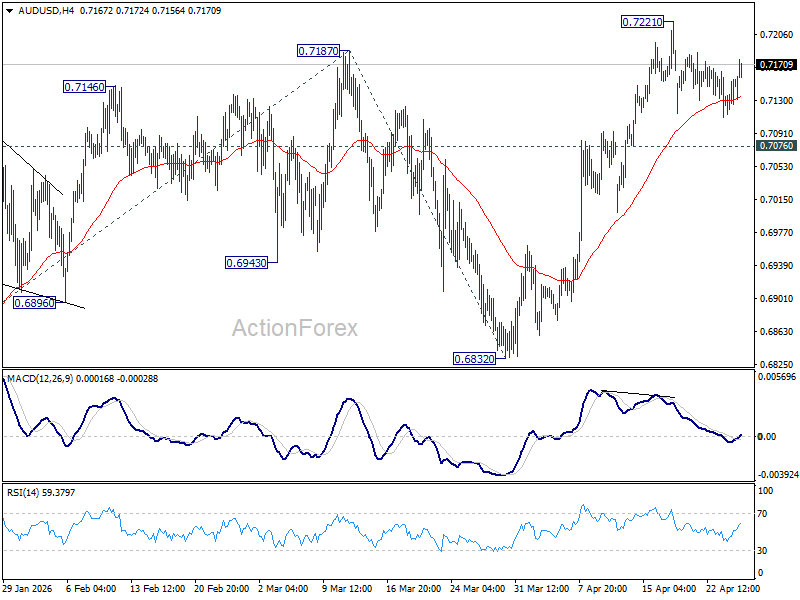
AUD/USD – Bullish momentum revival above 0.7090
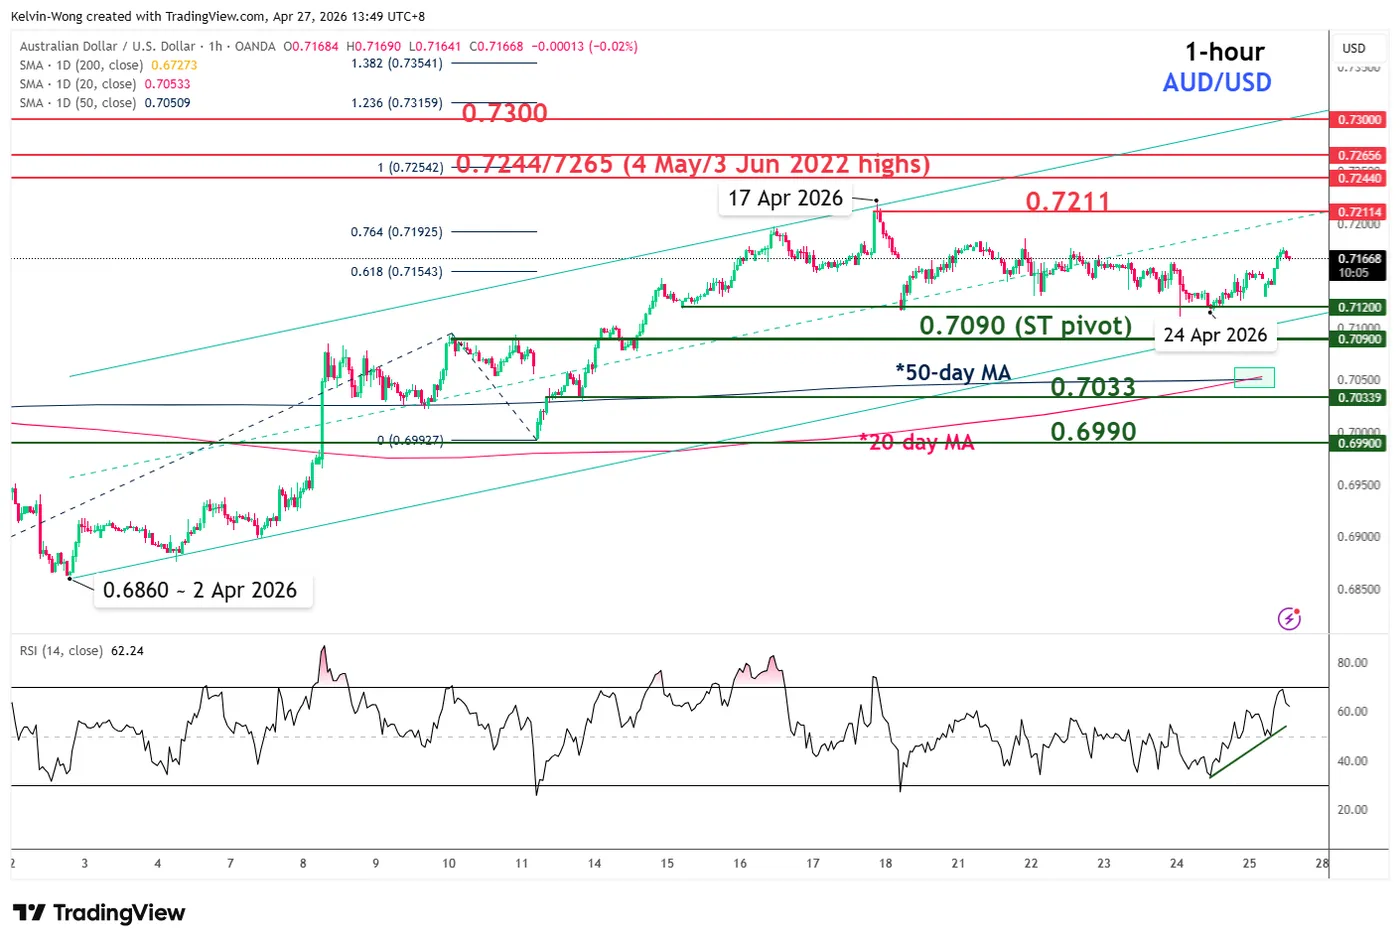
Fig. 2: AUD/USD minor trend as of 27 Apr 2026 (Source: TradingView).
Watch the 0.7090 key short-term pivotal support on the AUD/USD. A clearance above the near-term resistance of 0.7211 (17 April 2026 minor swing high area) increases the odds of a fresh bullish impulsive up move sequence for the next intermediate resistances to come in at 0.7244/7265 and 0.7300 (also a Fibonacci extension) (see Fig. 2).
On the other hand, failure to hold and an hourly close below 0.7090 invalidates the bullish bias for another round of minor corrective decline to expose the next intermediate support at 0.7033 (close to the 20-day and 50-day moving averages).
Key elements to support the near-term bullish bias on the AUD/USD
- Today’s intraday bounce seen in the AUD/USD has taken place close to the lower boundary of its minor ascending channel in place since the 2 April 2026 low of 0.6860.
- The 20-day moving average has just flashed out a bullish crossover condition above its 50-day moving average.
- The hourly RSI momentum indicator has managed to find support on its ascending trendline at around the 50 level.
GBP/USD Builds Momentum While EUR/GBP Dips Once More
GBP/USD is showing positive signs above 1.3500 and 1.3525. EUR/GBP declined and is now consolidating losses below 0.8700.
Important Takeaways for GBP/USD and EUR/GBP Analysis Today
- The British Pound started a fresh increase above 1.3500 to enter a positive zone.
- There was a break above a key bearish trend line with resistance at 1.3510 on the hourly chart of GBP/USD at FXOpen.
- EUR/GBP is trading in a bearish zone below the 0.8685 pivot level.
- There is a connecting bearish trend line forming with resistance near 0.8665 on the hourly chart at FXOpen.
GBP/USD Technical Analysis
On the hourly chart of GBP/USD at FXOpen, the pair remained well-bid above 1.3450. The British Pound started a decent increase above 1.3470 against the US Dollar.
The bulls were able to push the pair above the 50-hour simple moving average and 1.3500. The pair even climbed above a key bearish trend line with resistance at 1.3510. A high was formed at 1.3548, and the pair is now consolidating gains above the 23.6% Fib retracement level of the upward move from the 1.3447 swing low to the 1.3548 high.
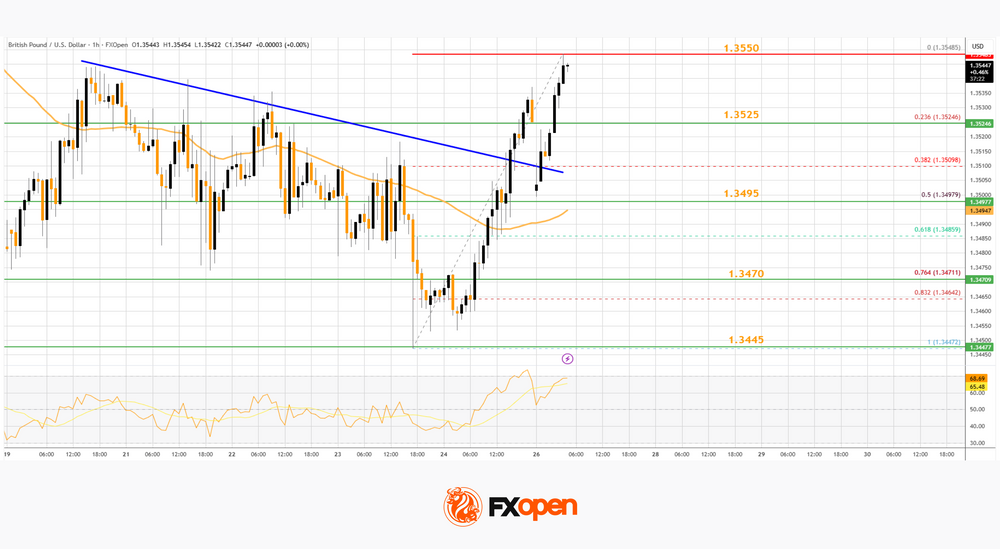
On the upside, the GBP/USD chart indicates that the pair is facing resistance near 1.3550. The next hurdle for the bulls could be 1.3565. A close above 1.3565 could open the doors for a move toward 1.3600. Any more gains might send GBP/USD toward 1.3660.
On the downside, the bulls might remain active near 1.3525. If there is a downside break below 1.3525, the pair could accelerate lower. The first major support is at 1.3495 and the 50% Fib retracement, below which the pair could test 1.3470.
The next key area for the bulls could be 1.3445, below which the pair could test 1.3400. Any more losses could lead the pair toward 1.3350.
EUR/GBP Technical Analysis
On the hourly chart of EUR/GBP at FXOpen, the pair started a steady decline from well above 0.8720. The Euro traded below 0.8695 against the British Pound.
The EUR/GBP chart suggests that the pair even declined below 0.8670 and the 50-hour simple moving average. A low was formed at 0.8650, and the pair is now consolidating losses. There was a move above 0.8665 and toward the 23.6% Fib retracement level of the downward move from the 0.8720 swing high to the 0.8650 low.
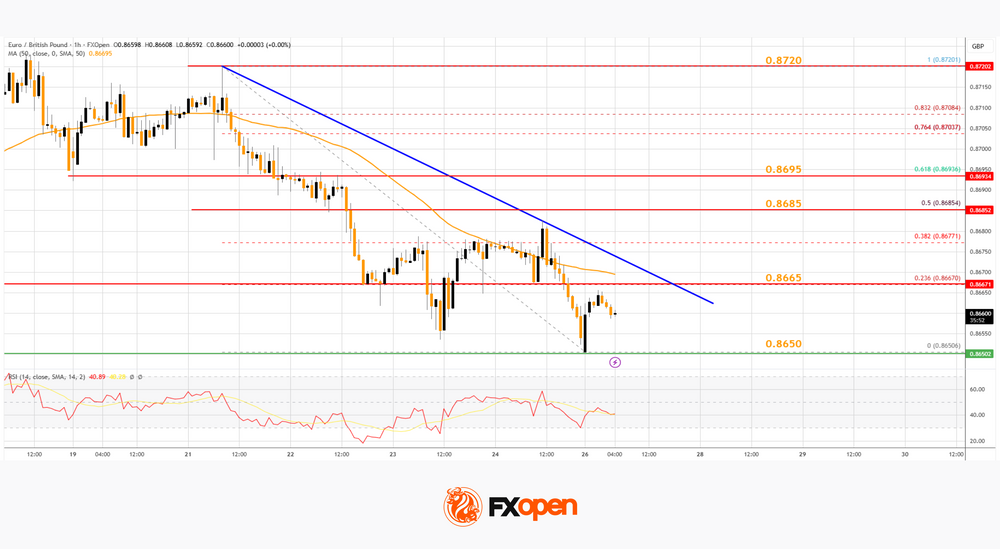
The pair is now facing resistance near a connecting bearish trend line at 0.8665. The next major barrier for the bulls could be 0.8685 and the 50% Fib retracement.
A close above 0.8685 might accelerate gains. In the stated case, the bulls may perhaps aim for a test of 0.8695. Any more gains might send the pair toward the 0.8720 pivot.
Immediate support sits near 0.8650. The first key zone sits at 0.8620. A downside break below 0.8620 might call for more downsides. In the stated case, the pair could drop toward 0.8565.
Trade over 50 forex markets 24 hours a day with FXOpen. Take advantage of low commissions, deep liquidity, and spreads from 0.0 pips (additional fees may apply). Open your FXOpen account now or learn more about trading forex with FXOpen.
This article represents the opinion of the Companies operating under the FXOpen brand only. It is not to be construed as an offer, solicitation, or recommendation with respect to products and services provided by the Companies operating under the FXOpen brand, nor is it to be considered financial advice.
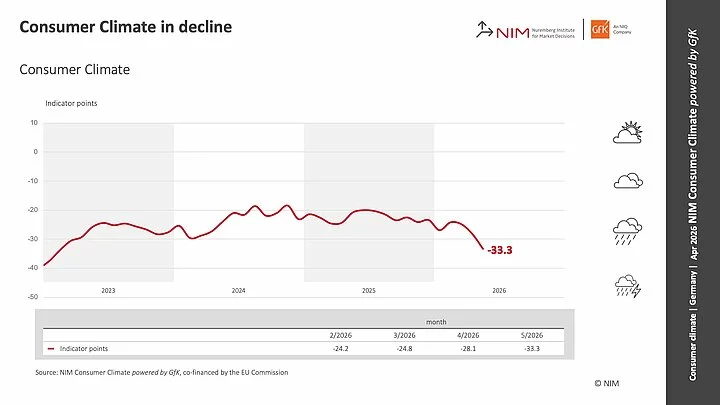
German Gfk Consumer Confidence Sinks to Two-Year Low as Inflation and War Fears Hit Sentiment
Germany’s GfK Consumer Climate for May fell sharply from -28.1 to -33.3, marking its lowest level since February 2023 and signaling further deterioration in household sentiment. The decline reflects mounting pressure on consumers as inflation expectations surge again, eroding purchasing power and confidence.
Underlying components point to broad-based weakness. Income expectations plunged from -6.3 to -24.4 in April, while willingness to buy slipped from -10.9 to -14.4. Although willingness to save eased slightly from 18.5 to 16.1, it remains elevated, suggesting households are still prioritizing precautionary behavior over consumption.
According to NIM’s Rolf Bürkl, income expectations are “literally collapsing” under the weight of rising inflation, leaving consumers increasingly reluctant to commit to major purchases.
The ongoing conflict involving Iran is weighing on economic expectations, with the outlook for Germany’s economy over the next 12 months deteriorating further from -6.9 to -13.7. The reading is now comparable to levels seen at the start of the Ukraine war in April 2022.
| Indicator | Previous | Latest | Change |
|---|---|---|---|
| GfK Consumer Climate (May) | -28.1 | -33.3 | ↓ -5.2 |
| Income Expectations (Apr) | -6.3 | -24.4 | ↓ -18.1 |
| Willingness to Buy (Apr) | -10.9 | -14.4 | ↓ -3.5 |
| Willingness to Save (Apr) | 18.5 | 16.1 | ↓ -2.4 |
| Economic Expectations (12m) | -6.9 | -13.7 | ↓ -6.8 |
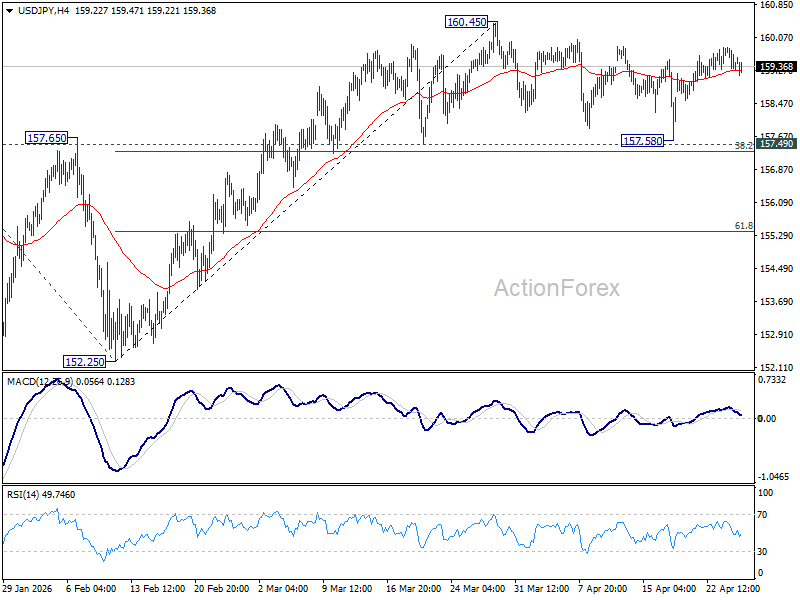
USD/JPY Daily Outlook
Daily Pivots: (S1) 159.13; (P) 159.49; (R1) 159.73; More...
Range trading continues in USD/JPY and intraday bias remains neutral for the moment. Further rise is expected with 157.49 cluster support (38.2% retracement of 152.25 to 160.45 at 157.31) intact. On the upside break of 160.45 will target a retest on 161.94 high. However, firm break of 157.31/49 will bring deeper fall back to 61.8% retracement at 155.38 next.
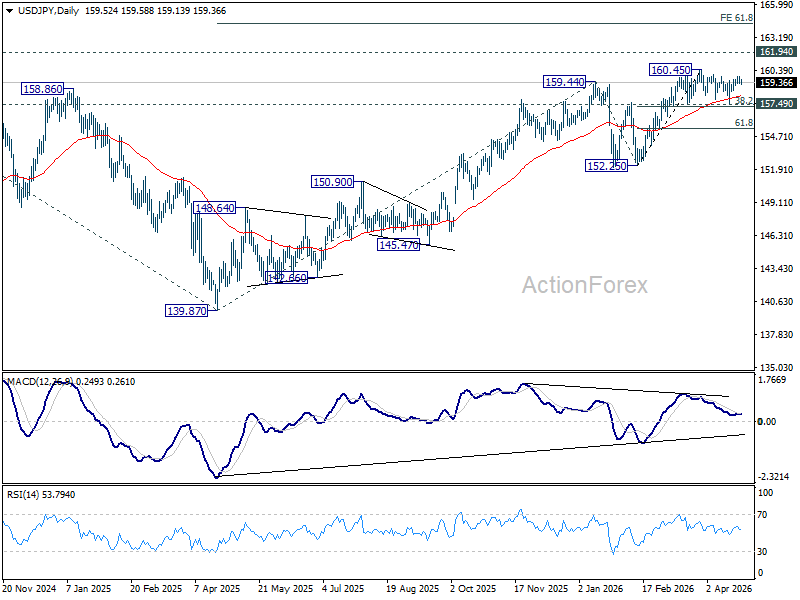
In the bigger picture, outlook is unchanged that corrective pattern from 161.94 (2024 high) should have completed with three waves at 139.87. Larger up trend from 102.58 (2021 low) could be ready to resume through 161.94. This will remain the favored case as long as 55 W EMA (now at 153.81) holds. Firm break of 161.94 will pave the way to 61.8% projection of 102.58 to 161.94 from 139.87 at 176.75.
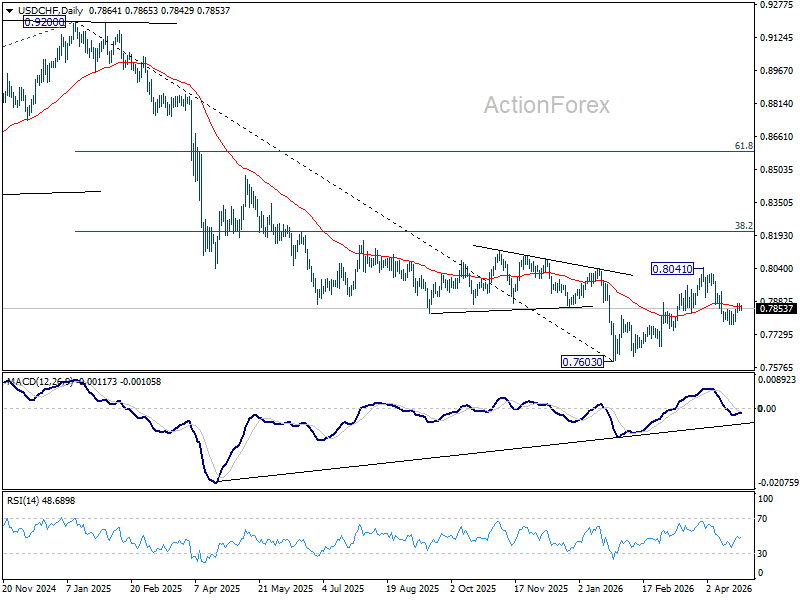
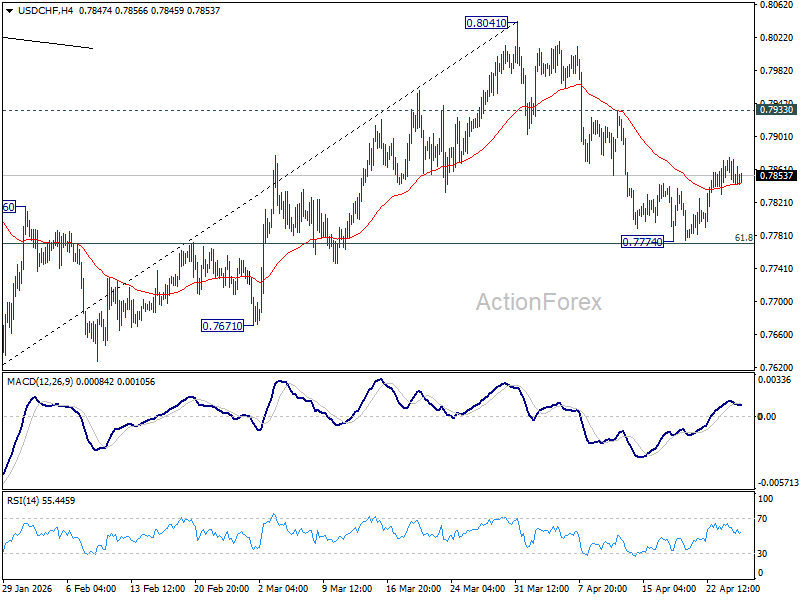
USD/CHF Daily Outlook
Daily Pivots: (S1) 0.7837; (P) 0.7858; (R1) 0.7870; More….
Intraday bias in USD/CHF remains neutral for the moment. Further decline is expected as long as 0.7933 resistance holds. On the downside, sustained break of 61.8% retracement of 0.7603 to 0.8041 at 0.7770 will pave the way to retest 0.7603 low. However, break of 0.7933 resistance will bring stronger rise back to retest 0.8041 high.
In the bigger picture, rebound from 0.7603 medium term bottom is seen as correcting the fall from 0.9200 only. Rejection by 55 W EMA (now at 0.8053) will affirm this bearish case, and setup down trend resumption to 100% projection of 1.0146 (2022 high) to 0.8332 from 0.9200 at 0.7382 at a later stage. Though, sustained break of 55 W EMA will suggest that it's probably correcting the larger scale down trend from 1.0146 (2022 high).