Sample Category Title
Gold and Silver Face Asymmetric Downside Risk as Dollar Weakness Fails Ahead of Fed, ECB
Gold and Silver are not responding to Dollar—and that is a warning signal.
Despite a weaker USD at the start of the week, both Gold and Silver have failed to attract meaningful buying interest, trading instead in narrow ranges. This breakdown in the usual inverse correlation suggests that markets are shifting focus away from currency moves and toward a more dominant driver: central bank policy risk.
This week’s lineup of major central bank meetings has effectively frozen conviction. With the Fed, ECB, and BoE all set to speak, traders are reluctant to take directional bets in precious metals until there is clarity on how policymakers intend to respond to the latest oil-driven inflation shock.
But the paralysis masks a clear asymmetry. The range of outcomes may be uncertain, but the direction of risk is not. Dovish outcomes are effectively off the table. Collectively, at best, central banks can deliver cautious holds, but even those would still imply a tightening bias rather than a pivot toward easing.
With dovish outcomes off the table, precious metals face asymmetric downside risk as central banks collectively lean hawkish. That is the key dynamic driving current price action. Even if policymakers sound cautious, the absence of easing signals removes a major pillar of support for Gold and Silver.
The ECB and BoE illustrate this tension clearly. Both are expected to hold in the near term, but markets continue to price further tightening, particularly from the ECB as early as June. Any cautious messaging tied to growth concerns may prevent an immediate selloff in precious metals, but it will not be enough to generate a sustained rally. The path of policy remains upward, even if the pace is slower.
For the Federal Reserve, Chair Jerome Powell’s likely message—no hikes, but no cuts either—reinforces the idea that policy is restrictive and will stay that way. Markets may be looking ahead to a potentially more dovish stance under Kevin Warsh, but that transition is not yet reflected in current policy.
At least, that the outlook until the Strait of Hormuz is fully reopened.
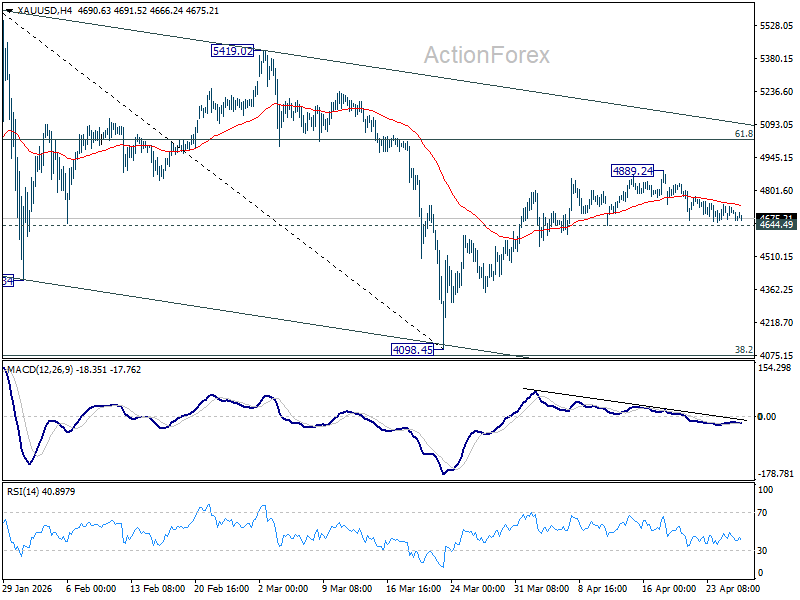
Technically, for Gold, focus stays on 4644.49 support. Decisive break there will add to the case that rebound from 4098.45 has completed at 4889.24 already. That should turn near term outlook bearish for deeper fall back to 4098.45 low, and possibly another take on 4000 psychological level.
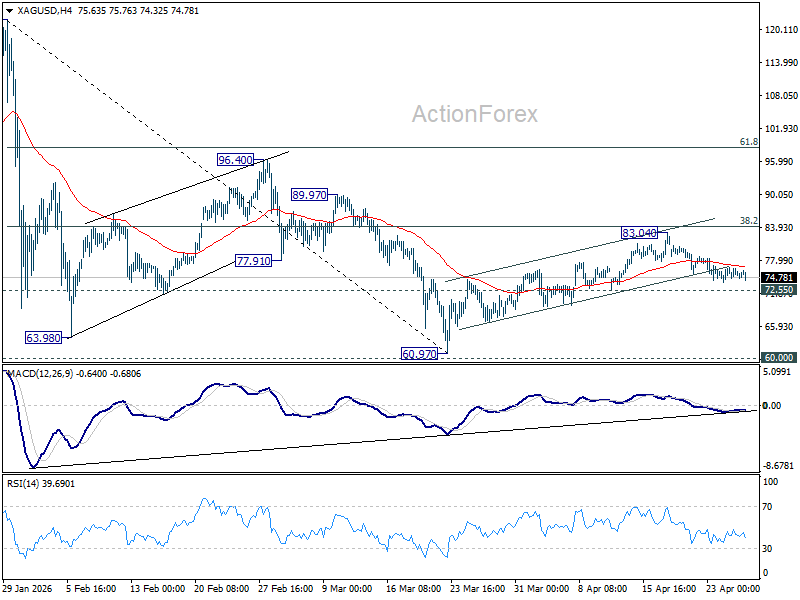
Similarly, for Silver, firm break of 72.55 support should confirm that rebound from 60.97 has completed at 83.04. Deeper decline should then be seen back to 60.97, and possibly further to 60 psychological level.
EUR/USD: Cautiously bullish above 1.1700 ahead of FOMC and ECB
- Overall Bias: The EUR/USD narrative has shifted from bearish to cautiously bullish
- Key Support: The bullish bias remains firm as long as the price sustains a hold above the critical 1.1700–1.1710 support zone.
- Tactical Scenarios: Bulls need to defend the 1.1700 area, with targets at 1.1769 and 1.1800; a break below 1.1700 triggers the bearish scenario.
EUR/USD finds itself grinding on a quiet Monday ahead of what is a busy week from a data and monetary policy perspective.
EUR/USD gapped lower after the weekend but has since recovered the weekend losses and is trading marginally higher on the day. This sort of price action could continue in the early part of the week with volatility likely to peak on Wednesday and Thursday when we have the FOMC and ECB meetings.
Of course any deal between the US and Iran in the interim could also shake up volatility and could potentially lead to USD weakness as the safe haven bets may begin to unwind. Keep that in mind while reading the technical setups and opportunities that may materialize below.
H4 Chart Analysis: The Structural Shift
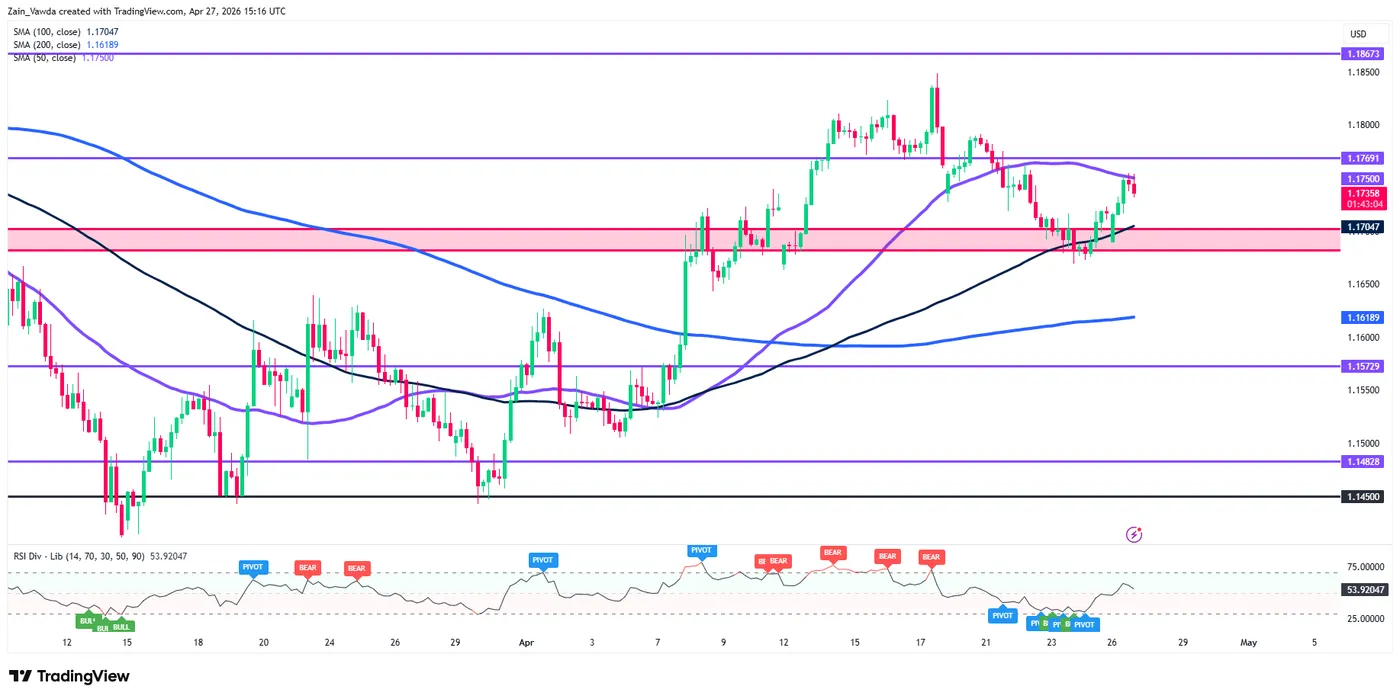
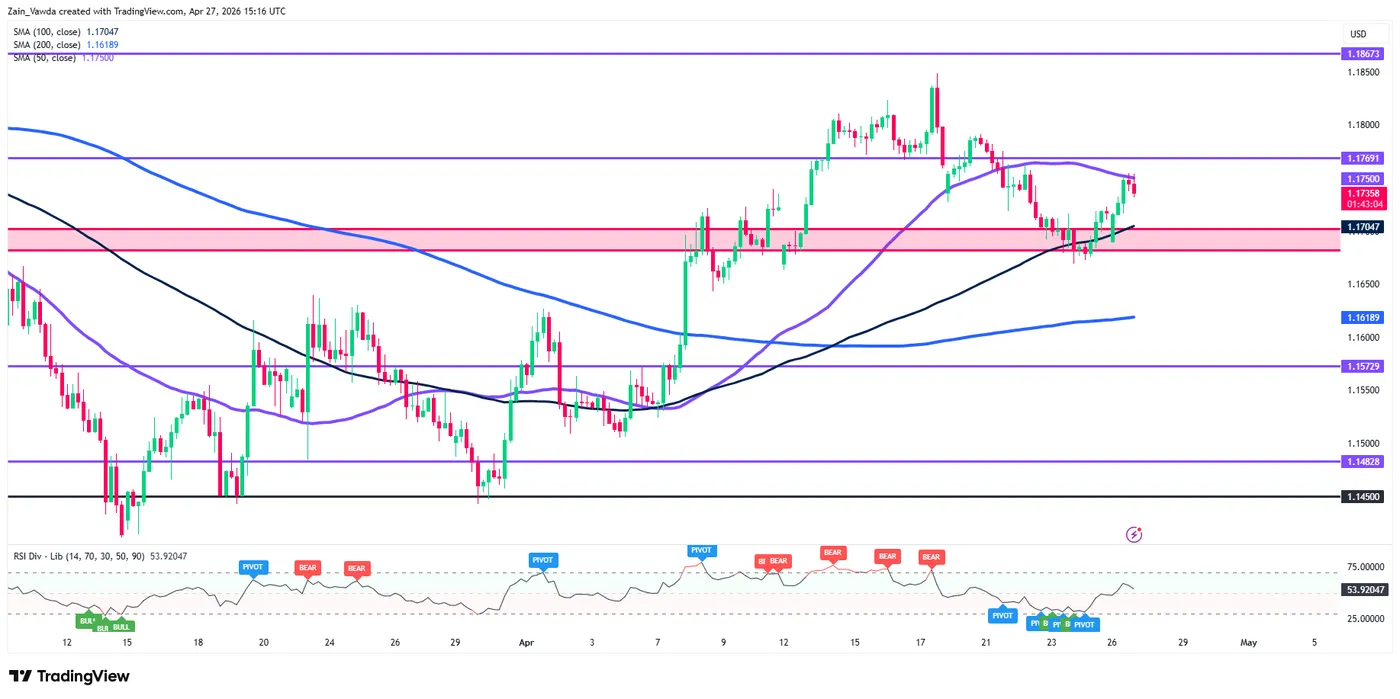
On the H4 timeframe, the narrative has shifted from bearish to cautiously bullish. The most notable development is the price action reclaiming the 1.1700 psychological handle, which had previously acted as a stubborn ceiling.
The pair has successfully pushed above the 100, and 200-period Simple Moving Averages (MAs). Currently price is rejecting the 50-day MA opening up a potential retest of the 100-day MA at 17047. A sustained hold above the 1.1700–1.1710 support zone keeps the bullish bias firmly intact.
The RSI (Relative Strength Index) is currently hovering around 54, suggesting there is ample "runway" left before the pair reaches overbought territory.
EUR/USD Four-Hour Chart, April 27, 2026
Source: TradingView.com
H1 Chart Analysis: Consolidation Before the Next Leg?
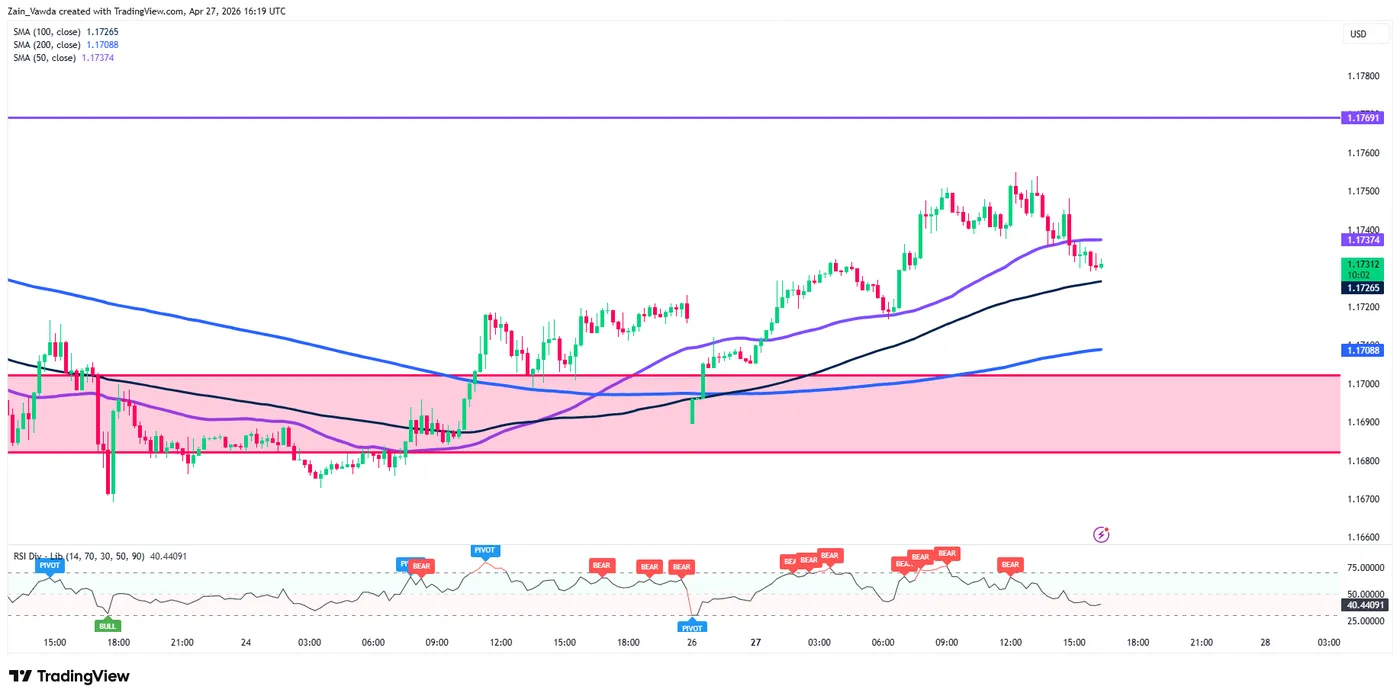
Zooming into the H1 chart, we see a more granular view of the recent rally. The pair hit a local peak near 1.1754 (just shy of the 1.1769 resistance level) before edging lower.
Currently, the H1 price has rejected the 200-MA (blue line) as dynamic support. This is a critical junction; if the H1 can print a bullish engulfing candle or a long-wick rejection near this 1.1716-1.1700 area, it would signal that buyers are ready to defend the intraday trend.
The RSI on this timeframe has cooled off from overbought levels, effectively "resetting" for a potential move higher with some leeway for a drop toward 50 first.
EUR/USD One-Hour Chart, April 27, 2026
Source: TradingView.com
M15 Analysis & Scenarios: Tactical Planning for Upcoming Sessions
The Bullish Scenario: For the bulls to maintain control, they need to defend the 1.1710 - 1.1700 area. An ideal entry for a long position would be a successful retest of the M15 200-MA (blue line) followed by a break back above 1.1750.
- Target 1: 1.1769 (Recent high/Horizontal resistance).
- Target 2: 1.1800 (Psychological level).
- Invalidation: A 15-minute candle close below 1.1700.
The Bearish Scenario: The bears need to see a breakdown of the current consolidation. If the price fails to hold the 1.1700 level, we could see a "stop-run" back toward the primary support zone.
- Trigger: A break below 1.1700 would signal a deeper correction.
- Target 1: 1.1685.(Value area high).
- Target 2: 1.1643 April 8 swing low.
- Confirmation: Watch for the RSI on the M15 to drop below 50 to confirm momentum shift and look for an entry.
Key Levels to Watch:
- Resistance: 1.1769, 1.1800, 1.1867.
- Support: 1.1700, 1.1680, 1.1643
EUR/USD M15 Chart, April 27, 2026
Source:TradingView.com
The overall technical posture for EUR/USD remains tilted to the upside as long as the pair remains above the 1.1700 pivot zone. Traders should keep a close eye on the US Dollar Index (DXY) for broader directional cues, but from a pure price action standpoint, the bulls appear to be in the driver's seat heading into the next session.
Nasdaq-100 Wave Analysis
Nasdaq-100: ⬆️ Buy
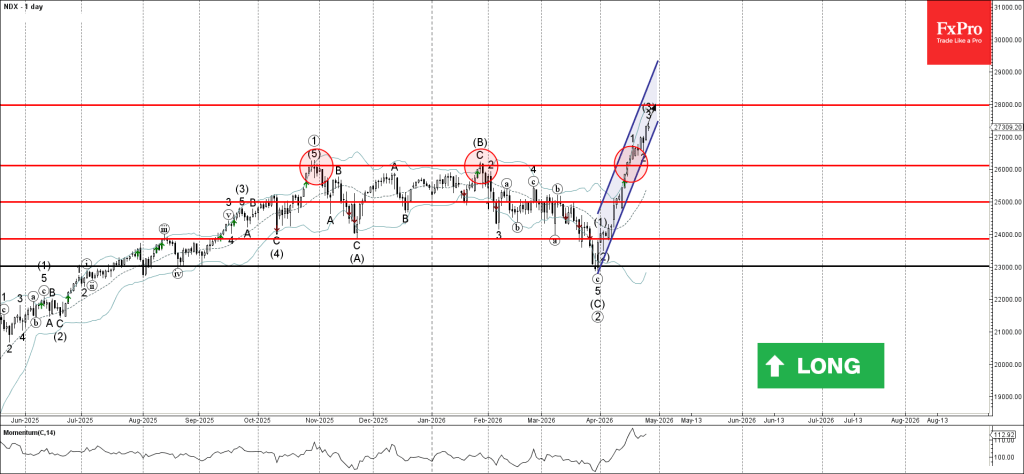
- Nasdaq-100 index broke multi-month resistance level 26120.00
- Likely to rise to resistance level 28000.00
Nasdaq-100 index recently broke above the strong multi-month resistance level 26120.00 (which has been reversing the price from October).
The breakout of the resistance level 26120.00 accelerated the active short-term impulse wave 3 – which belongs to the intermediate impulse wave (3) from the start of April.
Given the clear daily uptrend, Nasdaq-100 index can be expected to rise to the next resistance level 28000.00 (target price for the completion of the active impulse wave (3)).
AUDJPY Wave Analysis
AUDJPY: ⬆️ Buy
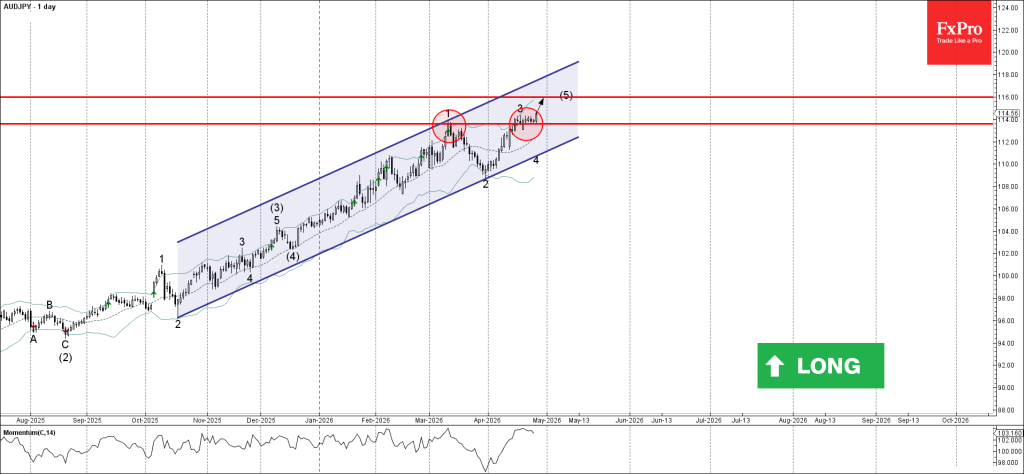
- AUDJPY reversed from support level 113.60
- Likely to rise to resistance level 116.00
AUDJPY currency pair recently reversed up from the support level 113.60 (former resistance from the start of March, acting as the support after it was broken earlier this month).
The upward reversal from the support level 113.60 continues the active intermediate impulse wave (5) from December.
Given the clear daily uptrend, AUDJPY currency pair can be expected to rise to the next resistance level 116.00 (target price for the completion of the active impulse wave (5)).
Eco Data 4/28/26
| GMT | Ccy | Events | Act | Cons | Prev | Rev |
|---|---|---|---|---|---|---|
| 23:30 | JPY | Unemployment Rate Mar | 2.70% | 2.60% | 2.60% | |
| 03:04 | JPY | BoJ Interest Rate Decision | 0.75% | 0.75% | 0.75% | |
| 06:30 | JPY | BoJ Press Conference | ||||
| 13:00 | USD | S&P/CS Composite-20 HPI Y/Y Feb | 0.90% | 1.00% | 1.20% | |
| 13:00 | USD | Housing Price Index M/M Feb | 0.00% | 0.10% | 0.10% | 0.20% |
| 14:00 | USD | Consumer Confidence Apr | 92.8 | 89.4 | 91.8 | 92.2 |
| 23:30 | JPY |
| Unemployment Rate Mar | |
| Actual | 2.70% |
| Consensus | 2.60% |
| Previous | 2.60% |
| 03:04 | JPY |
| BoJ Interest Rate Decision | |
| Actual | 0.75% |
| Consensus | 0.75% |
| Previous | 0.75% |
| 06:30 | JPY |
| BoJ Press Conference | |
| Actual | |
| Consensus | |
| Previous | |
| 13:00 | USD |
| S&P/CS Composite-20 HPI Y/Y Feb | |
| Actual | 0.90% |
| Consensus | 1.00% |
| Previous | 1.20% |
| 13:00 | USD |
| Housing Price Index M/M Feb | |
| Actual | 0.00% |
| Consensus | 0.10% |
| Previous | 0.10% |
| Revised | 0.20% |
| 14:00 | USD |
| Consumer Confidence Apr | |
| Actual | 92.8 |
| Consensus | 89.4 |
| Previous | 91.8 |
| Revised | 92.2 |
Sunset Market Commentary
Markets
Oil isn’t impressed by the Axios report of this morning. The news outlet wrote that Iran offered a new proposal to the US which states that it is ready to reopen the Hormuz Strait, provided that the US ends its blockade too. Nuclear talks would come later. The US administration has yet to respond to the fresh proposal but markets don’t seem to expect anything positive to come out from it. Brent rose to as high as $108/barrel before easing somewhat again to $107.3 currently. It’s enough for core bond yields to add 1 to 3 bps, be it in technically irrelevant trading. The avalanche of central bank meetings due this week creates significant event risk and we would expect it keeps yields more or less grounded (barring sharp energy price rises) until the marathon begins. The Bank of Japan kicks of tomorrow, is followed by the Fed on Wednesday with the ECB and Bank of England taking center stage on Thursday. None of them will budge but we’ll be looking for some to lay the groundwork for future moves as the ongoing war and elevated energy prices increasingly find their way into the real economy, pushing up inflation and inflation expectations. Short-to-medium term gauges for the latter such as the 1-year, 1-year forward inflation swap as of Friday rose beyond the previous highs seen at 2.2% to hit the highest in almost two years. The BoJ was already preparing for further rate hikes even prior to the conflict and we’ll be monitoring the ECB and Bank of England for similar signs. Longer-term yields today do tick higher (inflation risks), but trading is technically irrelevant with changes being less than 2 bps in both the US and Europe.
European equities added up to 0.7% (EuroStoxx50) at some point, rebounding after correcting lower last week. But momentum dwindled with the entering of US investors. Gains are now close to flat. US bourses are catching a breather today after having rallied to new record highs (S&P500, Nasdaq) on Friday. Expected volatility, measured by the VIX index, is higher than at the start of the year but around the levels seen just before the first US-Israeli attacks on Iran in the weekend bridging February with March.
The dollar on currency markets is trading on the backfoot, posting back-to-back losses against its European peer. EUR/USD rises to the 1.175 area. DXY (trade-weighted dollar index) followed the intraday trajectory of oil, opening higher around 98.6 but then nudging south again to trade around 98.25. The yen creates some (very) limited room away from USD/JPY 160. Commodity-based currencies such as the Aussie and kiwi dollar as well as the Norwegian krone are among the best performers today.
News & Views
The ECB published its quarterly SAFE survey on the access of finance of enterprises. It showed a further tightening of lending conditions. Firms reported a significant net increase in bank loan interest rates (net 26%, up from 12% in Q4 2025). Other financing costs also rose sharply (net 37%) with collateral requirements remaining elevated (net 14%). Financing needs were broadly stable while loan availability deteriorated marginally. The war in the Middle East significantly boosted cost and price expectations, but not wage expectations. The latter even moderated from 3.1% to 2.8%. Input costs (including energy) are expected to rise by 5.8% over het next 12 months (up from 3.6% in Q4 2025) while selling prices are seen increasing by 3.5% (from 2.9%). Median one-year ahead inflation expectations from 2.6% to 3% with remained stable at 3% for the medium and long term. Upside inflation risks at the 5-year horizon increased, with 65% of firms reporting them (from 56%).
A survey from the Confederation of British Industry showed the broadest Y/Y-decline in retail sales in more than 40 years. The monthly retail sales volume measure dropped to -68 in April from -52 in March. 77% of firms reported sales were down compared with last year with only 9% reporting higher sale. Other details like orders placed (-46 from -26) or sales for the time of the year (-32 from -23) deteriorated as well, both for realized and expected sales. Expectations for next month fell from -49 to -60, the lowest level since March 2021.
EUR/USD Mid-Day Outlook
Daily Pivots: (S1) 1.1688; (P) 1.1706; (R1) 1.1741; More….
No change in EUR/USD's outlook and intraday bias remains neutral. Further rally is expected with 1.1662 support intact. On the upside, sustained trading above 61.8% retracement of 1.2081 to 1.1408 at 1.1824 will pave the way to retest 1.2081 high. However, firm break of 1.1662 support will indicate the the rebound fro 1.1408 has completed, and bring deeper decline back towards this low instead.
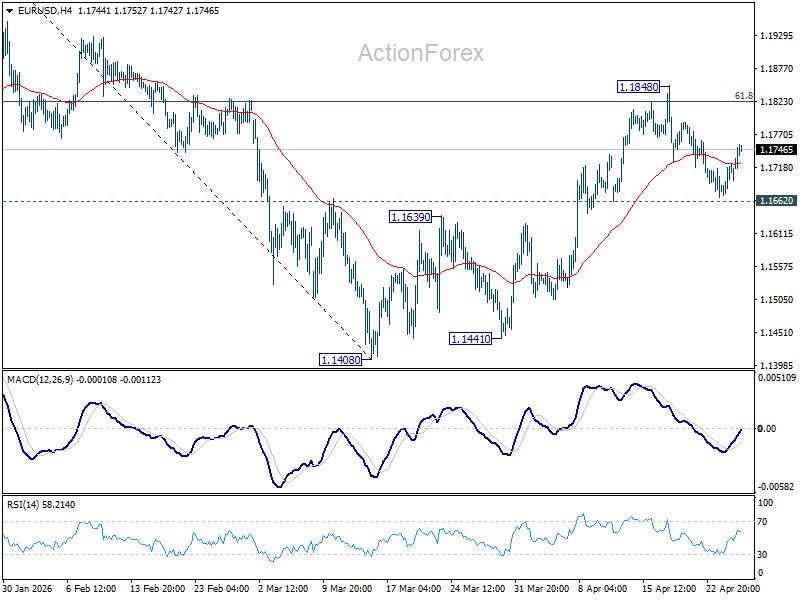
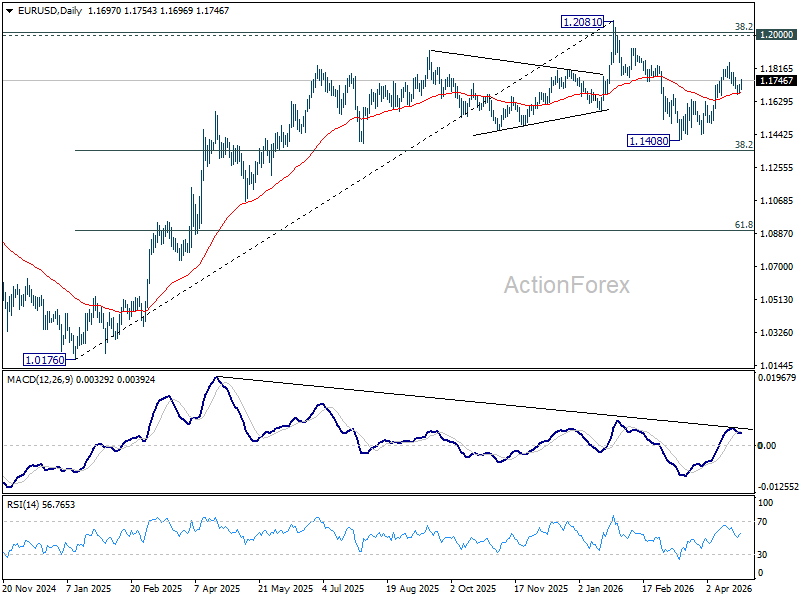
In the bigger picture, the strong support from 38.2% retracement of 1.0176 to 1.2081 at 1.1353 suggests that the pullback from 1.2081 is more likely a corrective move. Strong support was also found in 55 W EMA (now at 1.1530). Focus is back on 1.2 key cluster resistance level. Decisive break there will carry long term bullish implications. Nevertheless, break of 1.1408 support will revive the case of medium term bearish trend reversal.
GBP/USD Mid-Day Outlook
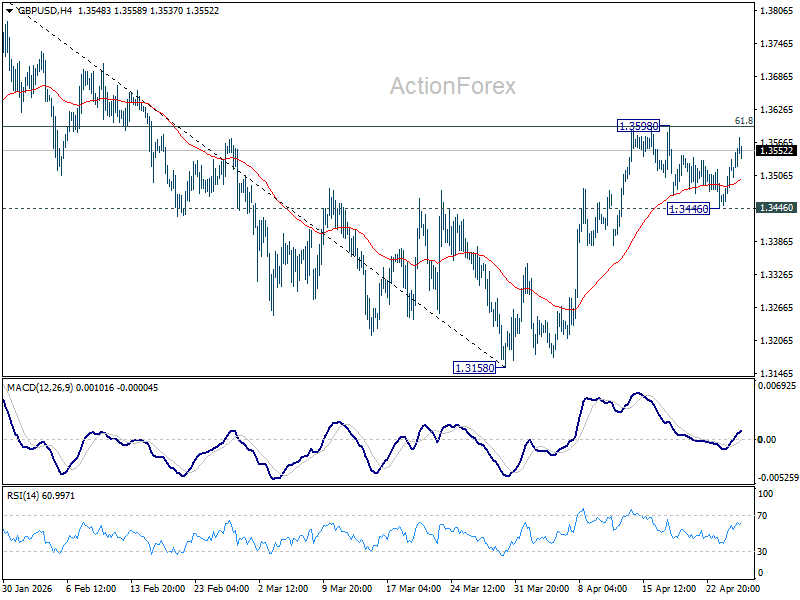
Daily Pivots: (S1) 1.3477; (P) 1.3508; (R1) 1.3563; More...
Intraday bias in GBP/USD remains neutral first, and further rise is expected as long as 1.3446 support holds. On the upside, firm break of 61.8% retracement of 1.3867 to 1.3158 at 1.3596 will pave the way to retest 1.3867 high. However, break of 1.3446 will turn bias back to the downside for deeper pullback.
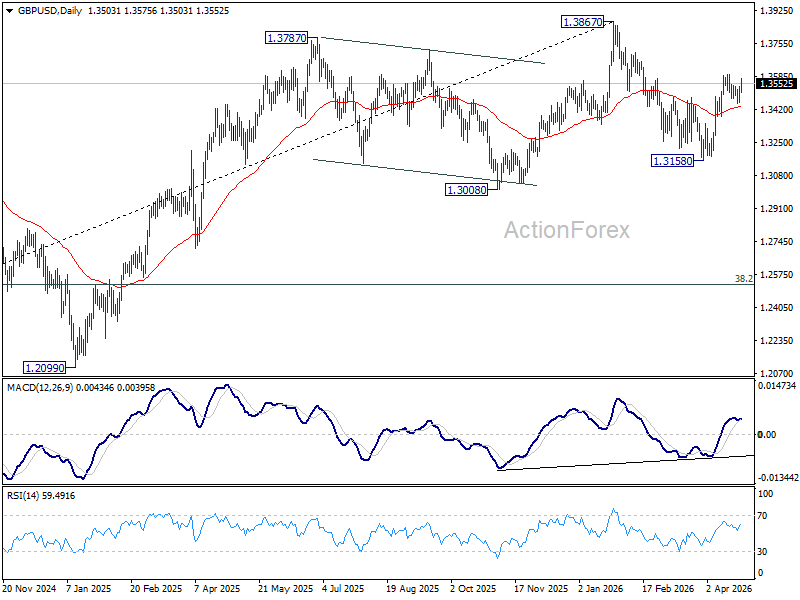
In the bigger picture, current development suggests that price actions from 1.3867 are merely a corrective pattern within the broader up trend from 1.0351 (2022 low). With 1.3008 support intact, medium term bullishness is maintained and break of 1.3867 is back in favor for a later stage, towards 1.4248 key resistance (2021 high).
USD/CHF Mid-Day Outlook
Daily Pivots: (S1) 0.7837; (P) 0.7858; (R1) 0.7870; More….
Intraday bias in USD/CHF stays neutral and outlook is unchanged. Further decline is expected as long as 0.7933 resistance holds. On the downside, sustained break of 61.8% retracement of 0.7603 to 0.8041 at 0.7770 will pave the way to retest 0.7603 low. However, break of 0.7933 resistance will bring stronger rise back to retest 0.8041 high.
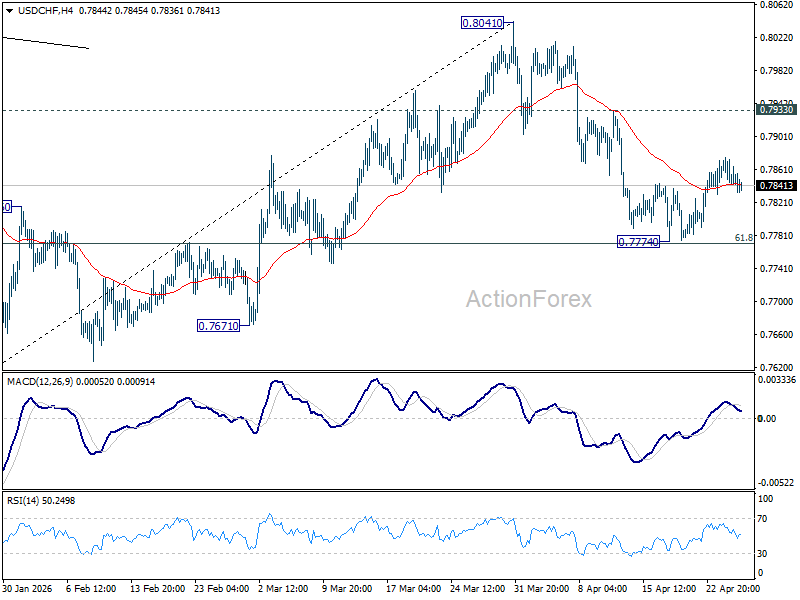
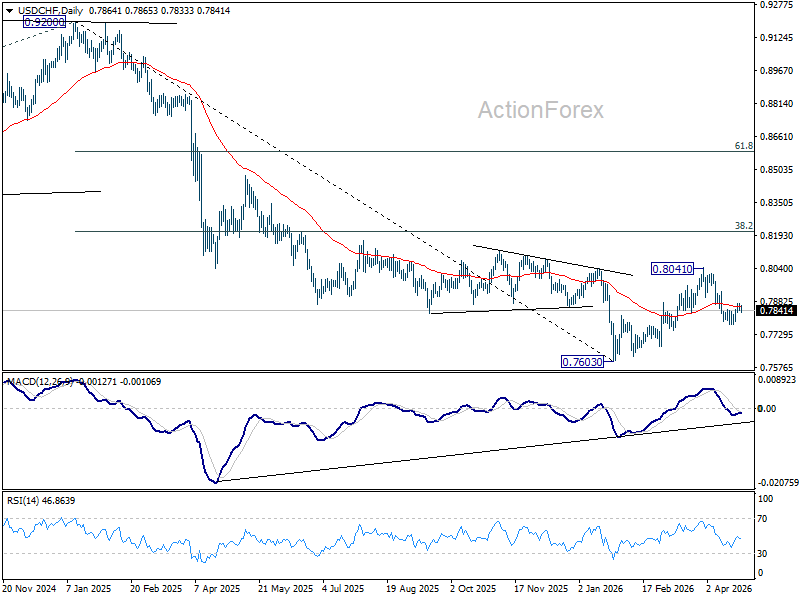
In the bigger picture, rebound from 0.7603 medium term bottom is seen as correcting the fall from 0.9200 only. Rejection by 55 W EMA (now at 0.8053) will affirm this bearish case, and setup down trend resumption to 100% projection of 1.0146 (2022 high) to 0.8332 from 0.9200 at 0.7382 at a later stage. Though, sustained break of 55 W EMA will suggest that it's probably correcting the larger scale down trend from 1.0146 (2022 high).
USD/JPY Mid-Day Outlook
Daily Pivots: (S1) 159.13; (P) 159.49; (R1) 159.73; More...
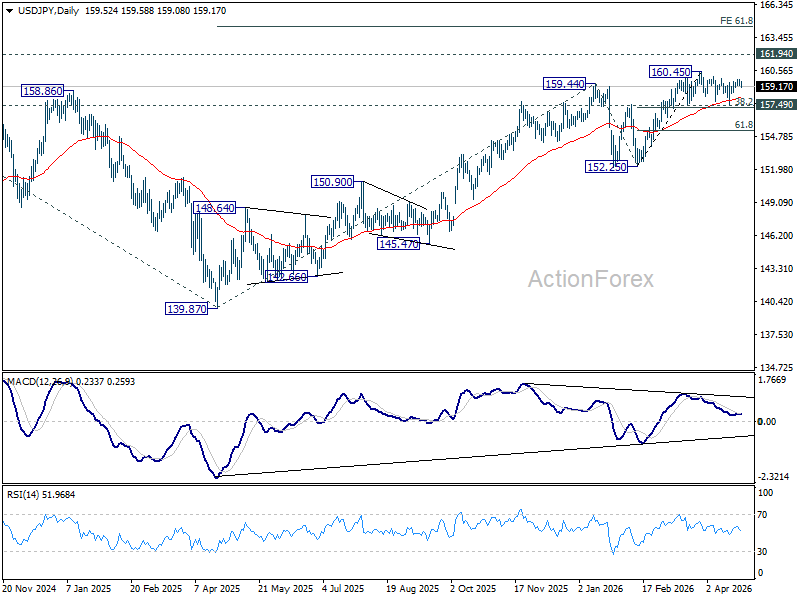
USD/JPY dips mildly today but remains bounded in established range below 160.45. Intraday bias remains neutral at this point. Further rise is expected with 157.49 cluster support (38.2% retracement of 152.25 to 160.45 at 157.31) intact. On the upside break of 160.45 will target a retest on 161.94 high. However, firm break of 157.31/49 will bring deeper fall back to 61.8% retracement at 155.38 next.
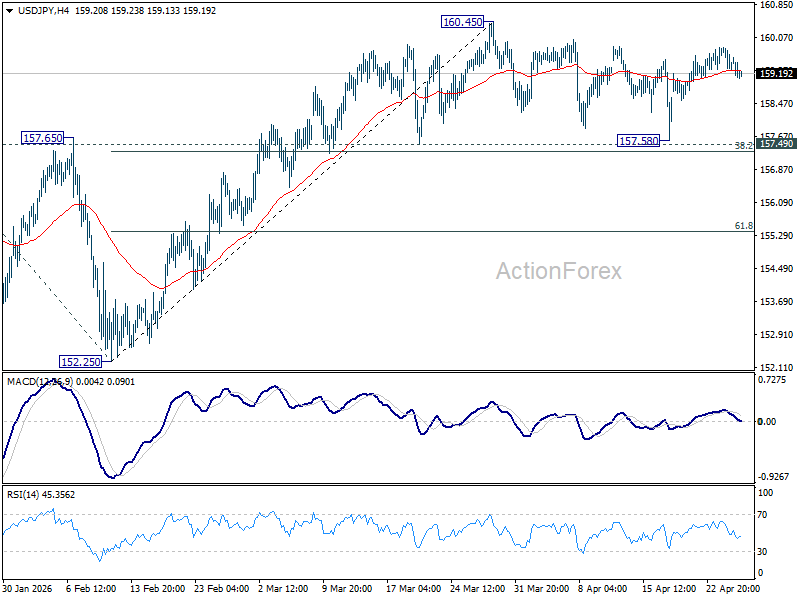
In the bigger picture, outlook is unchanged that corrective pattern from 161.94 (2024 high) should have completed with three waves at 139.87. Larger up trend from 102.58 (2021 low) could be ready to resume through 161.94. This will remain the favored case as long as 55 W EMA (now at 153.81) holds. Firm break of 161.94 will pave the way to 61.8% projection of 102.58 to 161.94 from 139.87 at 176.75.