Sample Category Title
Yen Gains Support Following Bank of Japan Decision
The Bank of Japan left its interest rate unchanged at 0.75% per annum, as widely expected. At the same time, it raised its inflation forecast for 2026 to 2.8%, up from 1.9% previously, while downgrading its GDP growth outlook to 0.5% from 1.0%. These revisions reflect the likely economic consequences of the ongoing Middle East conflict.
Investors are also monitoring developments surrounding Iran. Tehran has sent a new proposal to the US, but disagreements over the nuclear programme remain a key obstacle.
An additional factor is the stance of Japanese authorities. Finance Minister Satsuki Katayama reiterated her readiness to intervene in the foreign exchange market if necessary and emphasised increased coordination with the US on foreign exchange policy.
Technical Analysis
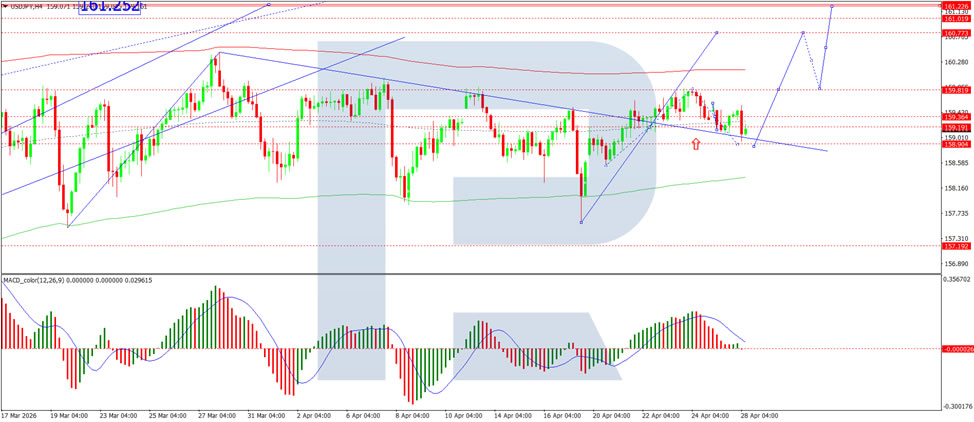
On the H4 chart, USD/JPY is trading within a consolidation range around the 159.36 level and is moving lower towards 158.90. A test of this level is likely, followed by a possible rebound towards 159.88 and potentially 160.77. Technically, this scenario is confirmed by the MACD indicator, with its signal line above zero but pointing firmly downwards, indicating the potential for further short-term downside before a recovery.
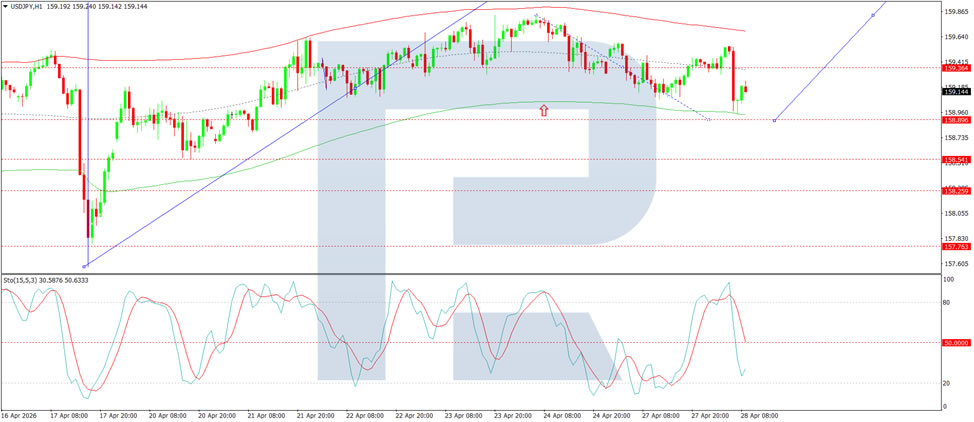
On the H1 chart, USD/JPY is developing a move lower towards 158.90. A rebound towards 159.88 may follow, with a possible extension to 160.77. The scenario is confirmed by the Stochastic oscillator, with its signal line below 50 and pointing firmly downwards towards 20, indicating that short-term downside pressure remains.
Conclusion
The yen has found some support following the Bank of Japan's policy decision, despite the BoJ leaving rates unchanged. The key takeaway for markets was the upward revision to inflation forecasts – from 1.9% to 2.8% –driven by the Middle East conflict, alongside a downgrade to GDP growth expectations. This suggests the BoJ is acknowledging persistent price pressures while balancing weaker economic activity. Additionally, Finance Minister Katayama's renewed commitment to currency intervention and US-Japan policy coordination has helped support the yen. Technically, USD/JPY may see further short-term downside towards 158.90 before a potential rebound. The overall direction will depend on geopolitical developments and any further signals from Japanese authorities regarding intervention.
Gold (XAU/USD) Selloff Deepens: Technical Breakdown and Rising Oil Prices Accelerates Bearish Momentum
- Gold prices are experiencing a selloff driven by rising oil prices (fueling inflation concerns) and dampened sentiment regarding a potential US-Iran deal
- Technical analysis indicates an accelerating bearish momentum, with Gold breaking below both the 100-MA and 200-MA on the H4 chart
- The primary downside target for sellers is the $4601 support level, while a relief rally would face resistance between the $4650 and $4700 zones.
Gold prices experienced a selloff in the Asian session as Oil prices continue to rise, stoking inflation concerns. Markets continue to be driven by the potential for a deal between the US and Iran.
As the situation is fluid any change in perception around a deal is knocking sentiment. Rumors that President Trump is not happy with the recent proposal submitted by Iran. This has dampened sentiment early on Tuesday and barring any comments is likely to remain the status quo for the European session.
H4 Chart: Bearish Momentum Accelerates
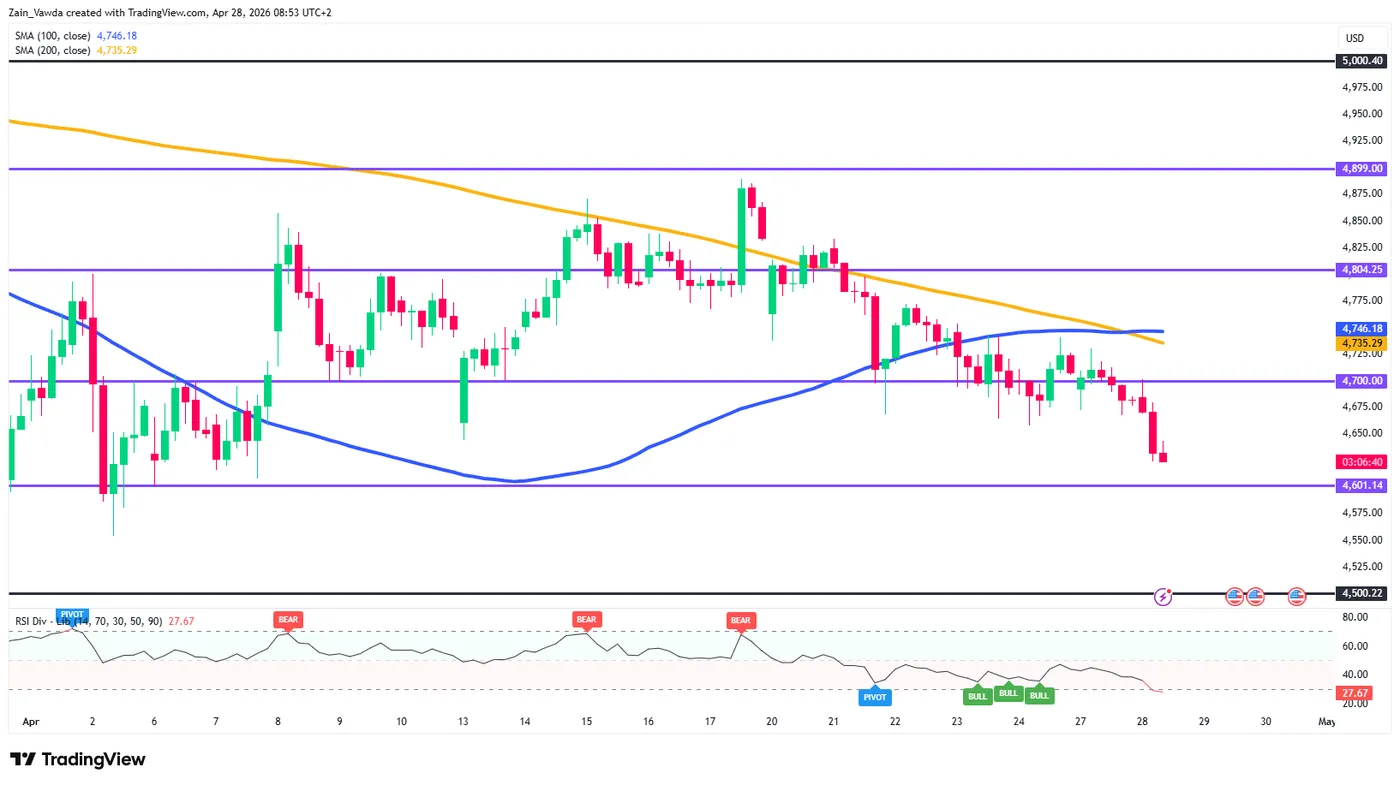
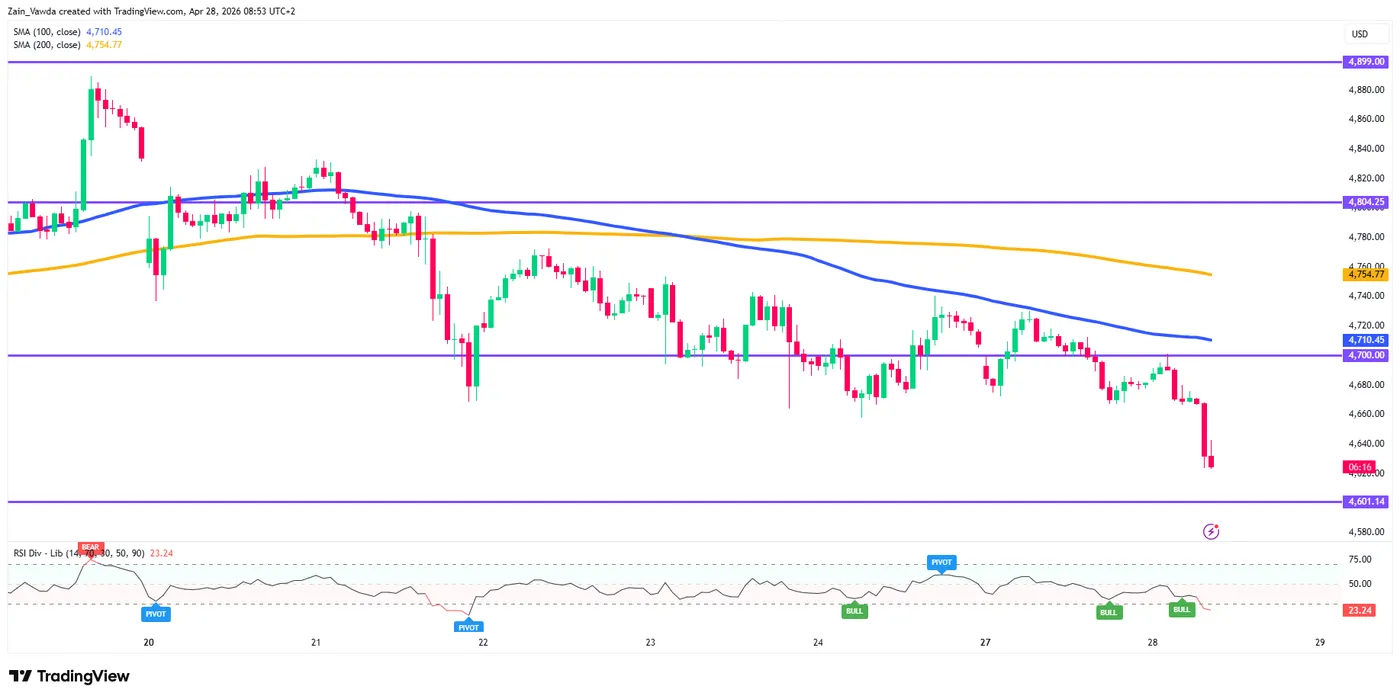
The H4 timeframe paints a clear picture of a market struggling to find its footing. After failing to sustain a break above the $4800 handle, Gold has plummeted through key support levels.
Crucially, the price has slipped below both the 100-MA (Blue) and 200-MA (Orange). The rejection at the $4700 psychological level earlier in the session acted as the catalyst for the current leg lower.
With the RSI currently languishing in oversold territory (near 23), a short-term bounce wouldn't be surprising, but any recovery is likely to meet stiff resistance at the previous breakdown points.
Gold (XAU/USD) Four-Hour Chart, April 28, 2026
Source: TradingView (click to enlarge)
H1 Chart: Lower Highs and Structural Weakness
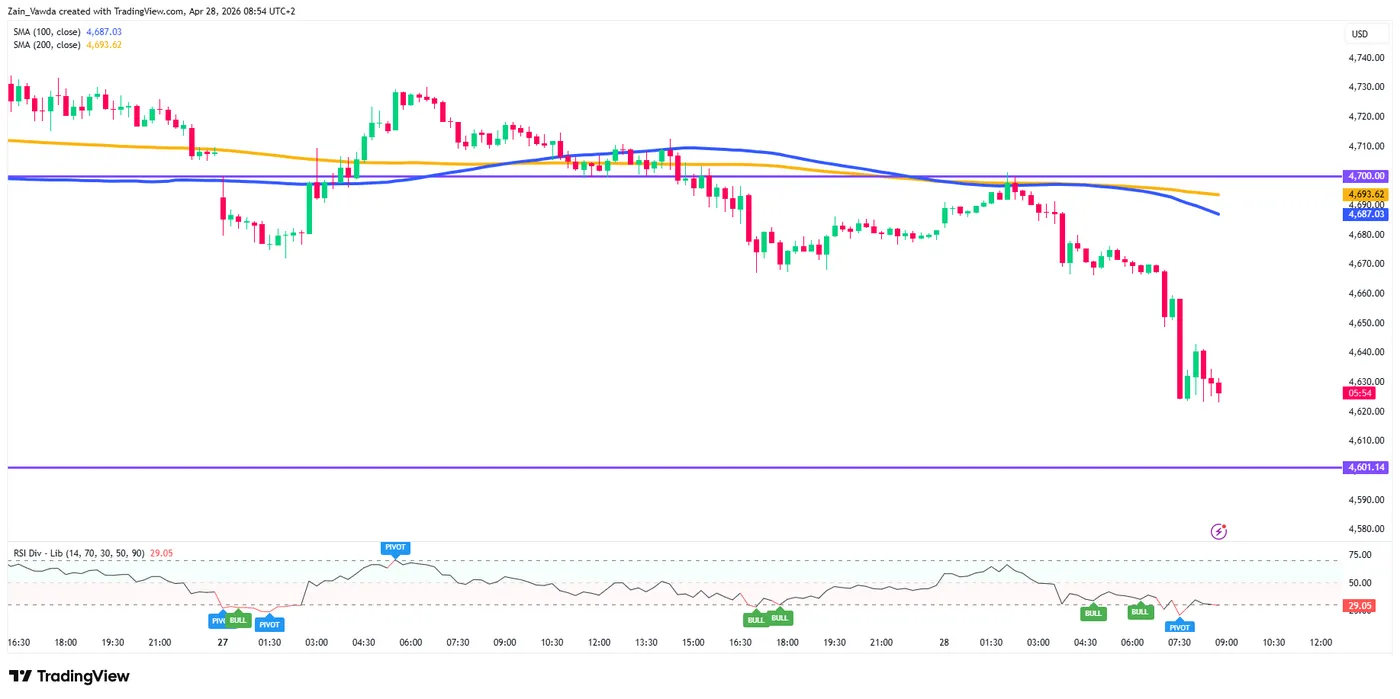
On the H1 chart, the trend is undeniably bearish. We have seen a consistent pattern of lower highs and lower lows. The aggressive sell-off during the most recent candles has pushed Gold toward the $4620 area, slicing through minor support zones with ease.
The gap between the price and the moving averages on this timeframe suggests the move is slightly overextended. However, the lack of a "bullish divergence" on the RSI indicates that the bears are still firmly in control. The $4601 level (highlighted by the purple horizontal line) stands as the primary target for sellers and the next major "line in the sand" for bulls.
Gold (XAU/USD) One-Hour Chart, April 28, 2026
Source: TradingView (click to enlarge)
M15 Tactical Analysis: Scenarios for the Upcoming Sessions
Looking at the intraday price action (M15), we see Gold attempting to stabilize after a vertical drop. Here is how I am framing the upcoming sessions:
The Bearish Scenario
If Gold fails to reclaim the $4640 - $4650 zone during a relief rally, sellers will likely reload. A break below the recent swing low at $4620 would open the trapdoor for a move toward the $4601 support level.
- Target: $4,601.
- Trigger: Rejection of the M15 50-MA or a break of $4,620.
The Bullish Scenario
For a meaningful intraday recovery, the bulls need to orchestrate a "stop-run" back above $4650. This would signal a potential "exhaustion gap" and could lead to a squeeze toward the $4680 area (near the H1 MAs).
- Target: $4,680 - $4,700.
- Confirmation: A 15-minute close above $4,655 with an RSI move back above 50.
Key Levels to Watch:
- Resistance: $4650, $4687, $4700.
- Support: $4620, $4601, $4580.
Gold (XAU/USD) M15 Chart, April 28, 2026
Source: TradingView (click to enlarge)
While the long-term trend for Gold has been constructive, the short-term technicals are screaming caution. The decisive break below $4700 has shifted the momentum, and until we see a structural shift on the H1 (a higher high), I remain wary of catching the falling knife.
Commodity Currencies Test Key Levels Ahead of Major Macro Data
Commodity-linked currencies are trading near key levels, showing restrained price action as market participants adopt a wait-and-see approach. The fundamental backdrop is shaped by expectations surrounding the release of Australia’s inflation data and the Bank of Canada’s interest rate decision, followed by a press conference. These events are viewed as key drivers for the respective currencies and could significantly shift the balance of power in the market.
Additional attention is focused on global factors, including US statistics (data on economic activity and oil inventories), as well as ongoing uncertainty surrounding negotiations between the US and Iran, which continues to influence overall risk sentiment.
AUD/USD
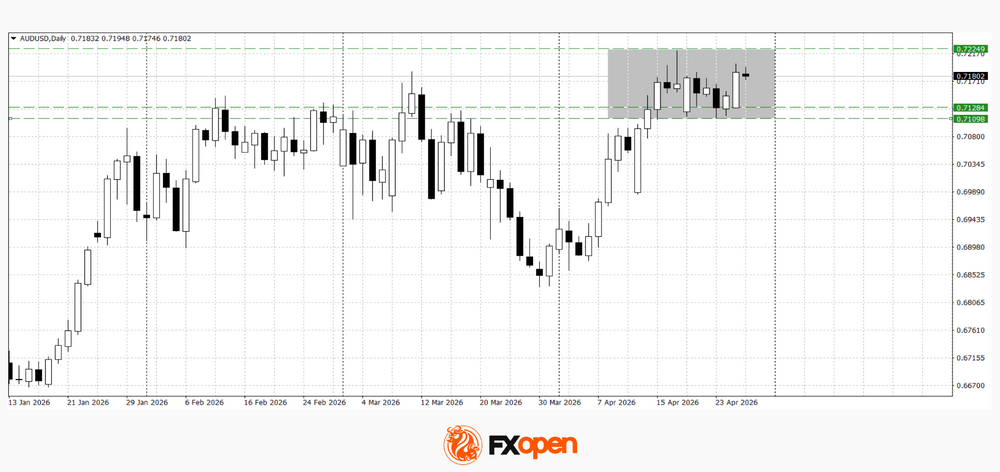
The AUD/USD pair is trading near its yearly high around 0.7220. This level is attracting heightened attention, as the pair has not traded above it for three years, increasing its significance as a supply zone. In the event of strong inflation data, a breakout with further upside is possible, whereas weaker figures could trigger a pullback and a return to the 0.7100–0.7180 range.
Key events for AUD/USD:
- today at 16:00 (GMT+3): S&P/CS Composite-20 Home Price Index (US), not seasonally adjusted
- today at 17:00 (GMT+3): US CB Consumer Confidence Index
- tomorrow at 04:30 (GMT+3): Australia Consumer Price Index
USD/CAD
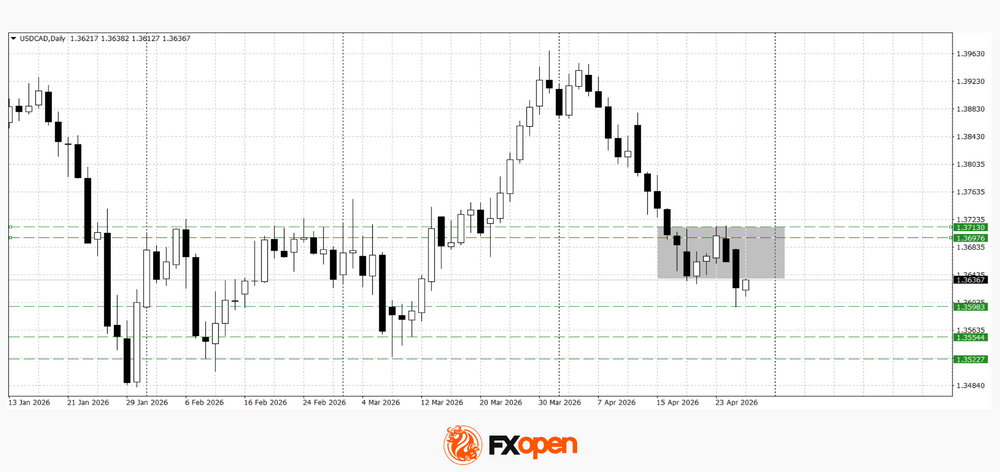
The recovery in USD/CAD observed last week has lost momentum following a failed attempt to consolidate above 1.3700. Yesterday, the April low was updated, but the price found support at 1.3600 and rebounded. Technical analysis of USD/CAD points to the possibility of a decline towards 1.3540–1.3520 if the pair consolidates below 1.3600. The bearish scenario would be invalidated after a confident move and hold above 1.3700.
Key events for USD/CAD:
- tomorrow at 15:30 (GMT+3): US New Home Construction (housing starts)
- tomorrow at 16:45 (GMT+3): Bank of Canada interest rate decision
- tomorrow at 17:30 (GMT+3): Bank of Canada press conference
Overall, the market is in a waiting phase, where key levels in AUD/USD and USD/CAD serve as decision points. Upcoming macroeconomic events — including Australia’s CPI, the Bank of Canada’s decision, and US data — will determine the next direction: either continuation of current trends with breakouts, or a return to more subdued, range-bound dynamics.
Trade over 50 forex markets 24 hours a day with FXOpen. Take advantage of low commissions, deep liquidity, and spreads from 0.0 pips (additional fees may apply). Open your FXOpen account now or learn more about trading forex with FXOpen.
This article represents the opinion of the Companies operating under the FXOpen brand only. It is not to be construed as an offer, solicitation, or recommendation with respect to products and services provided by the Companies operating under the FXOpen brand, nor is it to be considered financial advice.
GBP/JPY Daily Outlook
Daily Pivots: (S1) 215.45; (P) 215.75; (R1) 216.06; More...
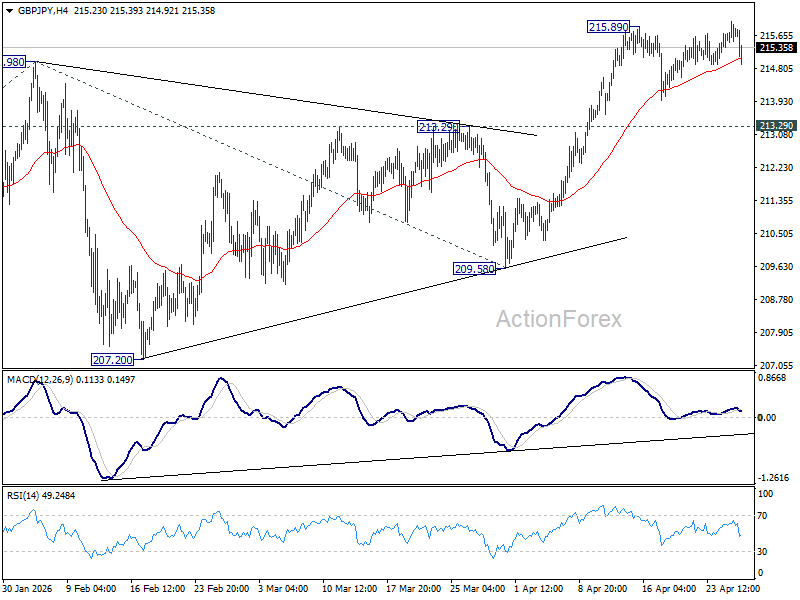
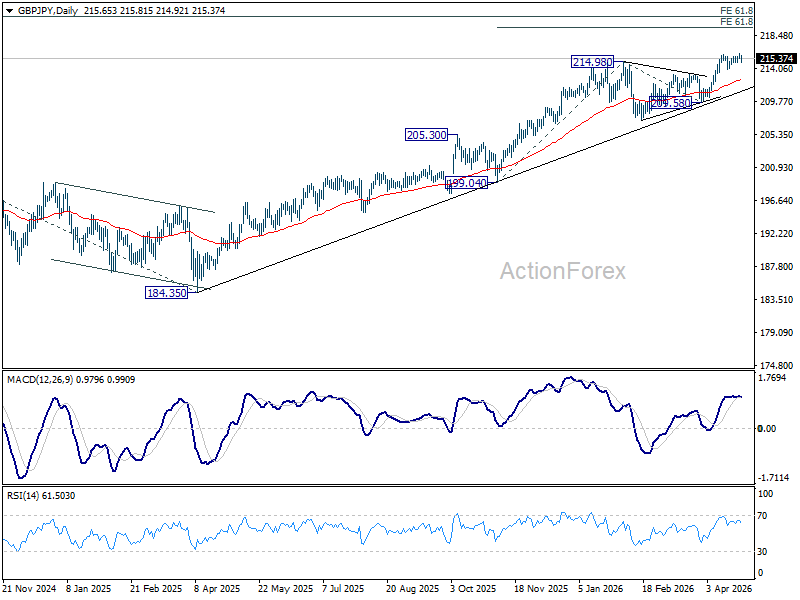
Intraday bias in GBP/JPY remains neutral as consolidation pattern from 215.89 is extending with another dip. Further rise is expected as long as 213.29 resistance turned support holds. On the upside, firm break of 215.89 will resume larger up trend to 61.8% projection of 199.04 to 214.98 from 209.58 at 219.43.
In the bigger picture, up trend from 123.94 (2020 low) is still in progress. Firm break of 214.98 will target 61.8% projection of 148.93 (2022 low) to 208.09 (2024 high) from 184.35 at 220.90. This will remain the favored case as long as 55 W EMA (now at 205.25) holds, even in case of another deep pullback.
EUR/JPY Daily Outlook
Daily Pivots: (S1) 186.60; (P) 186.86; (R1) 187.11; More...
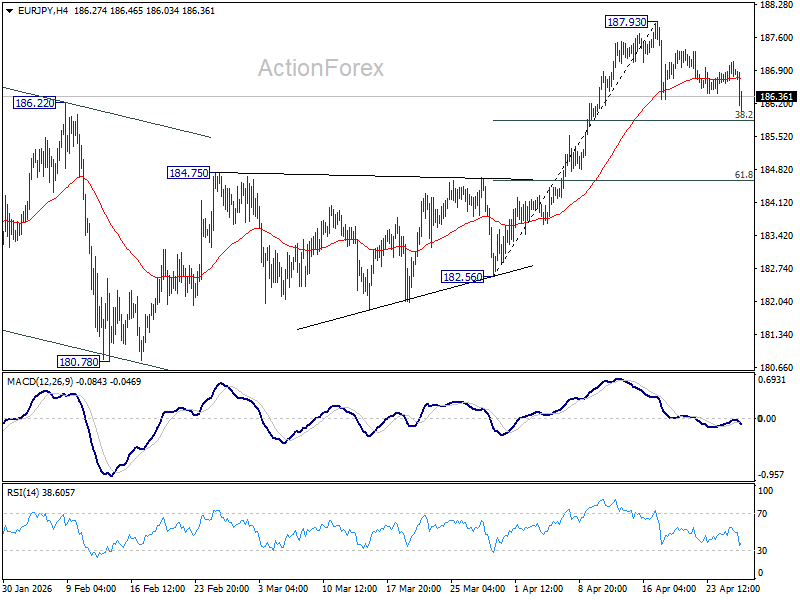
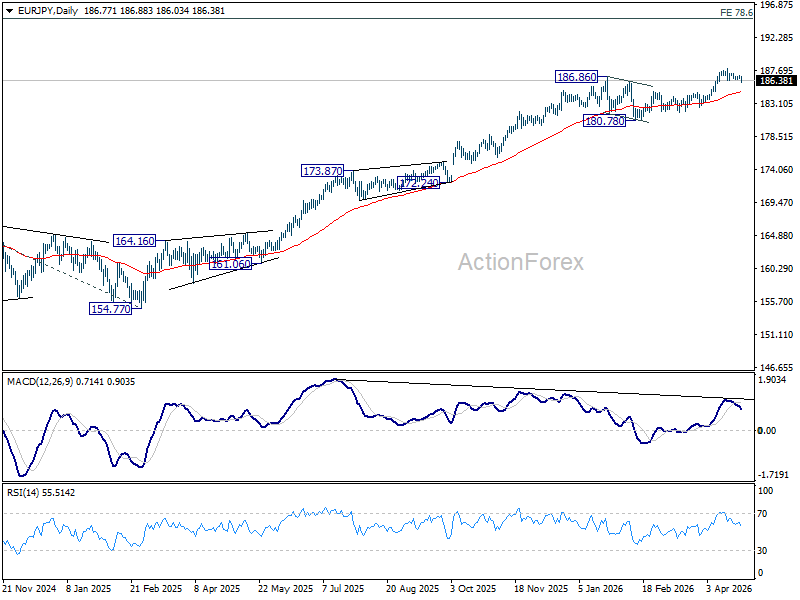
EUR/JPY dips mildly today as consolidation from 187.93 extends. Intraday bias stays neutral at this point. Strong support is expected from 38.2% retracement of 182.56 to 187.93 at 185.87 to bring rebound. On the upside, firm break of 187.93 will resume larger up trend. However, further break of 185.87 will bring deeper fall to 184.75 resistance turned support instead.
In the bigger picture, up trend from 114.42 (2020 low) is in progress. Next target is 78.6% projection of 124.37 (2022 low) to 175.41 (2025 high) from 154.77 at 194.88 next. For now, medium term outlook will stay bullish as long as 180.78 support holds, even in case of deeper pullback.
EUR/GBP Daily Outlook
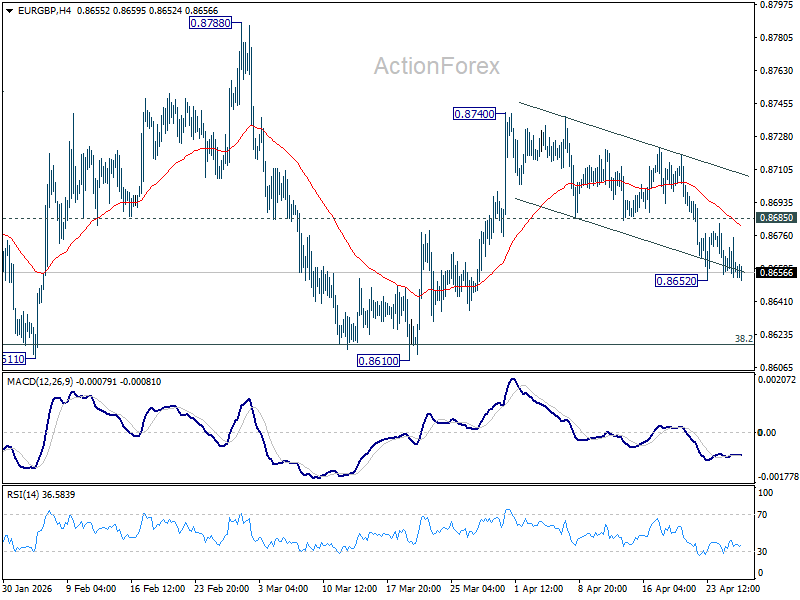
Daily Pivots: (S1) 0.8652; (P) 0.8664; (R1) 0.8673; More…
Intraday bias in EUR/GBP remains neutral at this point, and more consolidations could be seen. Further fall is expected with 0.8685 support turned resistance intact. On the downside, below 0.8652 will resume the fall from 0.8740 to retest 0.8610 support next. Nevertheless, firm break of 0.8685 will dampen the bearish view and turn bias back to the upside for 0.8740 again.
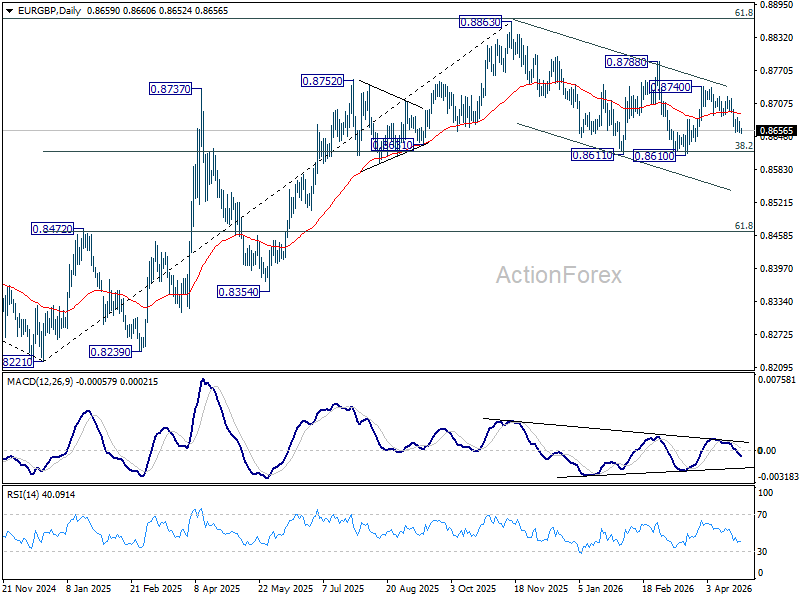
In the bigger picture, strong support was seen again from 38.2% retracement of 0.8821 to 0.8863 at 0.8618. Break of 0.8788 resistance will argue that larger rise from 0.8221 might be ready to resume through 0.8863 (2025 high). Nevertheless, sustained trading below 0.8618 should confirm bearish reversal, and bring deeper fall to 61.8% retracement at 0.8466 at least.
EUR/AUD Daily Outlook
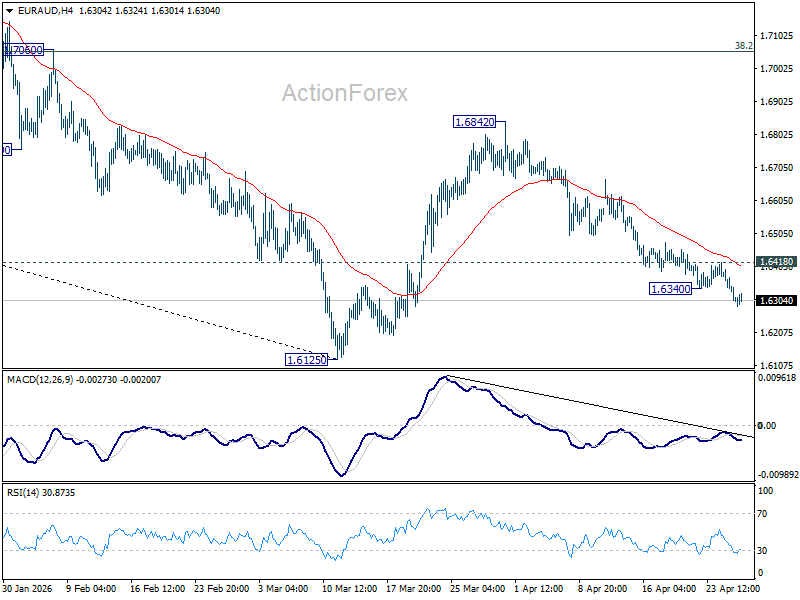
Daily Pivots: (S1) 1.6275; (P) 1.6341; (R1) 1.6380; More...
Intraday bias in EUR/AUD is back on the downside with break of 1.6340 temporary low. Fall from 1.6842 should target a retest on 1.6125 low. Firm break there will resume larger down trend fro 1.8554. On the upside, above 1.6418 minor resistance will turn intraday bias neutral again first.
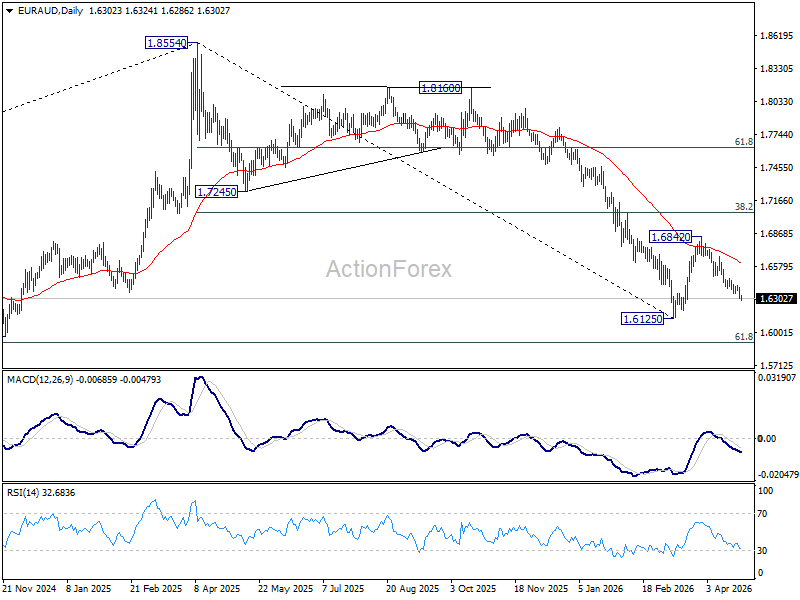
In the bigger picture, fall from 1.8554 (2025 high) is in progress and deeper decline should be seen to 61.8% retracement of 1.4281 to 1.8554 at 1.5913, which is slightly below 1.5963 structural support. Decisive break there will pave the way back to 1.4281 (2022 low). For now, risk will stay on the downside as long as 55 W EMA (now at 1.7129) holds, even in case of strong rebound.
EUR/CHF Daily Outlook
Daily Pivots: (S1) 0.9197; (P) 0.9208; (R1) 0.9219; More....
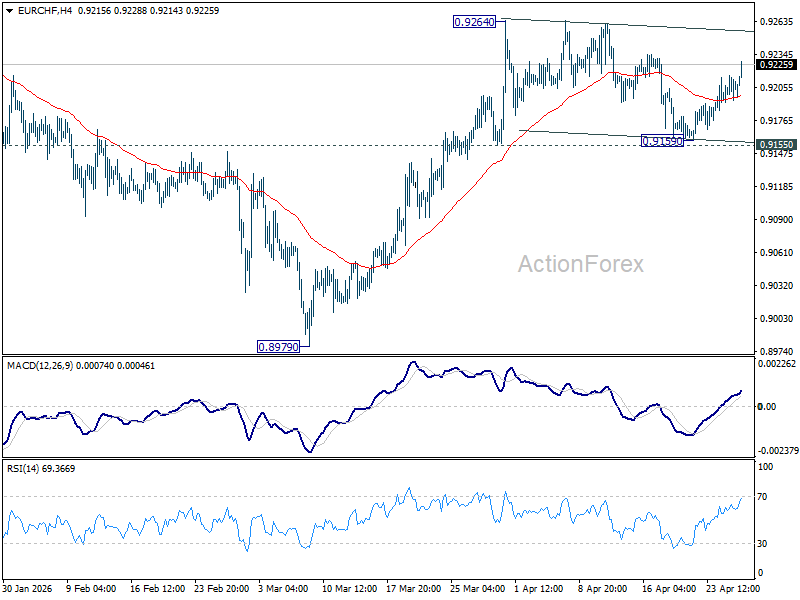
Intraday bias in EUR/CHF stays neutral first and consolidations from 0.9264 could extend. But still, further rise is expected with 0.9155 support intact. On the upside, firm break of 0.9264 will resume the rise from 0.8979 to 0.9394 resistance next. However, break of 0.9155 will turn bias back to the downside for deeper pullback.
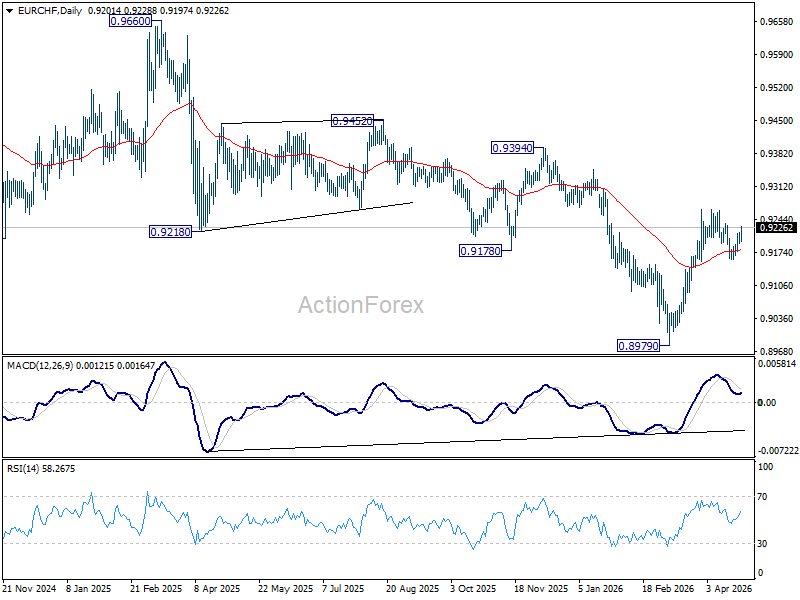
In the bigger picture, considering bullish convergence condition in W MACD, a medium term bottom should be in place at 0.8979. Sustained trading above 55 W EMA (now at 0.9277) will add more credence to this case. Further break of 0.9394 resistance will pave the way to 0.9660 resistance next. However rejection by the 55 W EMA will set up another fall through 0.8979 low at a later stage.
USD/CAD Daily Outlook
Daily Pivots: (S1) 1.3588; (P) 1.3636; (R1) 1.3674; More...
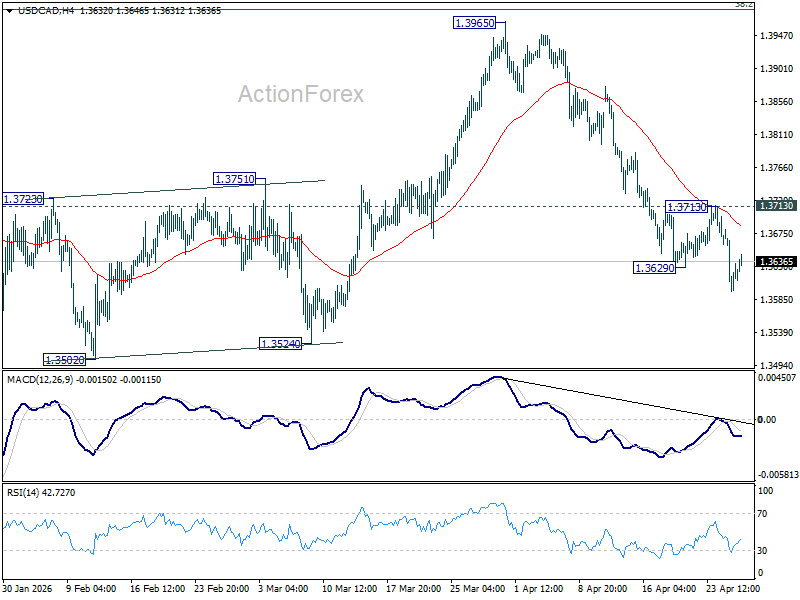
Intraday bias in USD/CAD remains on the downside for the moment. Fall from 1.3965 should target a retest of 1.3480 low. Firm break there will resume larger down trend. For now, risk will stay on the downside as long as 1.3713 resistance holds, in case of recovery
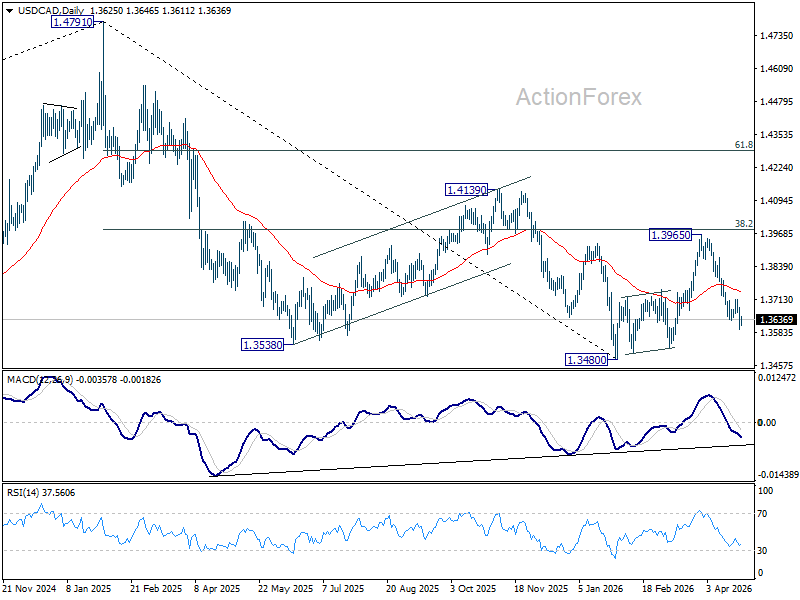
In the bigger picture, price actions from 1.4791 are seen as a corrective pattern to the whole up trend from 1.2005 (2021 low). Deeper fall could be seen, as the pattern extends, to 61.8% retracement of 1.2005 to 1.4791 at 1.3069. However, decisive break of 38.2% retracement of 1.4791 to 1.3480 at 1.3981 will argue that the correction has completed with three waves down to 1.3480 already. Further break of 1.4139 will confirm and bring retest of 1.4791 high.
AUD/USD Daily Report
Daily Pivots: (S1) 0.7145; (P) 0.7172; (R1) 0.7214; More...
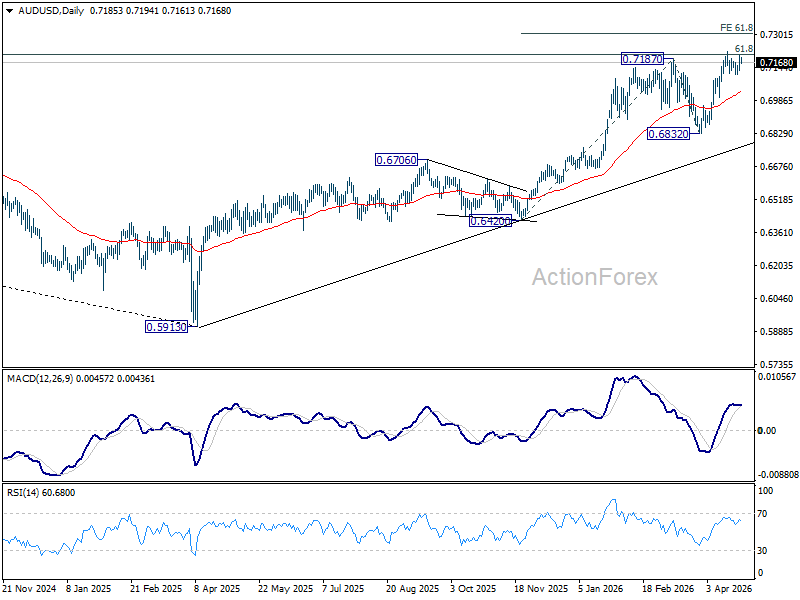
AUD/USD is extending consolidations below 0.7221 and intraday bias remains neutral. On the upside, firm break of 0.7221 will extend larger up trend to 61.8% projection of 0.6420 to 0.7187 from 0.6832 at 0.7306. On the downside, break of 0.7076 minor support will turn bias back to the downside for deeper pullback.
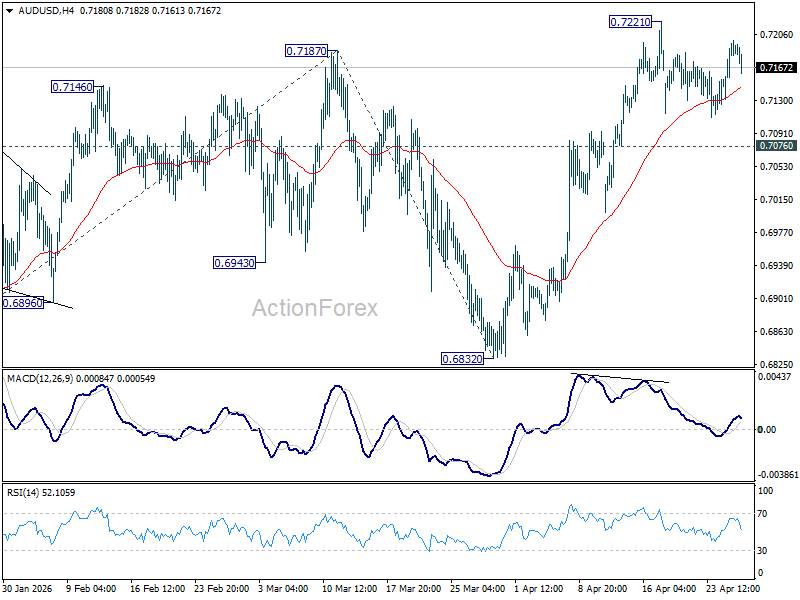
In the bigger picture, rise from 0.5913 (2024 low) is still in progress. Decisive break of 61.8% retracement of 0.8006 to 0.5913 at 0.7206 will solidify the case that it's already reversing the down trend from 0.8006 (2021 high). Further rally should then be seen to retest 0.8006. For now, outlook will remain bullish as long as 0.6832 support holds, in case of pullback.