Sample Category Title
GBPAUD Wave Analysis
GBPAUD: ⬆️ Buy
- GBPAUD reversed from support area
- Likely to rise to resistance level 1.9270
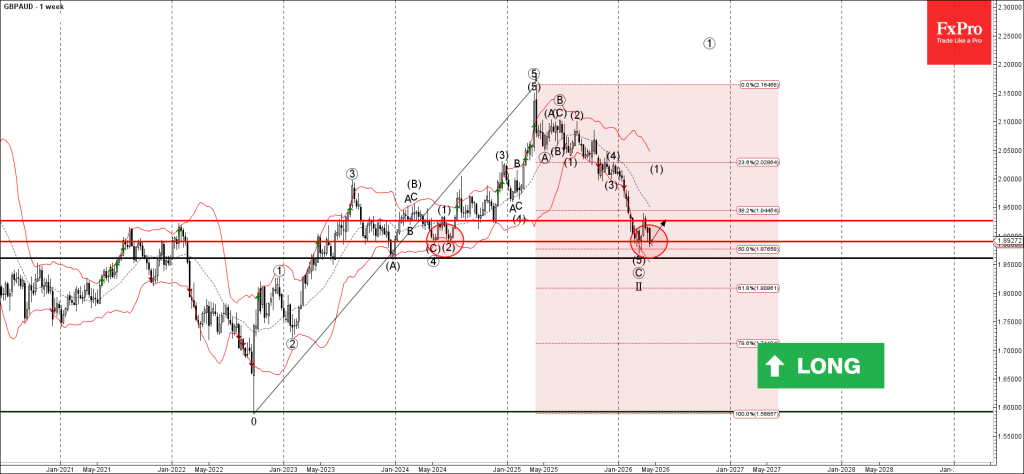
GBPAUD currency pair recently reversed up from the support area between the support level 1.890, lower weekly Bollinger Band and the 50% Fibonacci correction of the sharp upward impulse from May.
The upward reversal from this from the support area continues the active intermediate impulse wave (1).
Given the clear weekly uptrend, GBPAUD currency pair can be expected to rise to the next resistance level 1.9270 (which reversed the price earlier this year).
EURJPY Wave Analysis
EURJPY: ⬆️ Buy
- EURJPY reversed from support area
- Likely to rise to resistance level 1.9270
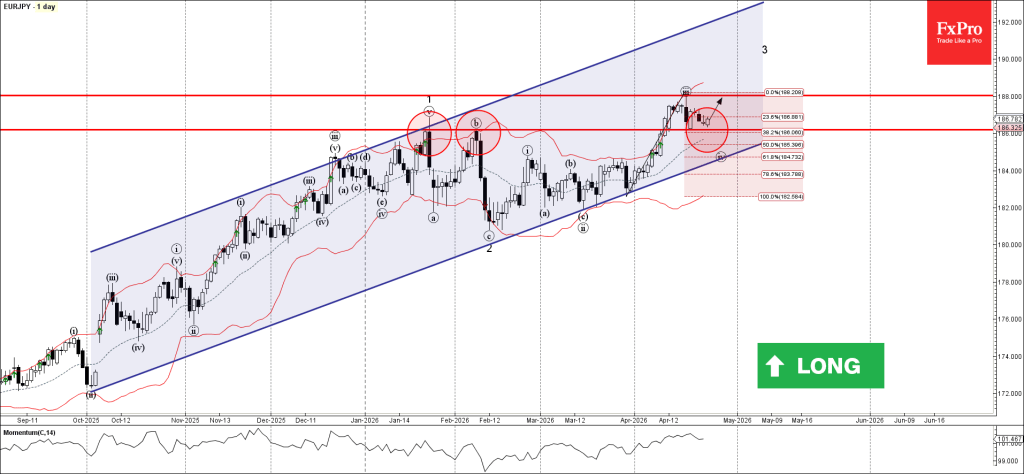
EURJPY currency pair recently reversed up from the support area between the key support level 186.00 (former monthly high from February) and the 38.2% Fibonacci correction of the upward impulse from March.
The upward reversal from this from the support area continues the active short-term impulse wave 3 of the extended impulse wave (3) from last year.
Given the strong daily uptrend and the bullish euro sentiment seen today, EURJPY currency pair can be expected to rise to the next resistance level 188.00 (top of the previous impulse wave iii).
Eco Data 4/27/26
| GMT | Ccy | Events | Act | Cons | Prev | Rev |
|---|---|---|---|---|---|---|
| 06:00 | EUR | Germany GfK Consumer Confidence May | -33.3 | -30.2 | -28 | -28.1 |
| 06:00 | EUR |
| Germany GfK Consumer Confidence May | |
| Actual | -33.3 |
| Consensus | -30.2 |
| Previous | -28 |
| Revised | -28.1 |
Dual Pressure on Dollar: Fading US–Iran Risks and the Warsh Fed Factor
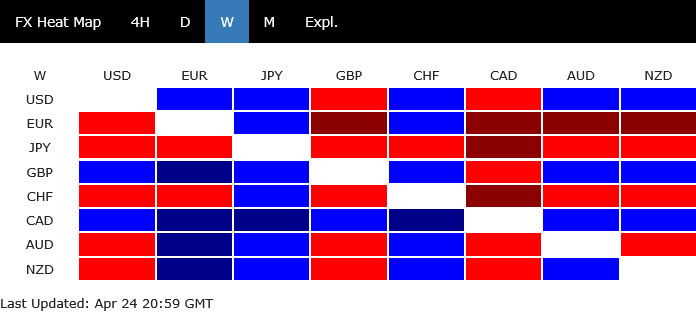
Dollar’s inability to hold onto last week’s gains is emerging as a key signal that the broader trend may be turning lower again. While the greenback initially found some support on headlines of stalled US–Iran talks, the move quickly lost momentum as markets shifted focus to ceasefire extensions and renewed diplomatic efforts. The reaction suggests that geopolitical developments are no longer delivering sustained support to the Dollar, with traders increasingly fading risk-off spikes rather than chasing them.
At the same time, a second and potentially more durable driver is coming into play: the evolving outlook for US monetary policy. The path toward a leadership transition at the Federal Reserve, combined with growing expectations of a more flexible and potentially dovish policy stance, is weighing on yields and undermining Dollar strength. Together, fading war premium and a shifting Fed narrative are creating a dual headwind for the greenback, opening the door for further downside ahead.
Geopolitical Premium Fades as Markets Look Through Conflict
The market reaction to geopolitical developments last week highlights a clear shift in behavior. Dollar did attempt to strengthen when US–Iran talks were abruptly canceled just ahead of the ceasefire deadline, but the move lacked conviction. The rally was shallow and short-lived, suggesting that traders were no longer willing to aggressively price in escalation risk.
That hesitation became more evident as events unfolded. The announcement of an indefinite US–Iran ceasefire, and then the Israel–Lebanon truce, quickly erased what little upside momentum Dollar had built. Rather than reinforcing safe-haven demand, these developments triggered a reversal.
The final confirmation came with reports of a second round of US–Iran talks in Islamabad. Dollar weakened further on the news, reinforcing the idea that markets are now fading geopolitical risk rather than chasing it. This pattern suggests that the impact of the Iran war on currencies is diminishing, with traders looking through the noise toward more durable macro themes.
Conflict Containment and Oil Signal
A key reason behind this shift is the perception that conflicts are being contained rather than allowed to escalate into a broader regional war. The Israel–Lebanon ceasefire, in particular, signals that the US and its allies are successfully “siloing” tensions, preventing spillover across multiple fronts. This containment reduces the probability of a systemic shock that would justify sustained Dollar strength.
Oil prices provide a clear real-time gauge of this dynamic. While Brent remains elevated, the inability to break decisively above the $110 level suggests that markets are not pricing a full-scale disruption scenario. Instead, current levels reflect ongoing tension without escalation—an important distinction for broader asset pricing.
As long as oil remains below that key threshold, the inflation shock is seen as manageable and the risk environment remains supportive. In this context, any temporary spikes in oil—and the associated risk-off flows—are increasingly viewed as opportunities to fade rather than signals of a lasting regime shift.
Equity Markets Reclaim Narrative
At the same time, equity markets are sending an even stronger signal. Major indices including the S&P 500, NASDAQ, Nikkei, and KOSPI have pushed to new record highs, underscoring a decisive return to risk appetite. Investors are no longer positioning around geopolitical headlines; instead, they are reallocating capital toward structural growth themes.
The dominant narrative is once again the AI trade. Strong earnings momentum, continued investment in infrastructure, and long-term productivity expectations are drawing focus away from short-term geopolitical risks. This shift in attention is critical, as it removes a key pillar of support for the Dollar.
Importantly, this is not just a US phenomenon. The global nature of the rally—from Asia to the US—indicates that investors broadly share the view that the current geopolitical environment, while volatile, does not fundamentally derail growth trajectories tied to technology and innovation.
Political Layer – Trump Strategy
The political backdrop further reinforces this interpretation. President Donald Trump’s decision to implement an indefinite ceasefire suggests a deliberate strategy to avoid full-scale military escalation. Despite earlier rhetoric about striking Iranian infrastructure, the administration appears to be prioritizing negotiation over confrontation.
At the same time, the continued US blockade of Iranian ports and Iran’s seizure of tankers should not be viewed purely as escalation. These actions are better understood as tactical positioning ahead of negotiations—hardline gestures designed to strengthen bargaining leverage rather than signals of imminent conflict expansion.
Another important element is the absence of Vice President JD Vance from the second round of talks. His earlier involvement in negotiations—and past high-profile diplomatic confrontations—raised concerns about potential disruptions. Keeping him out of the process suggests a more controlled and pragmatic approach by the administration.
This creates a dual-track strategy. By maintaining a “hawkish anchor” domestically while pursuing diplomacy abroad, the White House preserves flexibility. It can pivot toward escalation if talks fail, but for now, the bias is clearly toward de-escalation and deal-making.
Re-escalation Unlikely, AI Trade Dominates
Taken together, these developments point to a declining probability of near-term re-escalation. Markets are increasingly interpreting both military actions and diplomatic moves as part of a managed process rather than a path toward broader conflict. This perception is critical in shaping asset allocation decisions.
As a result, the underlying risk-on tone is likely to persist. Investors who have already begun rotating back into equities—particularly AI-linked sectors—are unlikely to reverse course unless oil breaks decisively higher or geopolitical dynamics deteriorate sharply.
In this environment, the AI trade is set to remain the dominant market driver. With geopolitical risks fading into the background and policy uncertainty easing, capital is flowing back into long-duration growth assets. This shift not only supports equities but also reinforces downside pressure on the Dollar, as safe-haven demand continues to erode.
Fed Transition and Warsh Outlook Add Downside Pressure on Dollar
A second major force weighing on Dollar is the evolving outlook for Federal Reserve leadership, with the “Warsh factor” rapidly gaining traction in markets. Developments late last week point to a clearer path for Kevin Warsh to succeed Jerome Powell, removing a key layer of uncertainty that had been overhanging policy expectations.
The turning point came with the Department of Justice’s decision on April 24 to drop its investigation into Powell related to the Fed’s headquarters renovation. The probe had become a political flashpoint, effectively blocking Warsh’s nomination from advancing. Its closure clears a critical hurdle, opening the way for a smoother transition ahead of Powell’s term expiry on May 15.
Political Path Opens for Warsh Nomination
This shift has immediate political implications. Senator Thom Tillis, a key member of the Senate Banking Committee, had previously pledged to block any nominee while the investigation remained open. With that obstacle now removed, markets expect Tillis to lift his hold, allowing Warsh’s nomination to proceed to a full Senate vote.
For markets, however, the more important question is not procedural but directional: what kind of Fed Chair Warsh is likely to be. Early signals suggest that investors are interpreting him as more dovish than Powell, or at least more open to policy flexibility.
Policy Signals Point to Softer Inflation Focus
During his confirmation hearing on April 21, Warsh emphasized alternative inflation measures such as Trimmed Mean and Median inflation. These metrics currently paint a softer picture than the standard Core PCE framework used by Powell, leading markets to infer that Warsh may place less weight on persistent inflation pressures.
This distinction matters. By focusing on these “cleaner” measures of inflation, Warsh effectively lowers the perceived urgency for maintaining restrictive policy. It gives markets a rationale to bring forward expectations for rate cuts, particularly if incoming data continues to soften.
“Less Is More” Communication Shift
Warsh also signaled a shift in communication strategy. He criticized the Fed’s current forward guidance approach, arguing that policymakers “talk too much” about future rate paths. Markets interpret this “less is more” doctrine as a willingness to step back from aggressive signaling, potentially allowing policy to ease more quickly without pre-commitment.
The combination of reduced uncertainty, a clearer leadership transition, and a perceived dovish tilt is reinforcing expectations for a more aggressive easing cycle, potentially starting this summer. Together with fading geopolitical support, the Warsh factor is becoming a pillar of the “Dollar fade” narrative, adding a structural layer to the downside risks already emerging in recent price action.
Market Implications: Dual Headwinds Set Stage for Sustained Dollar Weakness
The combined effect of fading geopolitical risk and a shifting Fed outlook is tilting the balance against Dollar. With the war premium eroding and policy expectations turning more accommodative, two of the greenback’s key pillars are weakening simultaneously. This creates a backdrop where rallies are likely to be sold into rather than extended.
At the same time, the broader risk environment is turning more supportive. Equity markets continue to lean into the AI-driven growth narrative, and as long as oil prices remain contained below key escalation levels, inflation concerns are unlikely to trigger a sustained risk-off shift. This reinforces the idea that markets are transitioning back to a growth-focused regime rather than one dominated by geopolitical fear.
In this environment, the path of least resistance for Dollar appears to be lower. While near-term volatility around geopolitical headlines and central bank expectations is likely to persist, the underlying trend favors continued downside. Unless there is a decisive re-escalation that pushes oil sharply higher above $110, the current mix of improving risk sentiment and dovish policy expectations should keep pressure on the greenback.
NASDAQ and S&P Hit New Highs as Dollar Fails at 55 D EMA
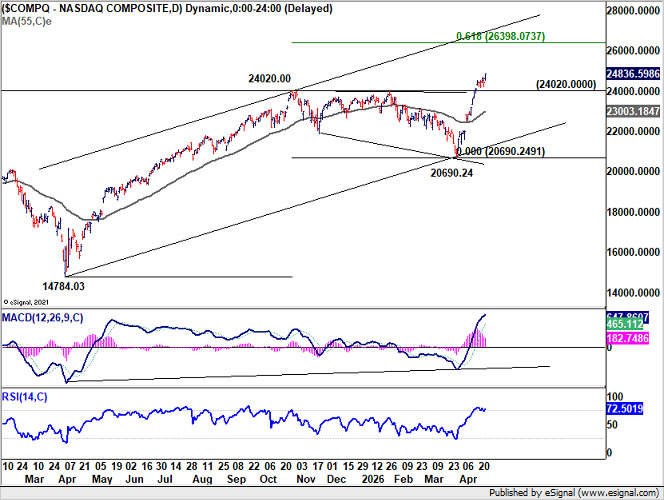
After some initial hesitation, the uptrend in NASDAQ extended decisively last week, with a strong rally pushing the index to a fresh record close at 24,836.59. Further upside is expected as long as 24,020.00—now turned support—holds. The next target lies at 61.8% projection of 14,784.03 to 24,020.00 from 20,690.24 at 26,398.07. However, strong resistance could emerge ahead of the medium-term channel ceiling near the 27,000 level, potentially capping gains.
On the downside, a break below 24,020.00 would signal near-term consolidation, but any pullback should be contained above 55 D EMA (now at 23,003.18) to keep the broader bullish structure intact and set the stage for another leg higher.
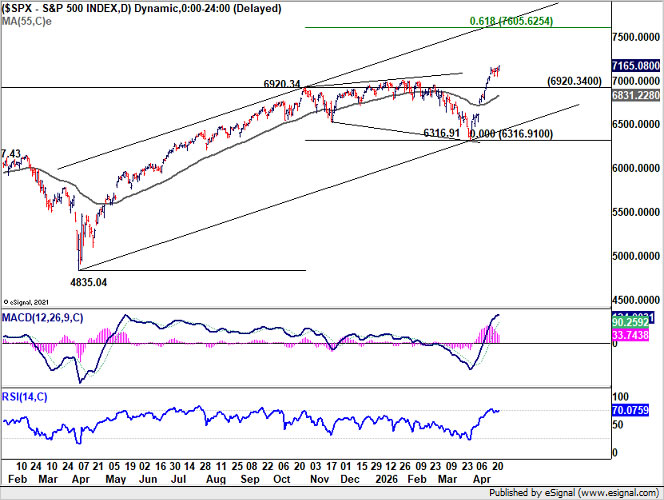
Similarly, the uptrend in S&P 500 extended further, with a new record close at 7,165.08. Further rise is expected as long as 6,920.34—also turned support—holds. The next upside target is 61.8% projection of 4,835.04 to 6,920.34 from 6,316.91 at 7,605.62.
On the downside, a break below 6,920.34 would trigger consolidation, but downside is expected to be contained above 55 D EMA (now at 6831.22), preserving the bullish bias.
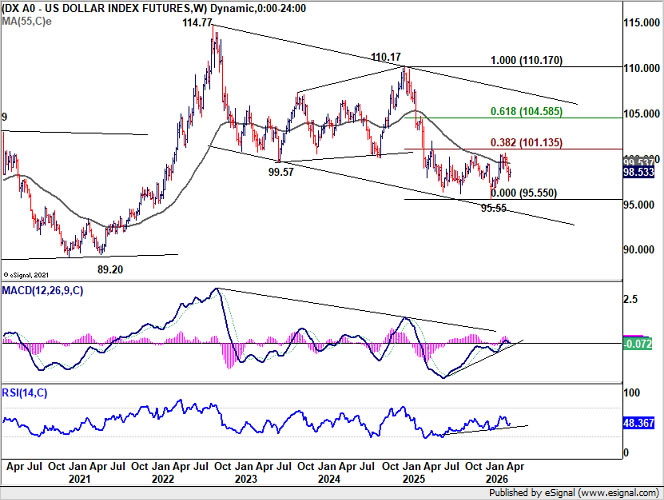
Dollar Index showed signs of exhaustion. The recovery from 97.63 extended higher but stalled at 55 Day EMA (now at 98.97). The outlook remains unchanged, with decline from 100.64 seen as reversal of the prior rebound from 95.55. Further downside is expected as long as 99.18 resistance caps. A break below 97.63 would open the way for a retest of the 95.55 low. That said, a firm break above 99.18 would neutralize the immediate bearish outlook and shift focus back toward the 100.64 resistance.
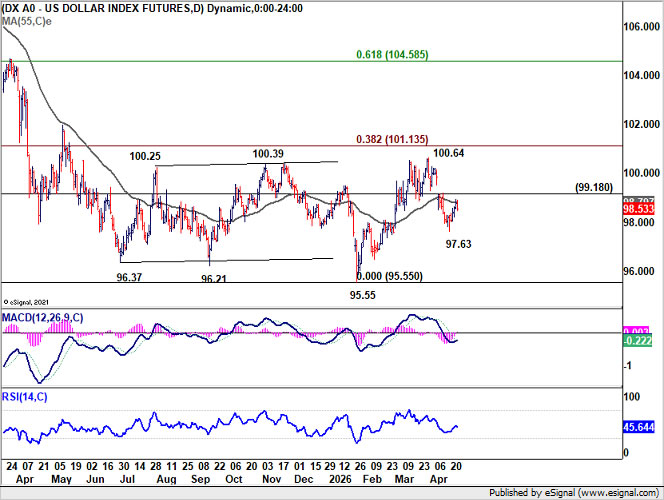
Still, the broader trend remains bearish. With the 38.2% retracement of 110.17 to 95.55 at 101.13 intact, recent price action is viewed as a consolidation phase within a larger downtrend. The prior rejection at 55 Week EMA reinforces this view, suggesting that the broader declines from 110.17 and 114.77 are likely to resume over time.
GBP/USD Weekly Outlook
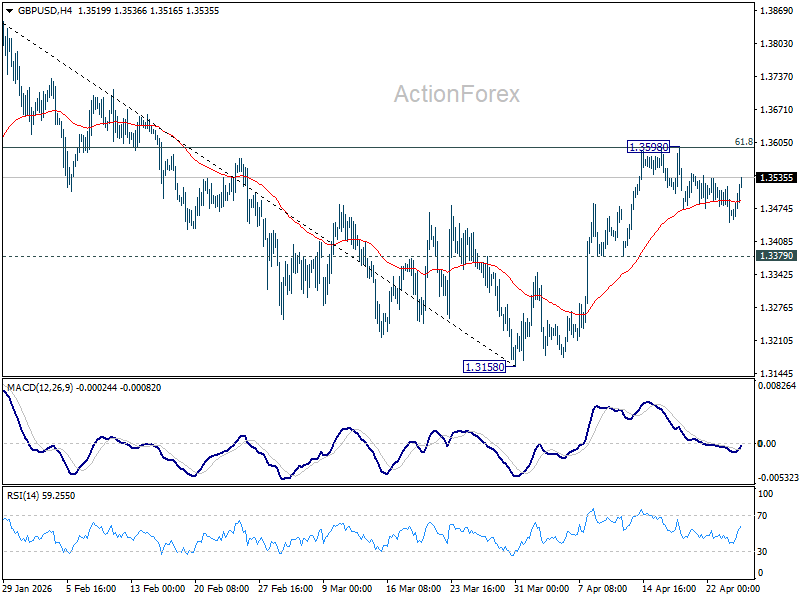
GBP/USD turned into consolidations last week and outlook is unchanged. Initial bias remains neutral this week first. On the upside, firm break of 61.8% retracement of 1.3867 to 1.3158 at 1.3596 will pave the way to retest 1.3867 high. However, break of 1.3379 will bring deeper fall back to 1.3158 low instead.
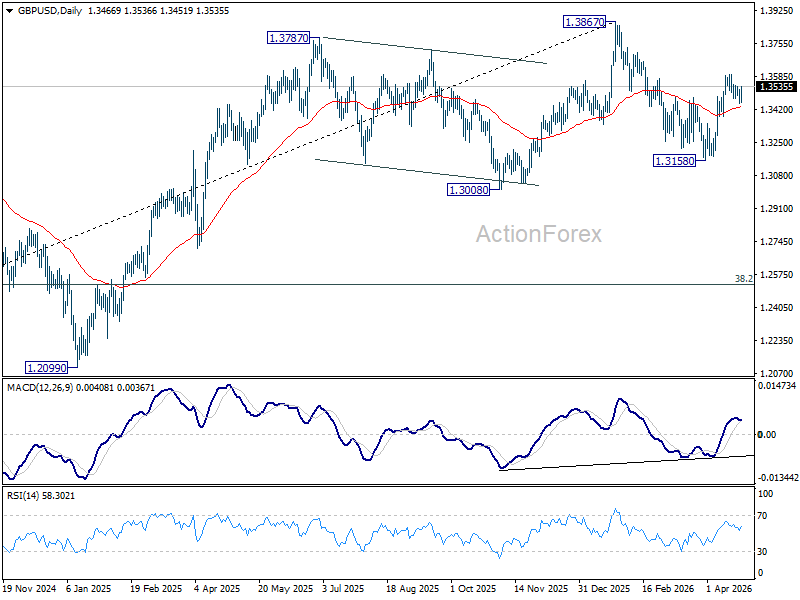
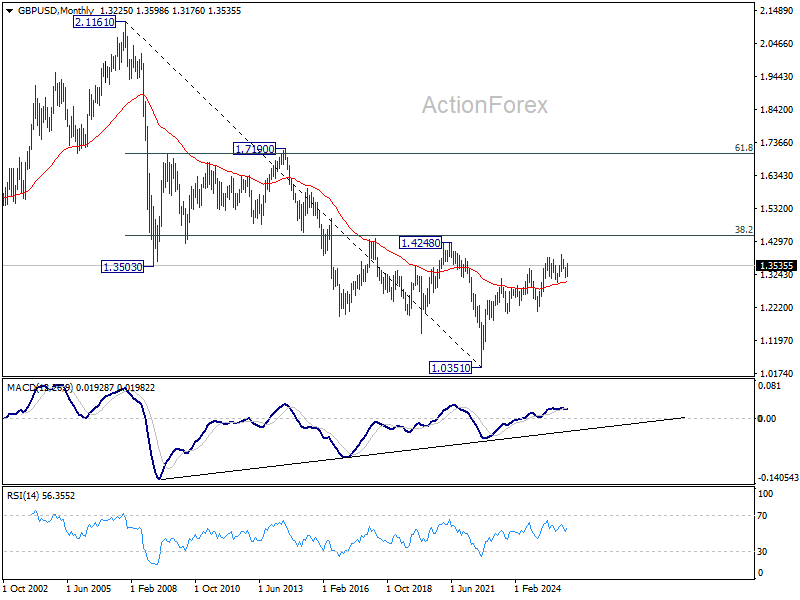
In the bigger picture, current development suggests that price actions from 1.3867 are merely a corrective pattern within the broader up trend from 1.0351 (2022 low). With 1.3008 support intact, medium term bullishness is maintained and break of 1.3867 is back in favor for a later stage, towards 1.4248 key resistance (2021 high).
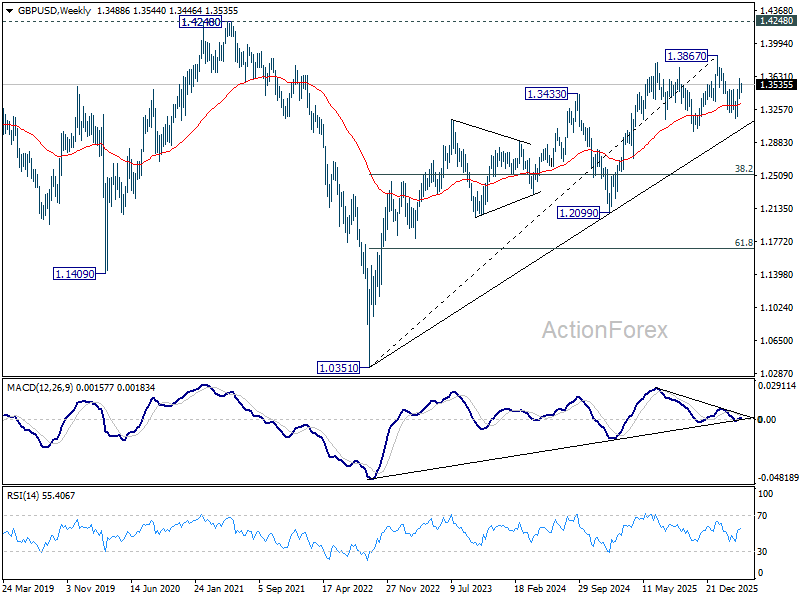
In the long term picture, as long as 1.4248/4480 resistance zone holds (38.2% retracement of 2.1161 to 1.0351 at 1.4480), the long term outlook will remain bearish. That is, price actions from 1.0351 are seen as a corrective pattern to down trend from 2.1161 (2007 high) only. Nevertheless, decisive break of 1.4248/4480 will be a strong sign of long term bullish reversal.
EUR/USD Weekly Outlook
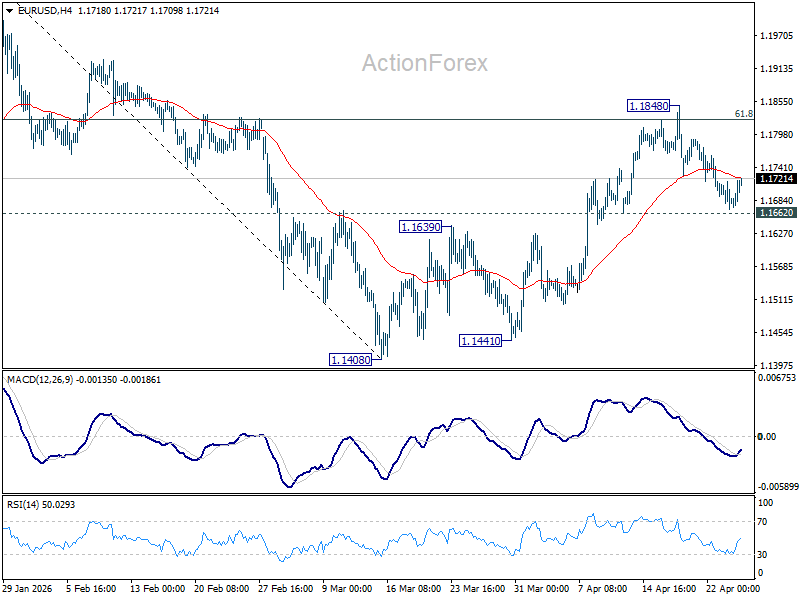
EUR/USD's gyrated lower last week but recovered ahead of 1.1662 support. Initial bias remains neutral this week first, and further rise is in favor. On the upside, sustained trading above 61.8% retracement of 1.2081 to 1.1408 at 1.1824 will pave the way to retest 1.2081 high. However, firm break of 1.1662 support will indicate the the rebound fro 1.1408 has completed, and bring deeper decline back towards this low instead.
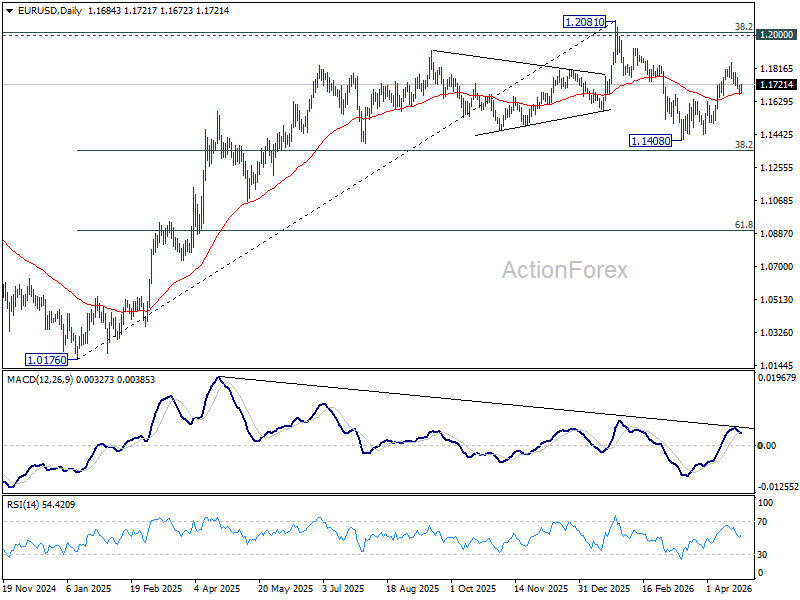
In the bigger picture, the strong support from 38.2% retracement of 1.0176 to 1.2081 at 1.1353 suggests that the pullback from 1.2081 is more likely a corrective move. Strong support was also found in 55 W EMA (now at 1.1523). Focus is back on 1.2 key cluster resistance level. Decisive break there will carry long term bullish implications. Nevertheless, break of 1.1408 support will revive the case of medium term bearish trend reversal.
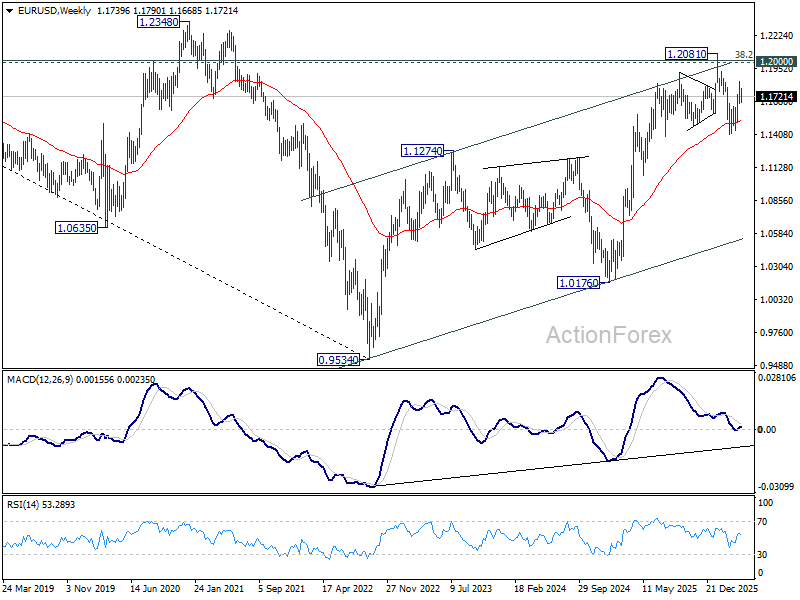
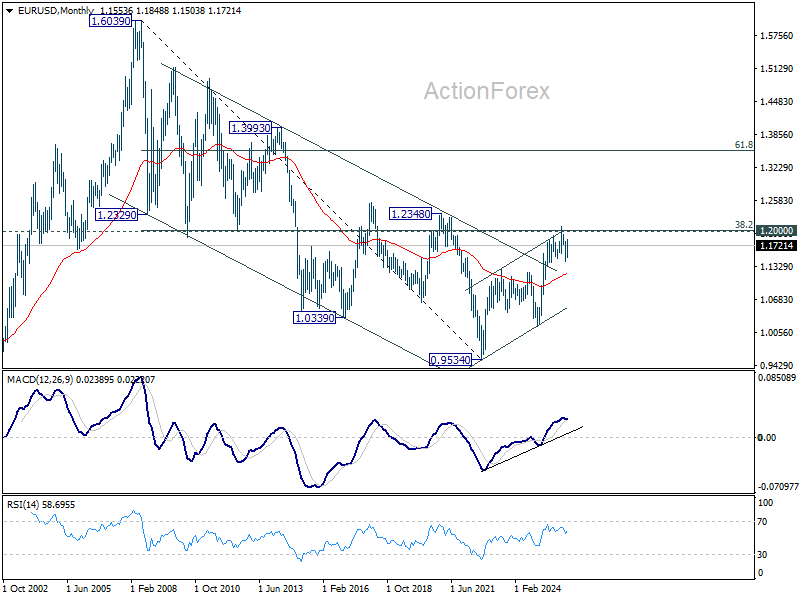
In the long term picture, 38.2% retracement of 1.6039 to 0.9534 at 1.2019, which is close to 1.2000 psychological level is the key for the outlook. Rejection by this level will keep the multi decade down trend from 1.6039 (2008 high) intact, and keep outlook neutral at best. However, decisive break of 1.2000/19, will suggest long term bullish trend reversal, and target 61.8% retracement at 1.3554.
USD/JPY Weekly Outlook
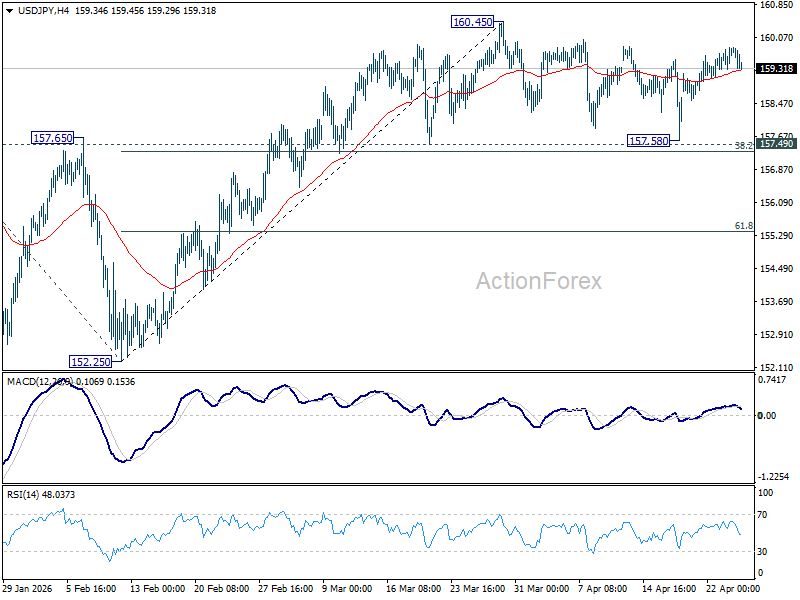
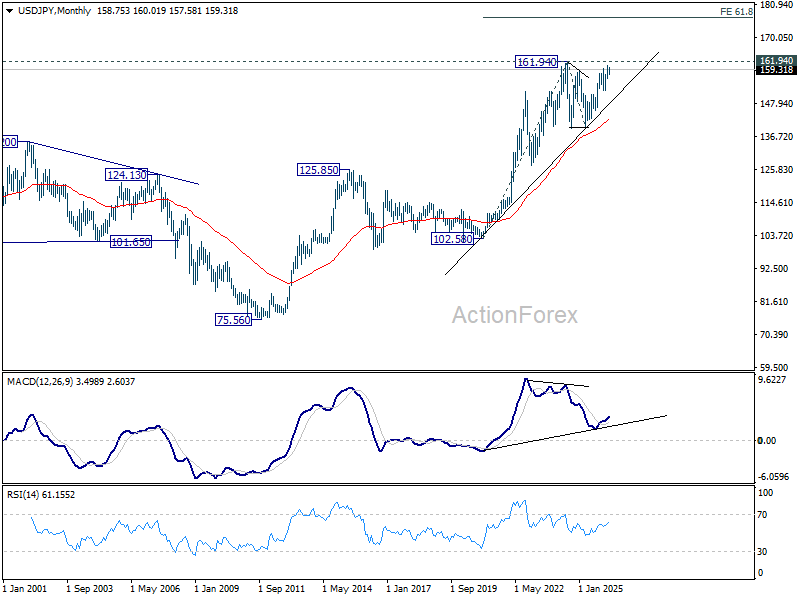
USD/JPY extended consolidations below 160.45 last week and outlook is unchanged. Initial bias remains neutral this week. Further rise is expected with 157.49 cluster support (38.2% retracement of 152.25 to 160.45 at 157.31) intact. On the upside break of 160.45 will target a retest on 161.94 high. However, firm break of 157.31/49 will bring deeper fall back to 61.8% retracement at 155.38 next.
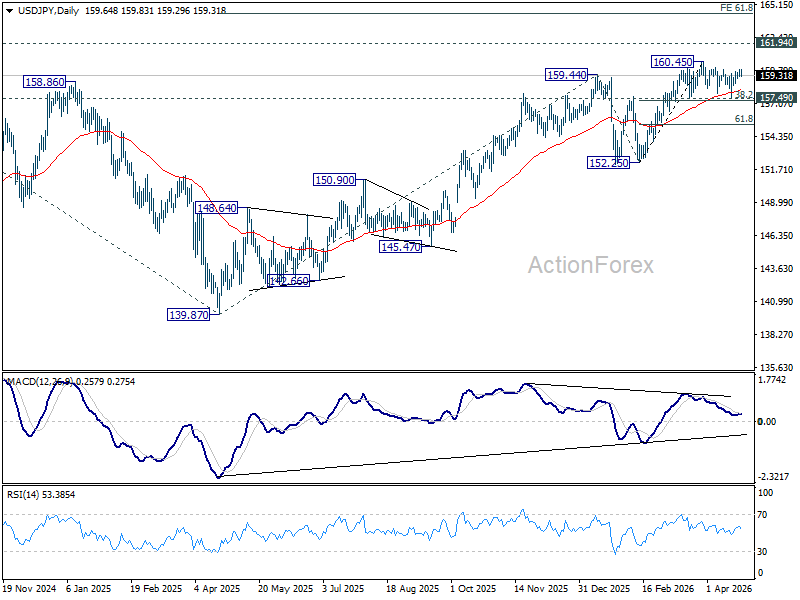
In the bigger picture, outlook is unchanged that corrective pattern from 161.94 (2024 high) should have completed with three waves at 139.87. Larger up trend from 102.58 (2021 low) could be ready to resume through 161.94. This will remain the favored case as long as 55 W EMA (now at 153.61) holds. Firm break of 161.94 will pave the way to 61.8% projection of 102.58 to 161.94 from 139.87 at 176.75.
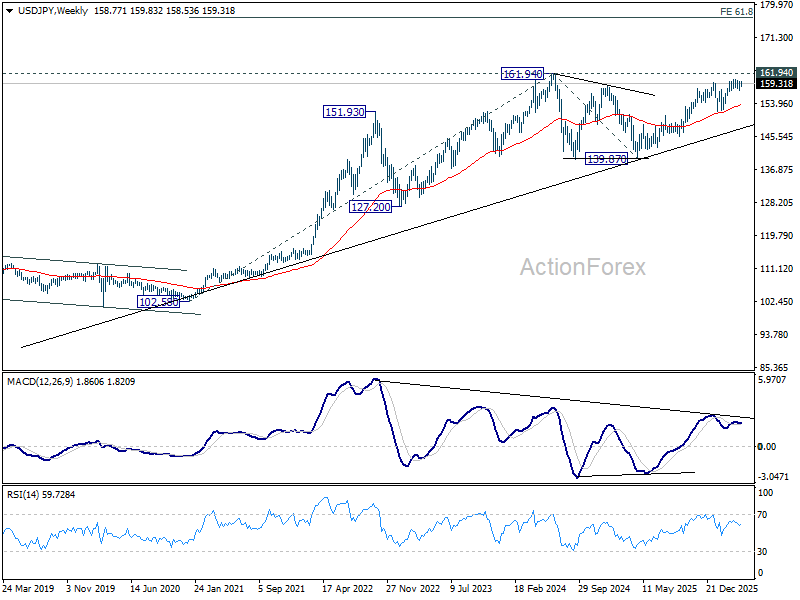
In the long term picture, up trend from 75.56 (2011 low) is still in progress and might be ready to resume. Firm break of 161.94 will target 61.8% projection of 102.58 (2020 low) to 161.94 (2024 high) from 139.87 at 176.55 in the medium term. Long term outlook will stay bullish as long as 139.87 support holds, even in case of deep pullback.
GBP/USD Weekly Outlook
GBP/USD turned into consolidations last week and outlook is unchanged. Initial bias remains neutral this week first. On the upside, firm break of 61.8% retracement of 1.3867 to 1.3158 at 1.3596 will pave the way to retest 1.3867 high. However, break of 1.3379 will bring deeper fall back to 1.3158 low instead.
In the bigger picture, current development suggests that price actions from 1.3867 are merely a corrective pattern within the broader up trend from 1.0351 (2022 low). With 1.3008 support intact, medium term bullishness is maintained and break of 1.3867 is back in favor for a later stage, towards 1.4248 key resistance (2021 high).
In the long term picture, as long as 1.4248/4480 resistance zone holds (38.2% retracement of 2.1161 to 1.0351 at 1.4480), the long term outlook will remain bearish. That is, price actions from 1.0351 are seen as a corrective pattern to down trend from 2.1161 (2007 high) only. Nevertheless, decisive break of 1.4248/4480 will be a strong sign of long term bullish reversal.
USD/CHF Weekly Outlook
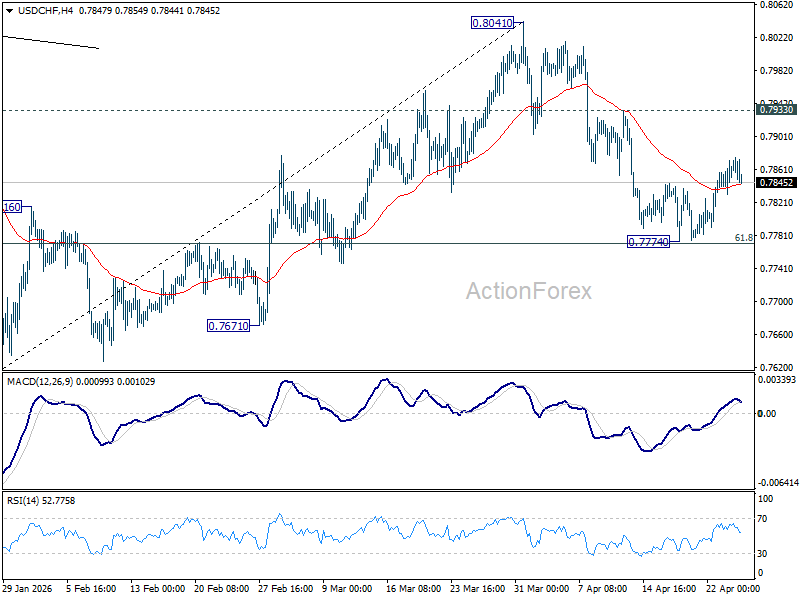
USD/CHF turned into consolidations last week and recovered, but overall outlook is unchanged. Initial bias remains neutral this week first. On the downside sustained break of 61.8% retracement of 0.7603 to 0.8041 at 0.7770 will pave the way to retest 0.7603 low. However, break of 0.7933 resistance will bring stronger rise back to retest 0.8041 high.
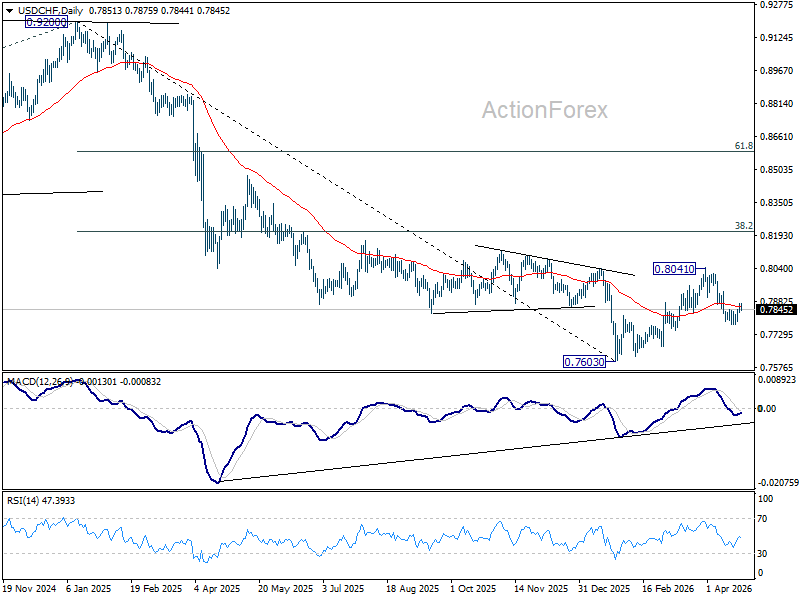
In the bigger picture, rebound from 0.7603 medium term bottom is seen as correcting the fall from 0.9200 only. Rejection by 55 W EMA (now at 0.8059) will affirm this bearish case, and setup down trend resumption to 100% projection of 1.0146 (2022 high) to 0.8332 from 0.9200 at 0.7382 at a later stage. Though, sustained break of 55 W EMA will suggest that it's probably correcting the larger scale down trend from 1.0146 (2022 high).
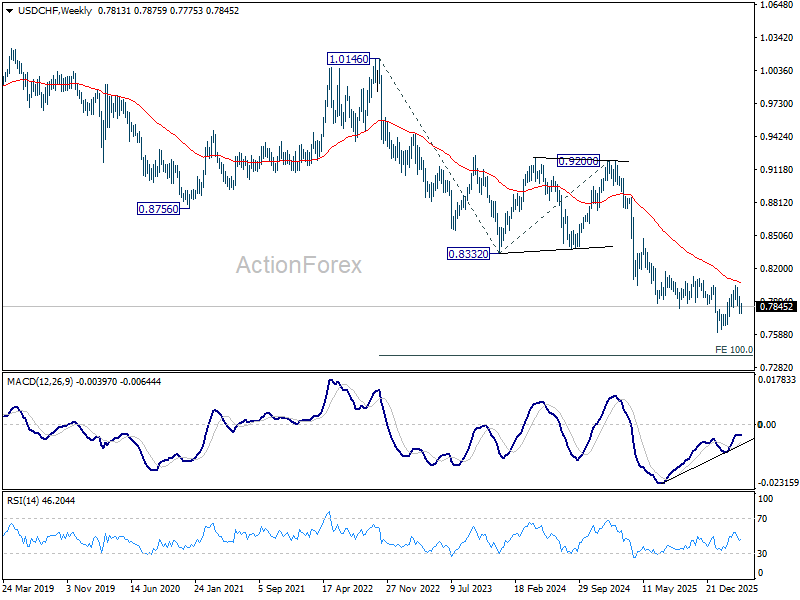
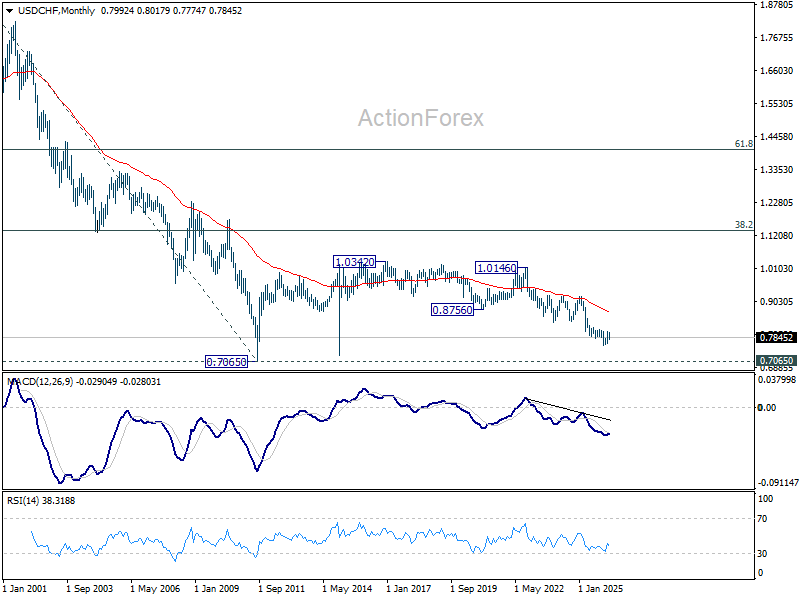
In the long term picture, price action from 0.7065 (2011 low) are seen as a corrective pattern to the multi-decade down trend from 1.8305 (2000 high). It's uncertain if the fall from 1.0342 is the second leg of the pattern, or resumption of the downtrend. But in either case, outlook will stay bearish as long as 0.8756 support turned resistance holds (2021 low). Retest of 0.7065 should be seen next.
AUD/USD Weekly Report
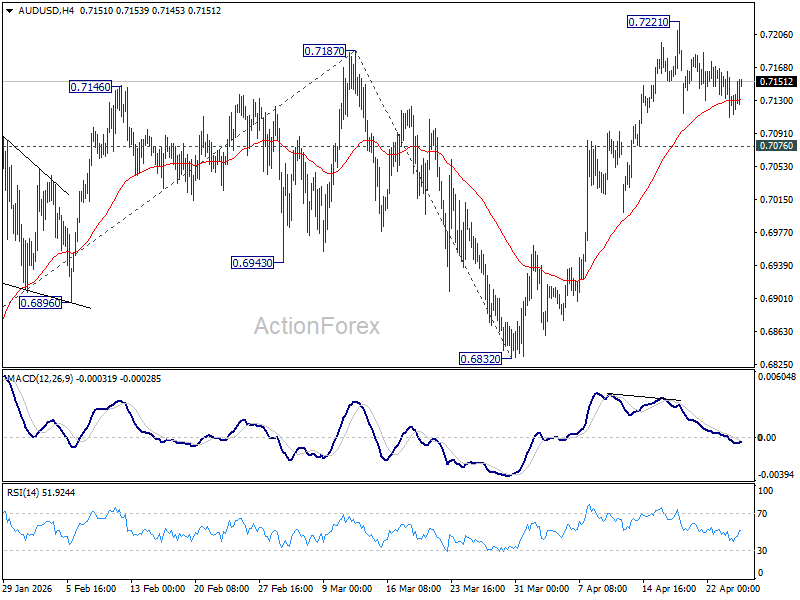
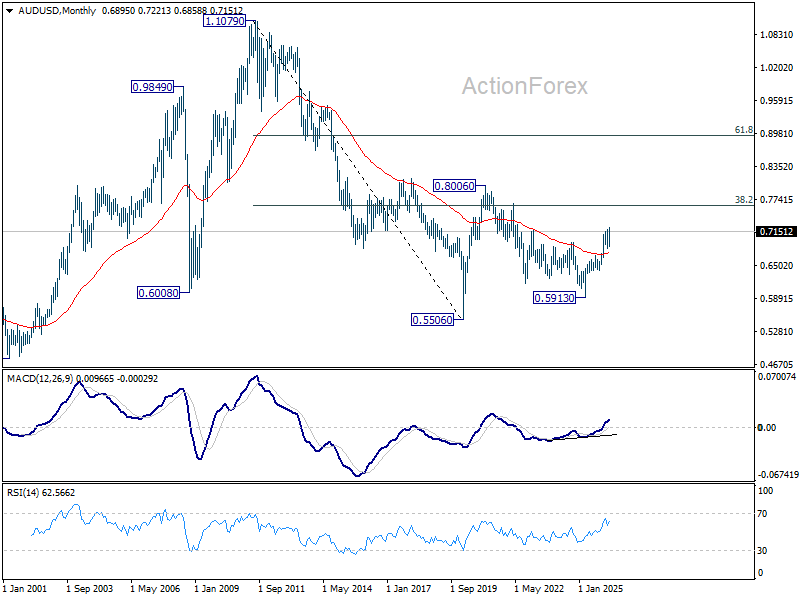
AUD/USD edged higher to 0.7221 but retreated since then. Initial bias remains neutral this week for more consolidations first. On the upside, firm break of 0.7221 will extend larger up trend to 61.8% projection of 0.6420 to 0.7187 from 0.6832 at 0.7306. On the downside, break of 0.7076 minor support will turn bias back to the downside for deeper pullback.
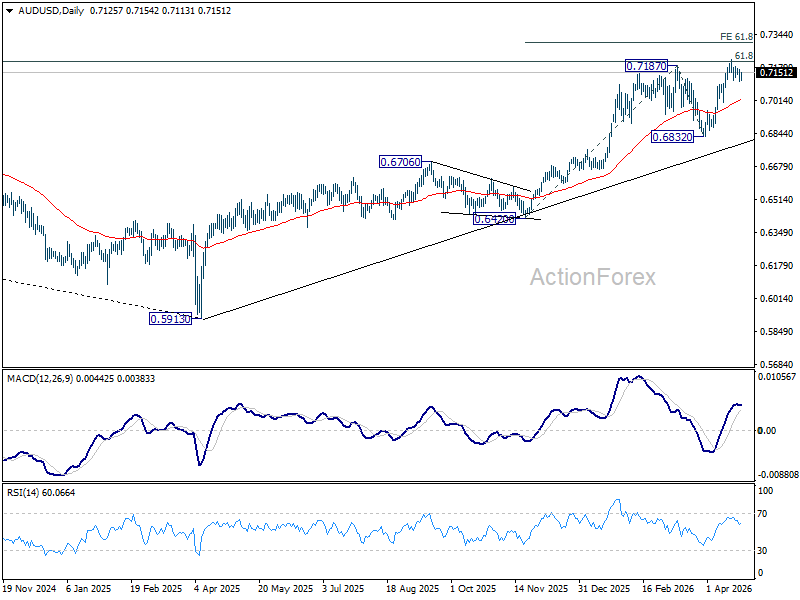
In the bigger picture, rise from 0.5913 (2024 low) is still in progress. Decisive break of 61.8% retracement of 0.8006 to 0.5913 at 0.7206 will solidify the case that it's already reversing the down trend from 0.8006 (2021 high). Further rally should then be seen to retest 0.8006. For now, outlook will remain bullish as long as 0.6832 support holds, in case of pullback.
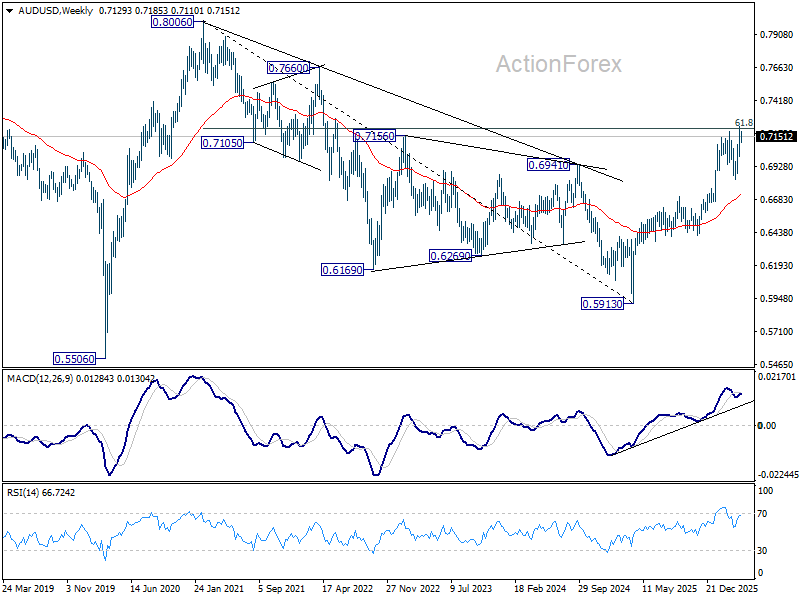
In the long term picture, rise from 0.5913 is seen as the third leg of the whole pattern from 0.5506 (2020 low). It's still early to judge if this is an impulsive or corrective pattern. But in either case, further rise should be seen back to 0.8006 and possibly above. This will remain the favored case as long as 55 W EMA (now at 0.6730) holds.
USD/CAD Weekly Outlook
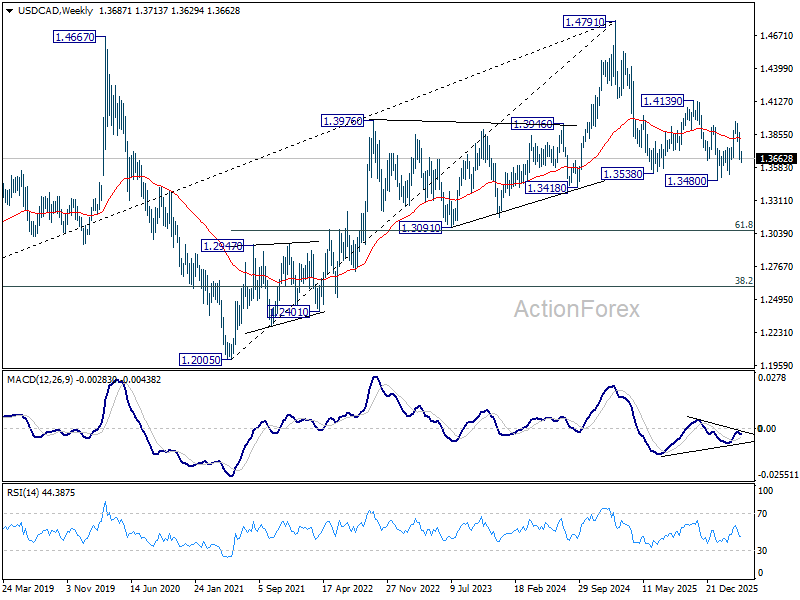
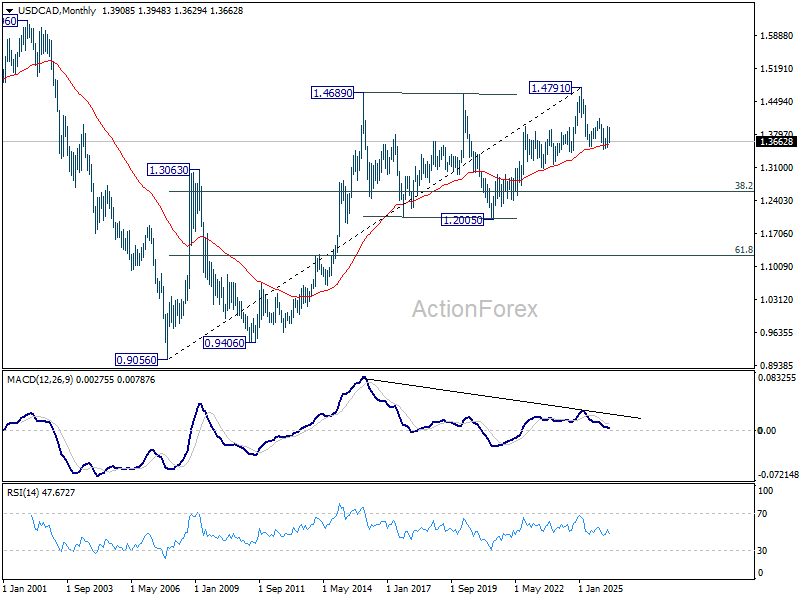
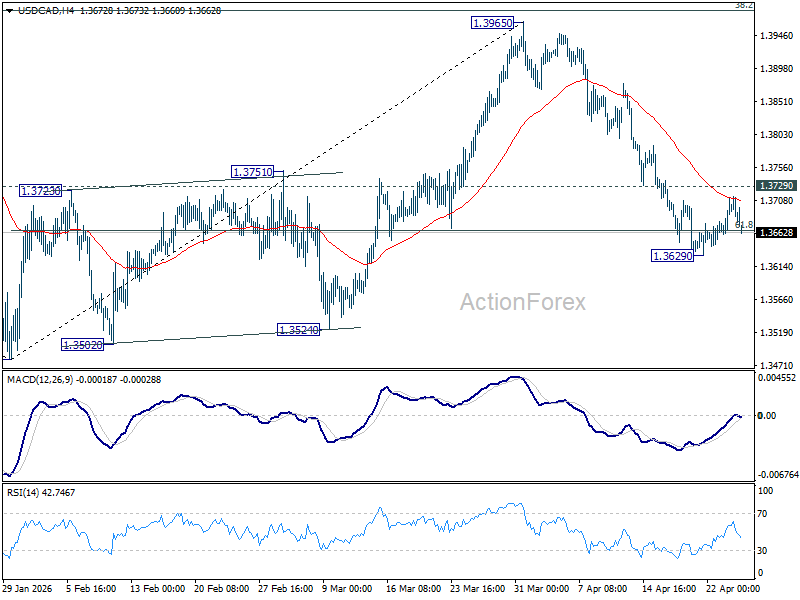
USD/CAD fell to as low as 1.3629 last week but recovered since then. Initial bias remains neutral this week first. On the downside, sustained trading below 61.8% retracement of 1.3480 to 1.3965 at 1.3665 will pave the way to retest 1.3480 low. Nevertheless, break of 1.3729 minor resistance will turn bias back to the upside for stronger rebound first.
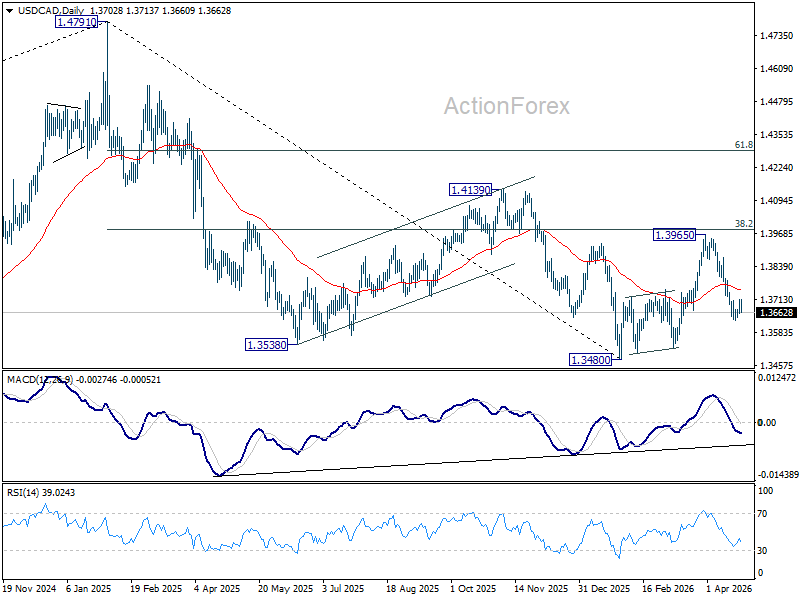
In the bigger picture, price actions from 1.4791 are seen as a corrective pattern to the whole up trend from 1.2005 (2021 low). Deeper fall could be seen, as the pattern extends, to 61.8% retracement of 1.2005 to 1.4791 at 1.3069. However, decisive break of 38.2% retracement of 1.4791 to 1.3480 at 1.3981 will argue that the correction has completed with three waves down to 1.3480 already. Further break of 1.4139 will confirm and bring retest of 1.4791 high.
In the long term picture, rising 55 M EMA (now at 1.3590) remains intact. Thus, up trend from 0.9056 (2007 low) could still be in progress. However, considering bearish divergence condition M MACD, sustained trading below 55 M EMA will argue that the up trend has completed with five waves up to 1.4791, and turn medium term outlook bearish for correction to 38.2% retracement of 0.9056 to 1.4791 at 1.2600.