Sample Category Title
USD/JPY Mid-Day Outlook
Daily Pivots: (S1) 159.41; (P) 159.64; (R1) 159.99; More...
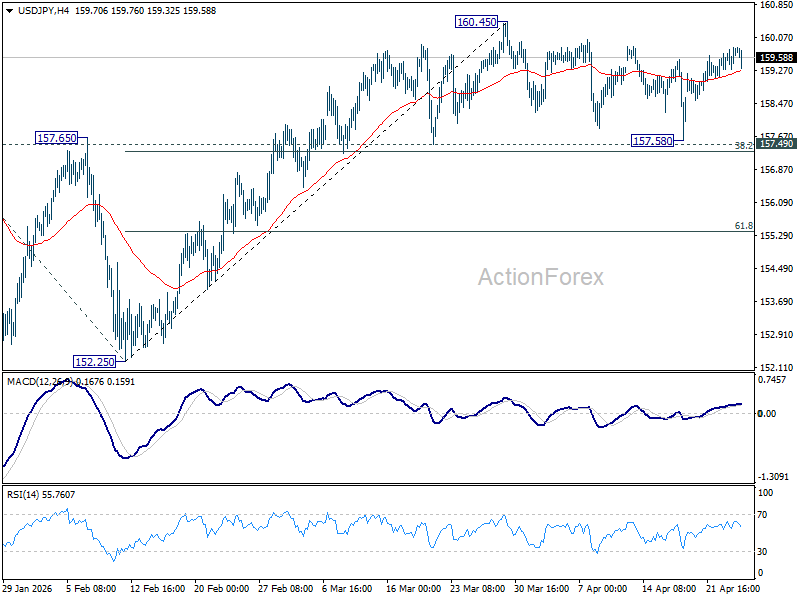
Outlook in USD/JPY remains unchanged as range trading continues. Intraday bias stays neutral. Further rise is expected with 157.49 cluster support (38.2% retracement of 152.25 to 160.45 at 157.31) intact. On the upside break of 160.45 will target a retest on 161.94 high. However, firm break of 157.31/49 will bring deeper fall back to 61.8% retracement at 155.38 next.
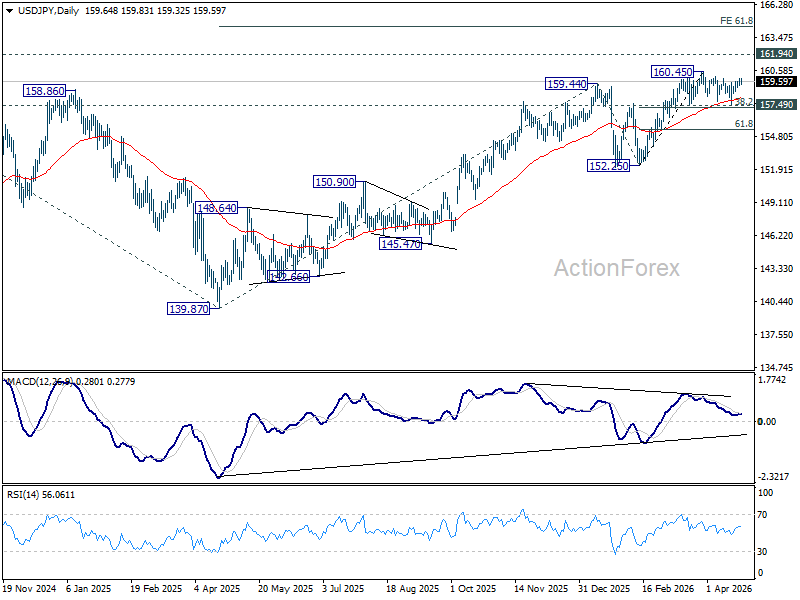
In the bigger picture, outlook is unchanged that corrective pattern from 161.94 (2024 high) should have completed with three waves at 139.87. Larger up trend from 102.58 (2021 low) could be ready to resume through 161.94. This will remain the favored case as long as 55 W EMA (now at 153.80) holds. Firm break of 161.94 will pave the way to 61.8% projection of 102.58 to 161.94 from 139.87 at 176.75.
EUR/USD Mid-Day Outlook
Daily Pivots: (S1) 1.1663; (P) 1.1691; (R1) 1.1712; More….
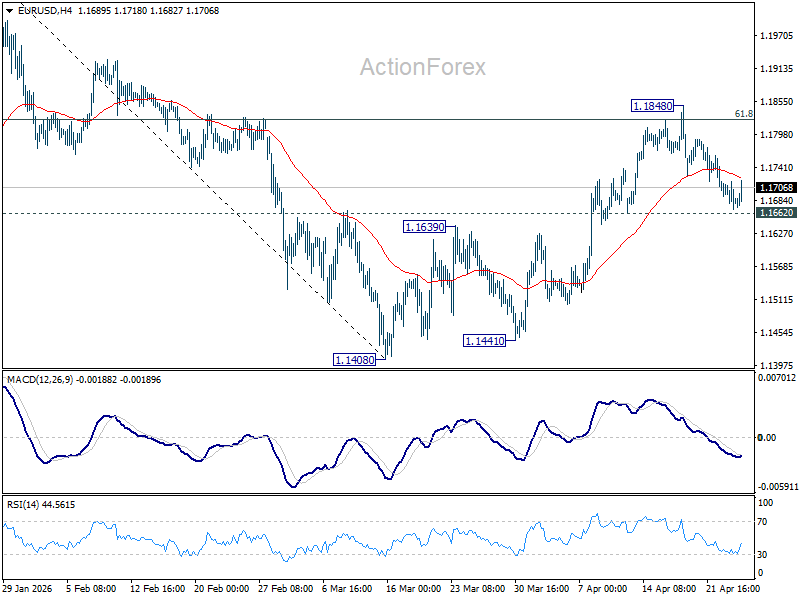
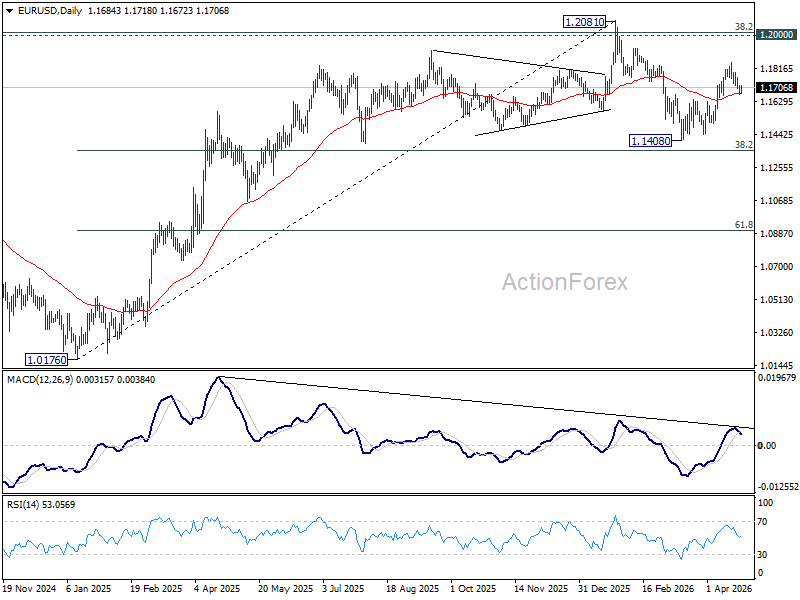
EUR/USD recovers ahead of 1.1662 support and intraday bias remains neutral. Further rise is still mildly in favor. On the upside, sustained trading above 61.8% retracement of 1.2081 to 1.1408 at 1.1824 will pave the way to retest 1.2081 high. However, firm break of 1.1662 support will indicate the the rebound fro 1.1408 has completed, and bring deeper decline back towards this low instead.
In the bigger picture, the strong support from 38.2% retracement of 1.0176 to 1.2081 at 1.1353 suggests that the pullback from 1.2081 is more likely a corrective move. Strong support was also found in 55 W EMA (now at 1.1507). Focus is back on 1.2 key cluster resistance level. Decisive break there will carry long term bullish implications. Nevertheless, break of 1.1408 support will revive the case of medium term bearish trend reversal.
Dollar Eases as US–Iran Talk Hopes Rise, Markets on Guard for Weekend Risk
Dollar is paring back some of this week’s gains as tentative optimism emerges around a possible revival in US–Iran peace talks. The shift in sentiment is modest but notable, with traders dialing down some defensive positioning built earlier in the week. Oil prices are also reflecting this adjustment, with Brent pulling back to around $105 after briefly touching $108 earlier in the day.
The key catalyst is the report that Iranian Foreign Minister Abbas Araqchi is scheduled to arrive at Islamabad tonight, leading a high-level delegation. This development is being interpreted as a key signal that diplomatic channels are reopening after a week of uncertainty.
Pakistan’s role has been critical. Prime Minister Shehbaz Sharif and his mediation team have been actively working behind the scenes to bridge gaps after the first round of talks failed. The fact that discussions have progressed to the point of a physical meeting suggests that backchannel diplomacy has made tangible progress.
In diplomatic terms, such a visit is not symbolic. A foreign minister does not enter a high-stakes negotiation environment without a pre-negotiated framework or at least a baseline for discussion. Araqchi’s arrival suggests that both sides may have moved beyond the earlier stalemate over the 10-point plan.
His profile also matters. Araqchi is widely seen as a pragmatic negotiator, in contrast to the more hardline stance of the IRGC. His involvement signals that Iran’s leadership may be willing to explore a more flexible position, potentially opening the door for progress.
Equally important is the continued US presence in Islamabad. Reports that logistics and security teams remained on the ground even when talks were “on hold” earlier in the week indicate that Washington never fully disengaged. This suggests that neither side is prepared to let the ceasefire collapse outright.
Still, uncertainty remains high. The geopolitical backdrop has not fundamentally changed, with maritime tensions and supply risks in the Strait of Hormuz continuing to underpin oil prices. This limits the extent of risk recovery and keeps markets cautious.
In FX markets, the reaction is measured. Canadian Dollar leads the week so far, supported by oil, while Dollar holds firm despite today’s pullback. Euro continues to lag on weak economic fundamentals, and Yen remains under pressure, though intervention risks persist. Aussie and Kiwi are positioned in the middle.
Overall, markets are positioning carefully, aware that any breakthrough—or breakdown—over the weekend could trigger sharp gaps at the next open.
In Europe, at the time of writing, FTSE is down -0.24%. DAX is up 0.28%. CAC is down -0.41%. UK 10-year yield is down -0.205 at 4.992. Germany 10-year yield is up 0.005 at 3.016. Earlier in Asia, Nikkei rose 0.97%. Hong Kong HSI rose 0.24%. China Shanghai SSE fell -0.33%. Singapore Strait Times fell -0.43%. Japan 10-year JGB yield rose 0.014 to 2.441.
Canada Retail Sales Rise 0.7% in February, Miss Expectations Despite Broad Gains
Canada retail sales rose 0.7% in February, missing expectations, while core sales gained 0.6%. Advance estimate points to another 0.6% increase in March. Read More.
Germany Ifo Falls to 84.4 as Iran Crisis Hits Confidence
German business confidence has dropped to pandemic-era lows as the Iran crisis hits sentiment. The outlook is deteriorating fast. Read More.
UK Retail Sales Rise 0.7% as Fuel Stockpiling Drives March Rebound
UK retail sales rose 0.7% in March, beating expectations as fuel buying surged, while underlying demand remained modest with ex-fuel sales up just 0.2%. Read More.
SNB's Schlegel Flags Global Uncertainty from Middle East Conflict, Signals Policy Readiness
Rising energy prices are pushing inflation higher—and central banks are watching closely. SNB signals readiness to act. Read More.
Japan's Core Inflation Rises to 1.8% in March, Core-Core Ticks Down
Japan CPI rises to 1.8% in March but remains below BoJ's target as core-core inflation slips to 2.4%. Rising oil prices and cost pressures pose risks ahead. Read More.
EUR/USD Mid-Day Outlook
Daily Pivots: (S1) 1.1663; (P) 1.1691; (R1) 1.1712; More….
EUR/USD recovers ahead of 1.1662 support and intraday bias remains neutral. Further rise is still mildly in favor. On the upside, sustained trading above 61.8% retracement of 1.2081 to 1.1408 at 1.1824 will pave the way to retest 1.2081 high. However, firm break of 1.1662 support will indicate the the rebound fro 1.1408 has completed, and bring deeper decline back towards this low instead.
In the bigger picture, the strong support from 38.2% retracement of 1.0176 to 1.2081 at 1.1353 suggests that the pullback from 1.2081 is more likely a corrective move. Strong support was also found in 55 W EMA (now at 1.1507). Focus is back on 1.2 key cluster resistance level. Decisive break there will carry long term bullish implications. Nevertheless, break of 1.1408 support will revive the case of medium term bearish trend reversal.
Canada Retail Sales Rise 0.7% in February, Miss Expectations Despite Broad Gains
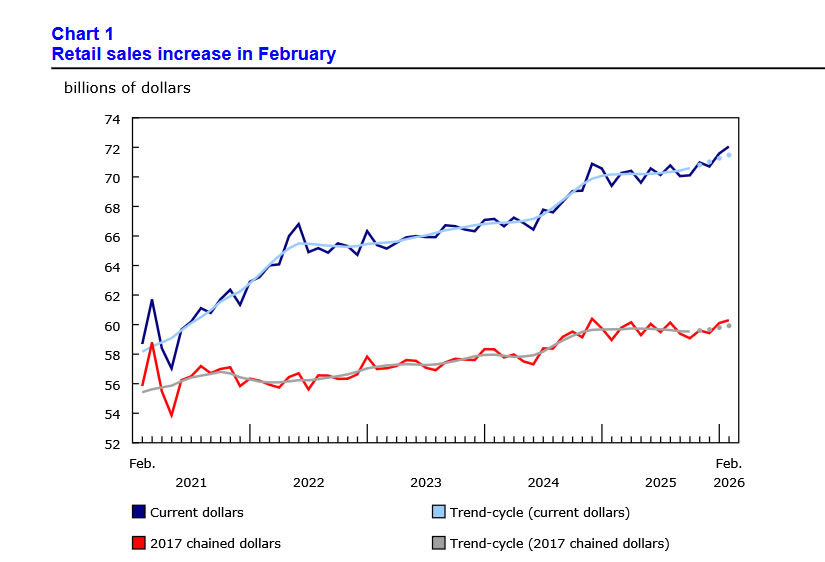
Canada’s retail sales rose 0.7% mom to CAD 72.1B in February, falling short of expectations for a 0.9% increase but still marking a solid gain after recent softness. The advance was relatively broad-based, with sales increasing in seven of nine subsectors.
The main driver came from motor vehicle and parts dealers, where sales rose 1.0% for a second consecutive month. Core retail sales, which exclude autos and fuel, also showed resilience with a 0.6% increase.
Looking ahead, preliminary estimates from Statistics Canada point to a further 0.6% rise in March.
| Indicator | Feb 2026 |
|---|---|
| Retail Sales (MoM) | +0.7% |
| Retail Sales Value | CAD 72.1B |
| Core Retail Sales (MoM) | +0.6% |
| Motor Vehicle & Parts Sales | +1.0% |
| Subsector Performance | 7 of 9 ↑ |
| Advance Estimate (March MoM) | +0.6% |
Weekly Recap: Dollar, Crude Oil and S&P500 Continues Their Growth
US Dollar
The US dollar has continued its advance amid a reduced likelihood of de-escalation in the Middle East conflict. The US has ruled out military action and intends to deprive Iran of oil revenues by blocking the Strait of Hormuz. This long-term game risks extending the rally in Brent and WTI. This will deal a blow to the eurozone, which is dependent on energy imports. Under these conditions, Germany has halved its 2026 GDP forecast, from 1% to 0.5%, and the EURUSD pair has retreated.
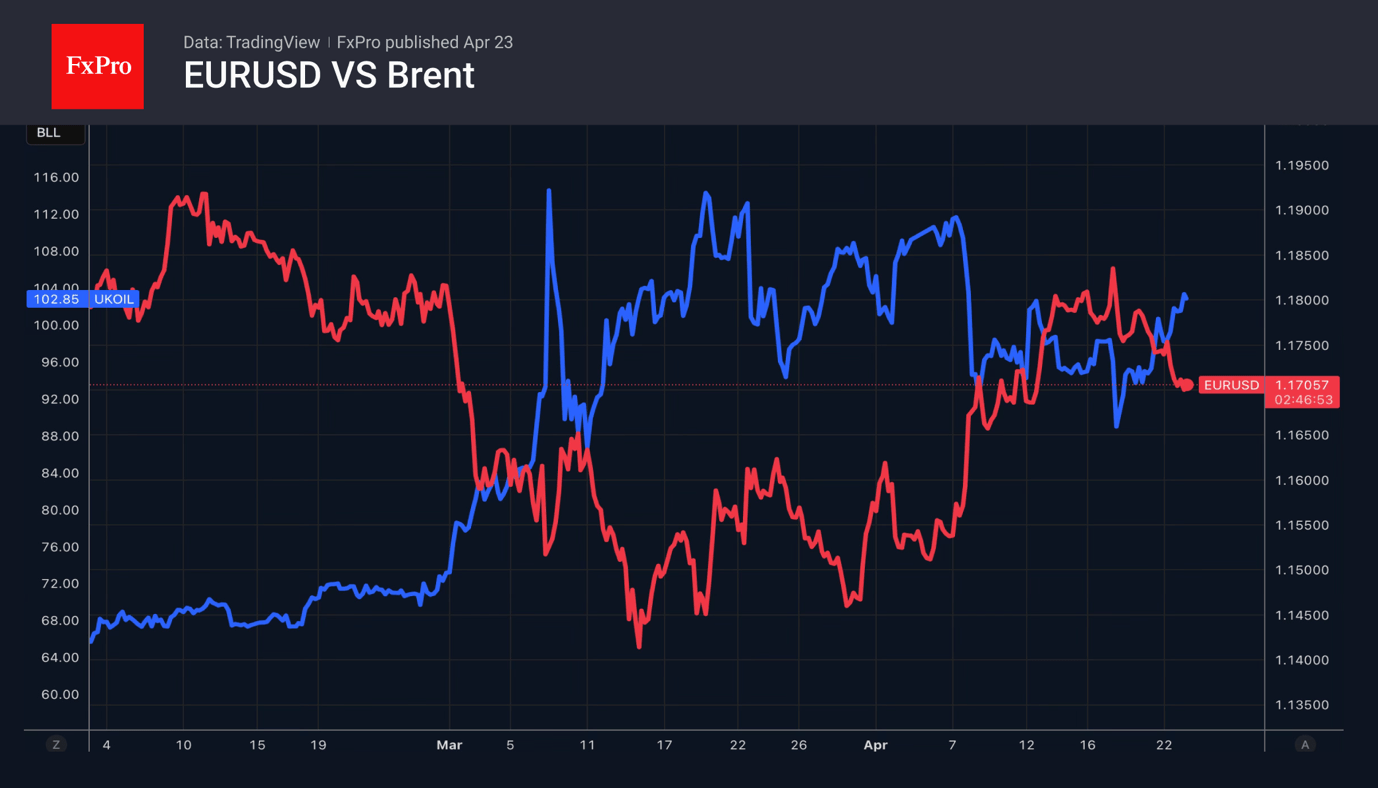
Rising oil prices are weighing on the euro due to deteriorating trade conditions within the currency bloc. However, for most of April, EURUSD rose as investors bought into rumours of productive talks between the US and Iran. As soon as it became clear that the opposing sides had reached a stalemate, the regional currency began to be sold off on the back of the facts.
The euro’s retreat is reinforcing the S&P 500’s rapid rally. The broad stock index has hit a new record high, driven by bargain-hunting by the market crowd amid expectations of strong corporate earnings. The US economy will suffer less from the closure of the Strait of Hormuz and high oil prices than the European economy. As a result, alongside FOMO (the fear of missing out), the theme of American exceptionalism may return to markets. Under such conditions, the USD index and equities will move in the same direction.
Stock indices
The US stock market has concluded that the worst of the conflict in the Middle East is behind us. Oil prices have not skyrocketed, and the rise has not triggered a global recession. Hostilities have given way to a ceasefire, and the parties are moving towards a diplomatic settlement of their disputes. So, it is time to put geopolitics aside and focus on fundamentals. Expectations of strong corporate earnings reports and attractive company valuations have catalysed the S&P 500 rally.
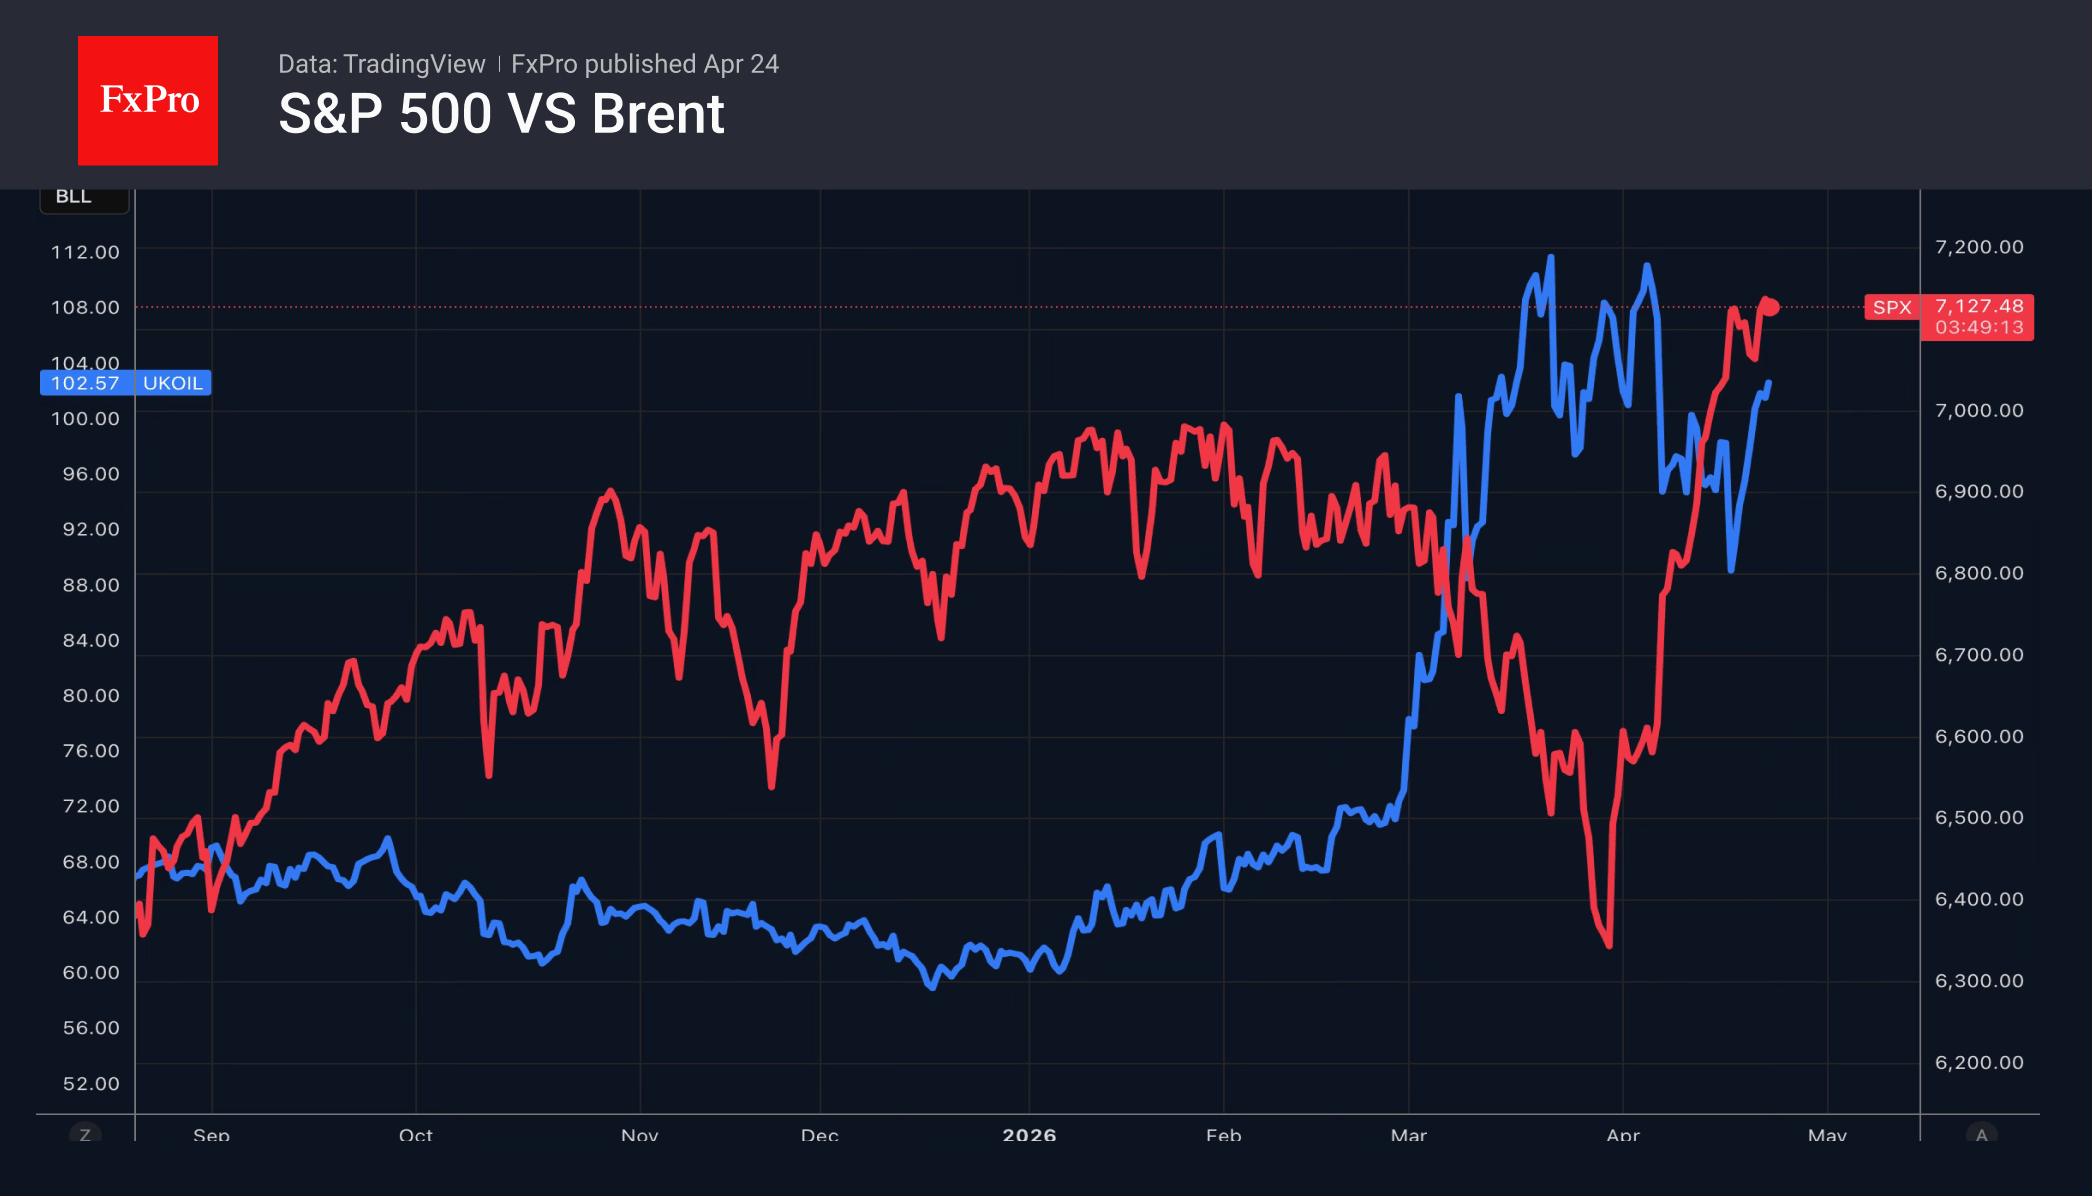
At first glance, the surge in the US stock market was driven by the success of a handful of large-cap companies. When the broad stock index hit a new October high, only 11 S&P companies reached 52-week highs. In the 2021 bull market, around 90% of issuers were trading above their 200-day moving averages. Now, only 60% are.
Nevertheless, the market always follows the leaders. This is likely to manifest as increased trading volumes in US shares. In April, these volumes were 11% below their average levels over the past six months. In March, by contrast, against the backdrop of the escalating conflict in the Middle East, they were 9.5% higher.
Gold
The strengthening of the US dollar is forcing gold into a defensive stance. The precious metal rose in the first half of April on expectations that the conflict’s peak had passed and that de-escalation would lead to lower oil prices. As this has not yet happened, investors have adopted a worrying scenario: that central banks will be forced to tighten monetary policy on a massive scale due to high inflation.
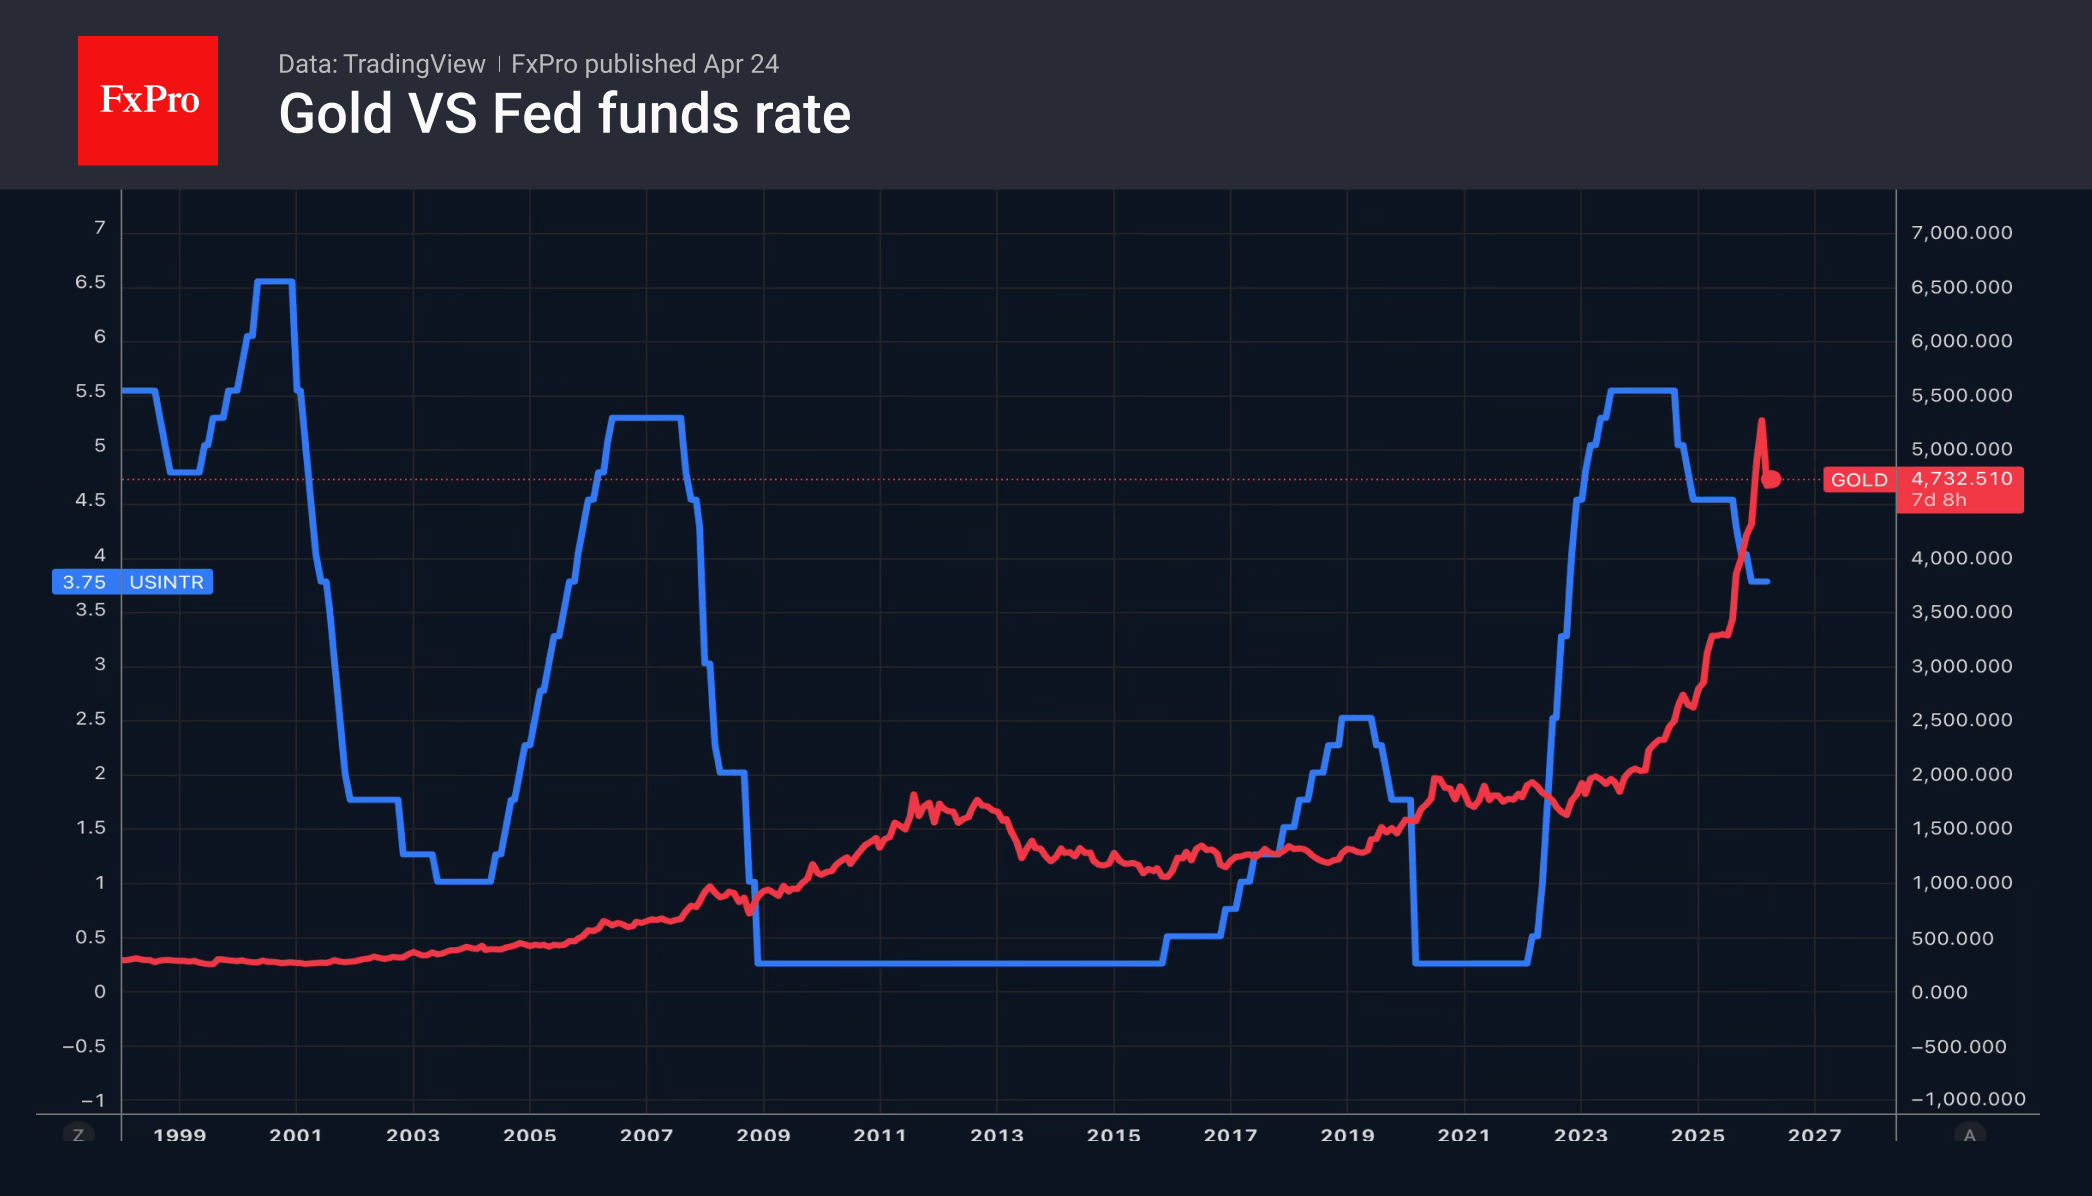
According to the Amundi asset management company, the surge in consumer prices triggered by the energy shock is likely to be temporary rather than permanent. Core inflation will be better contained than in 2022. This will reduce the need for central banks to adopt a more ‘hawkish’ stance, thereby supporting gold.
Central bank bullion sales could put pressure on the price of the precious metal. Since the start of the year, Russia has sold 22 tonnes to finance its budget deficit. As a result, the country’s gold reserves have fallen to 2,304 tonnes.
Cryptocurrency
Improved global risk appetite and new record highs for US stock indices have breathed new life into Bitcoin. Prices have reached their highest levels since late January, and the upward momentum stands a good chance of continuing following Donald Trump’s announcement of an indefinite extension of the ceasefire. Investors have concluded that the peak of the conflict escalation has passed and have begun buying risky assets.
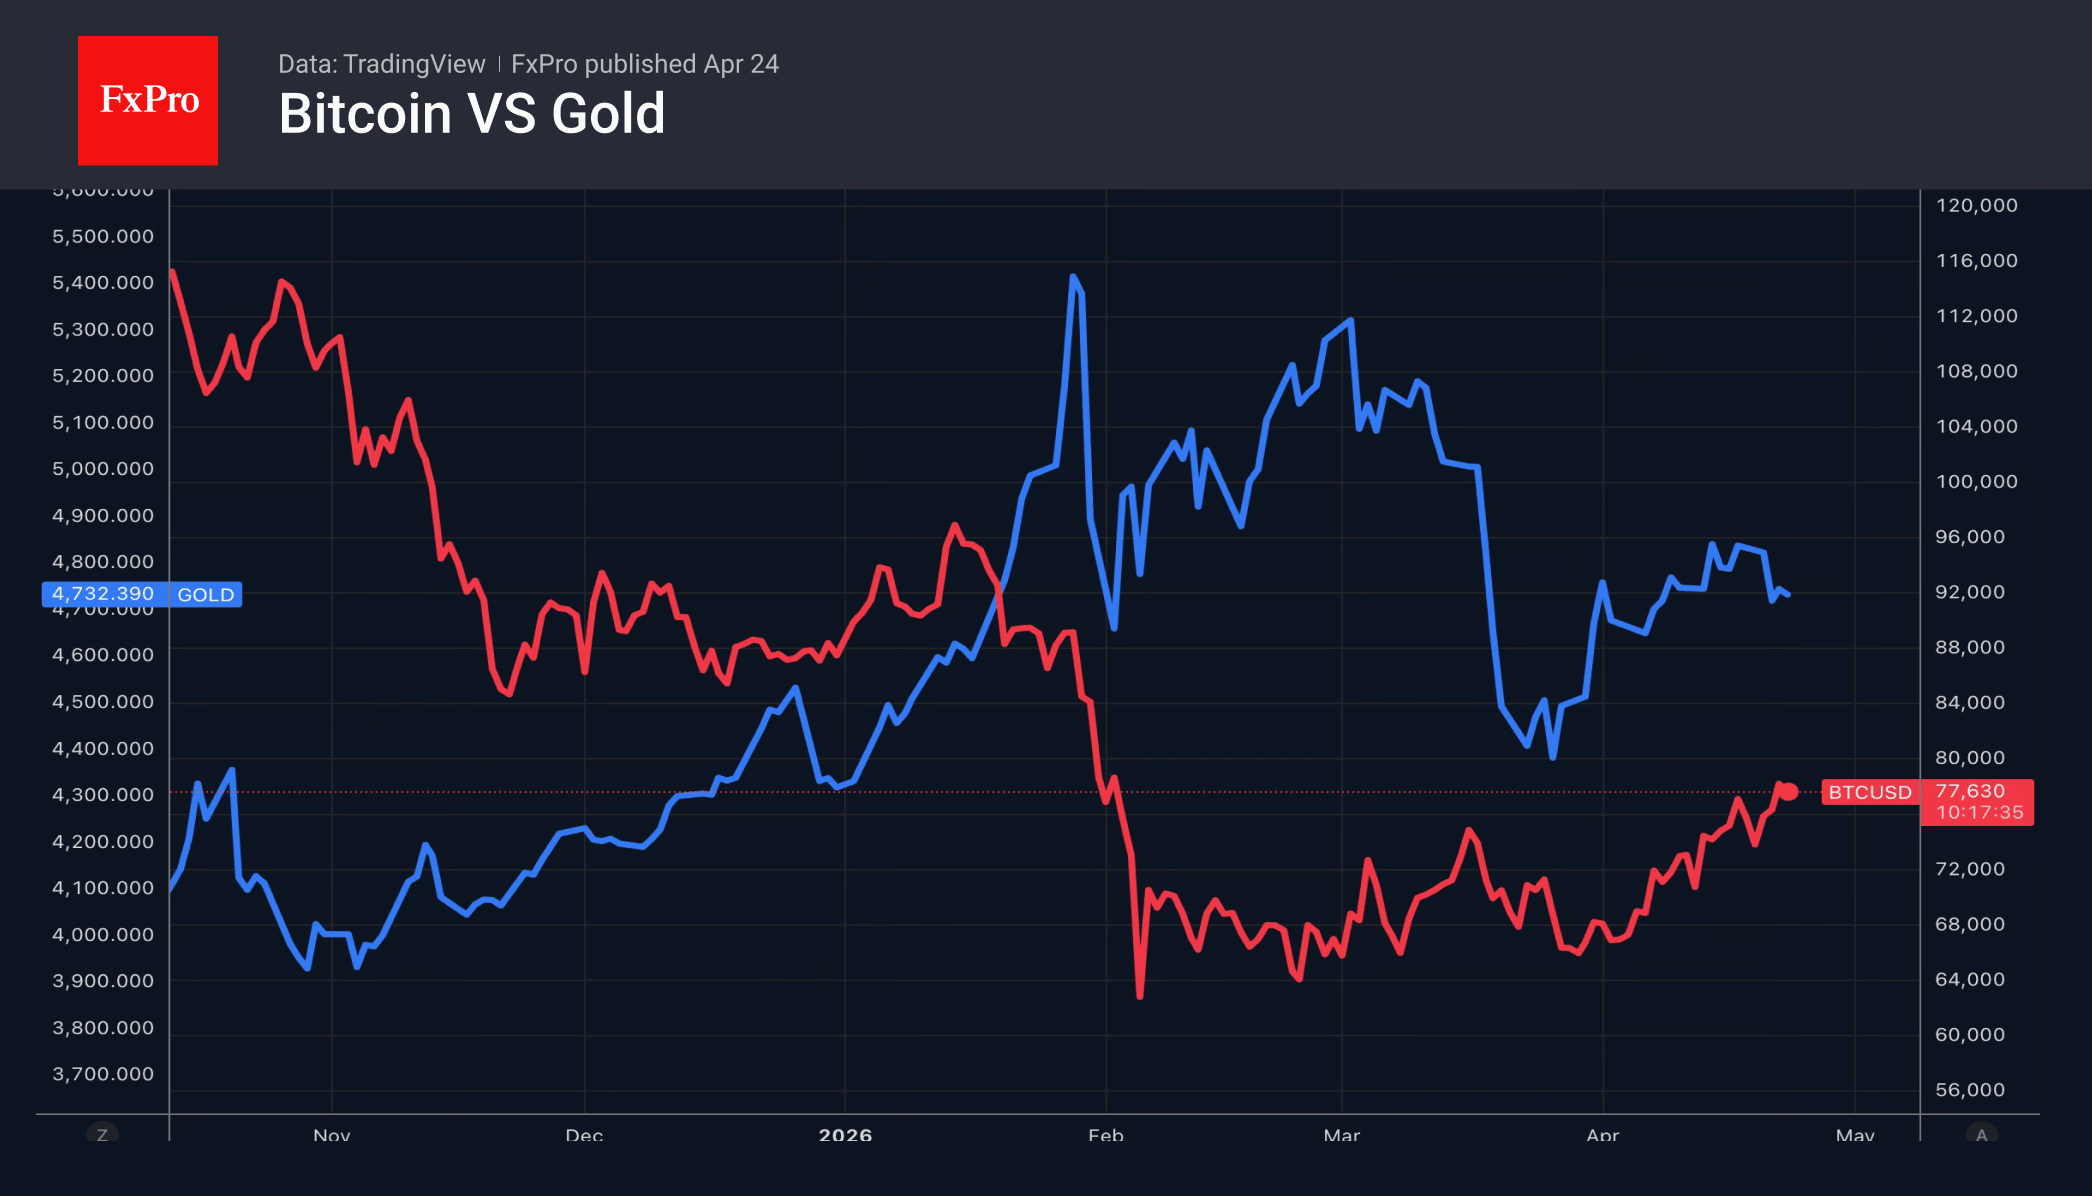
Geopolitics has helped Bitcoin outperform gold. The precious metal has lost around 10% of its value since the start of the bombing of Iran, whereas the cryptocurrency has risen by 15%. In recent days, Bitcoin has frequently ignored the bad news and focused solely on the good. This points to ‘bullish’ sentiment in the market.
The most steadfast Bitcoin supporters have come out on top. For instance, Michael Saylor’s Strategy has been to buy up tokens despite the price decline. By the end of the week on the 19th of April, it had acquired $2.54 billion worth of digital assets. This is the largest purchase since November 2024.
What next?
Markets are tired of geopolitics and will be keen to see how central banks respond to the first signs of rising inflation caused by the conflict in the Middle East and high oil prices. Japan, Canada, the UK and the eurozone will announce their interest rate decisions. Although no changes to monetary policy are expected, investors will be watching closely for ‘hawkish’ signals.
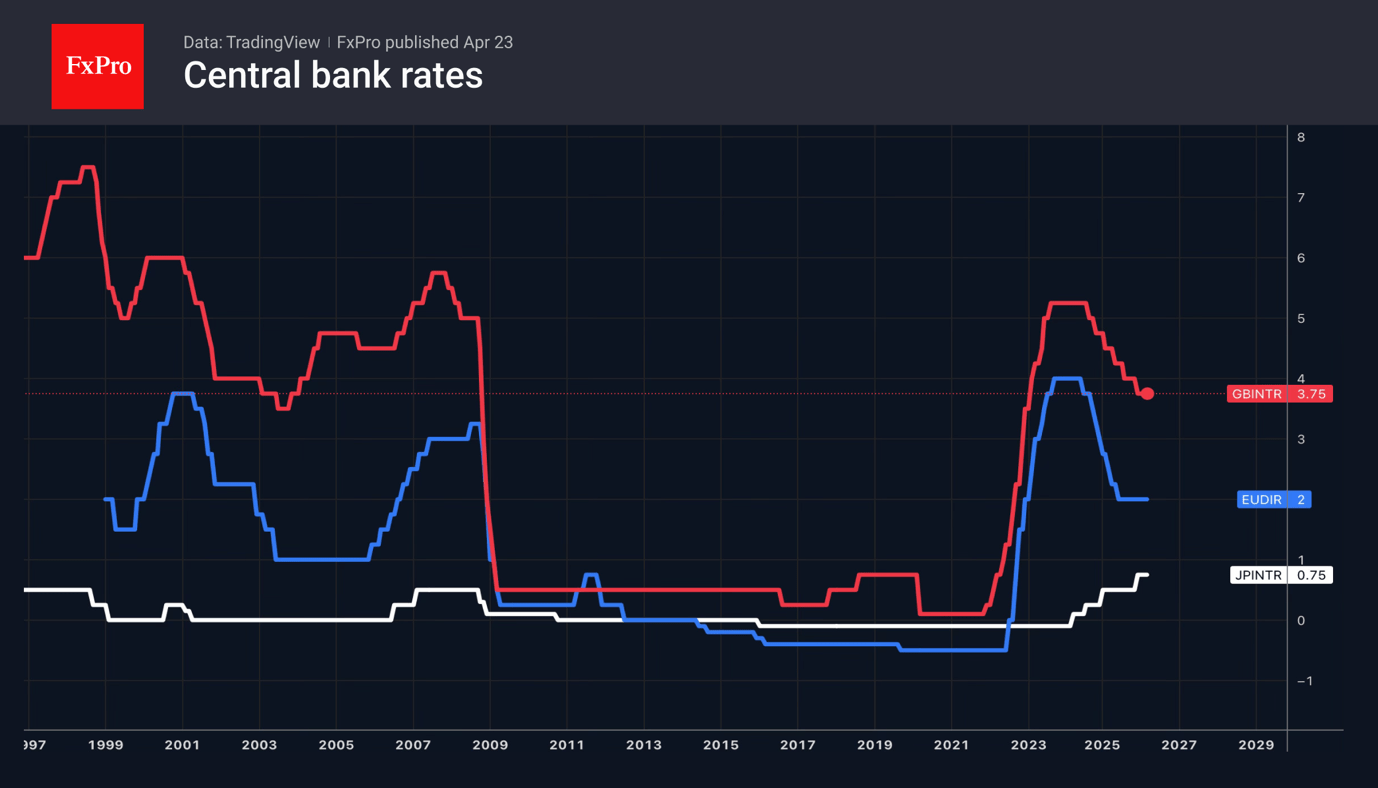
Central banks face a difficult choice. Accelerating inflation requires them to raise rates, whilst slowing economic growth calls for a loosening of monetary policy. Most likely, the ECB and other regulators will keep the door open to monetary tightening and continue to monitor developments in the Middle East.
In the meantime, Donald Trump never tires of talking about negotiations. If investors once again believe the US president, the fall in EURUSD risks coming to a halt.
Markets will not overlook the story of Congress’s consideration of Kevin Warsh’s nomination for the post of Fed Chair. The new central bank chief’s appointment may be delayed due to opposition from some Republicans.
Dollar Gaining Ground, Mirroring the 2022 Pattern
- The US dollar is gaining amid persistent inflationary risks.
- Traders are betting on the ECB’s 2022 playbook, selling the euro.
The US dollar has strengthened over five of the last six sessions, driven by increased demand for safe-haven assets and investor confidence that the US economy will fare better than the rest of the world. Purchasing Managers’ Indexes showed clear signs of stagflation, with price indices rising, while overall business activity is slowing. Meanwhile, the European PMI fell to a 17-month low.
According to Joachim Nagel, Donald Trump’s attacks on the Fed are fuelling mistrust in American institutions and a flight from US assets and the dollar. He cited a 2025 Bundesbank study that found that the president’s pressure on the central bank led to rising inflation expectations, lower Treasury bond yields, and a weaker dollar.
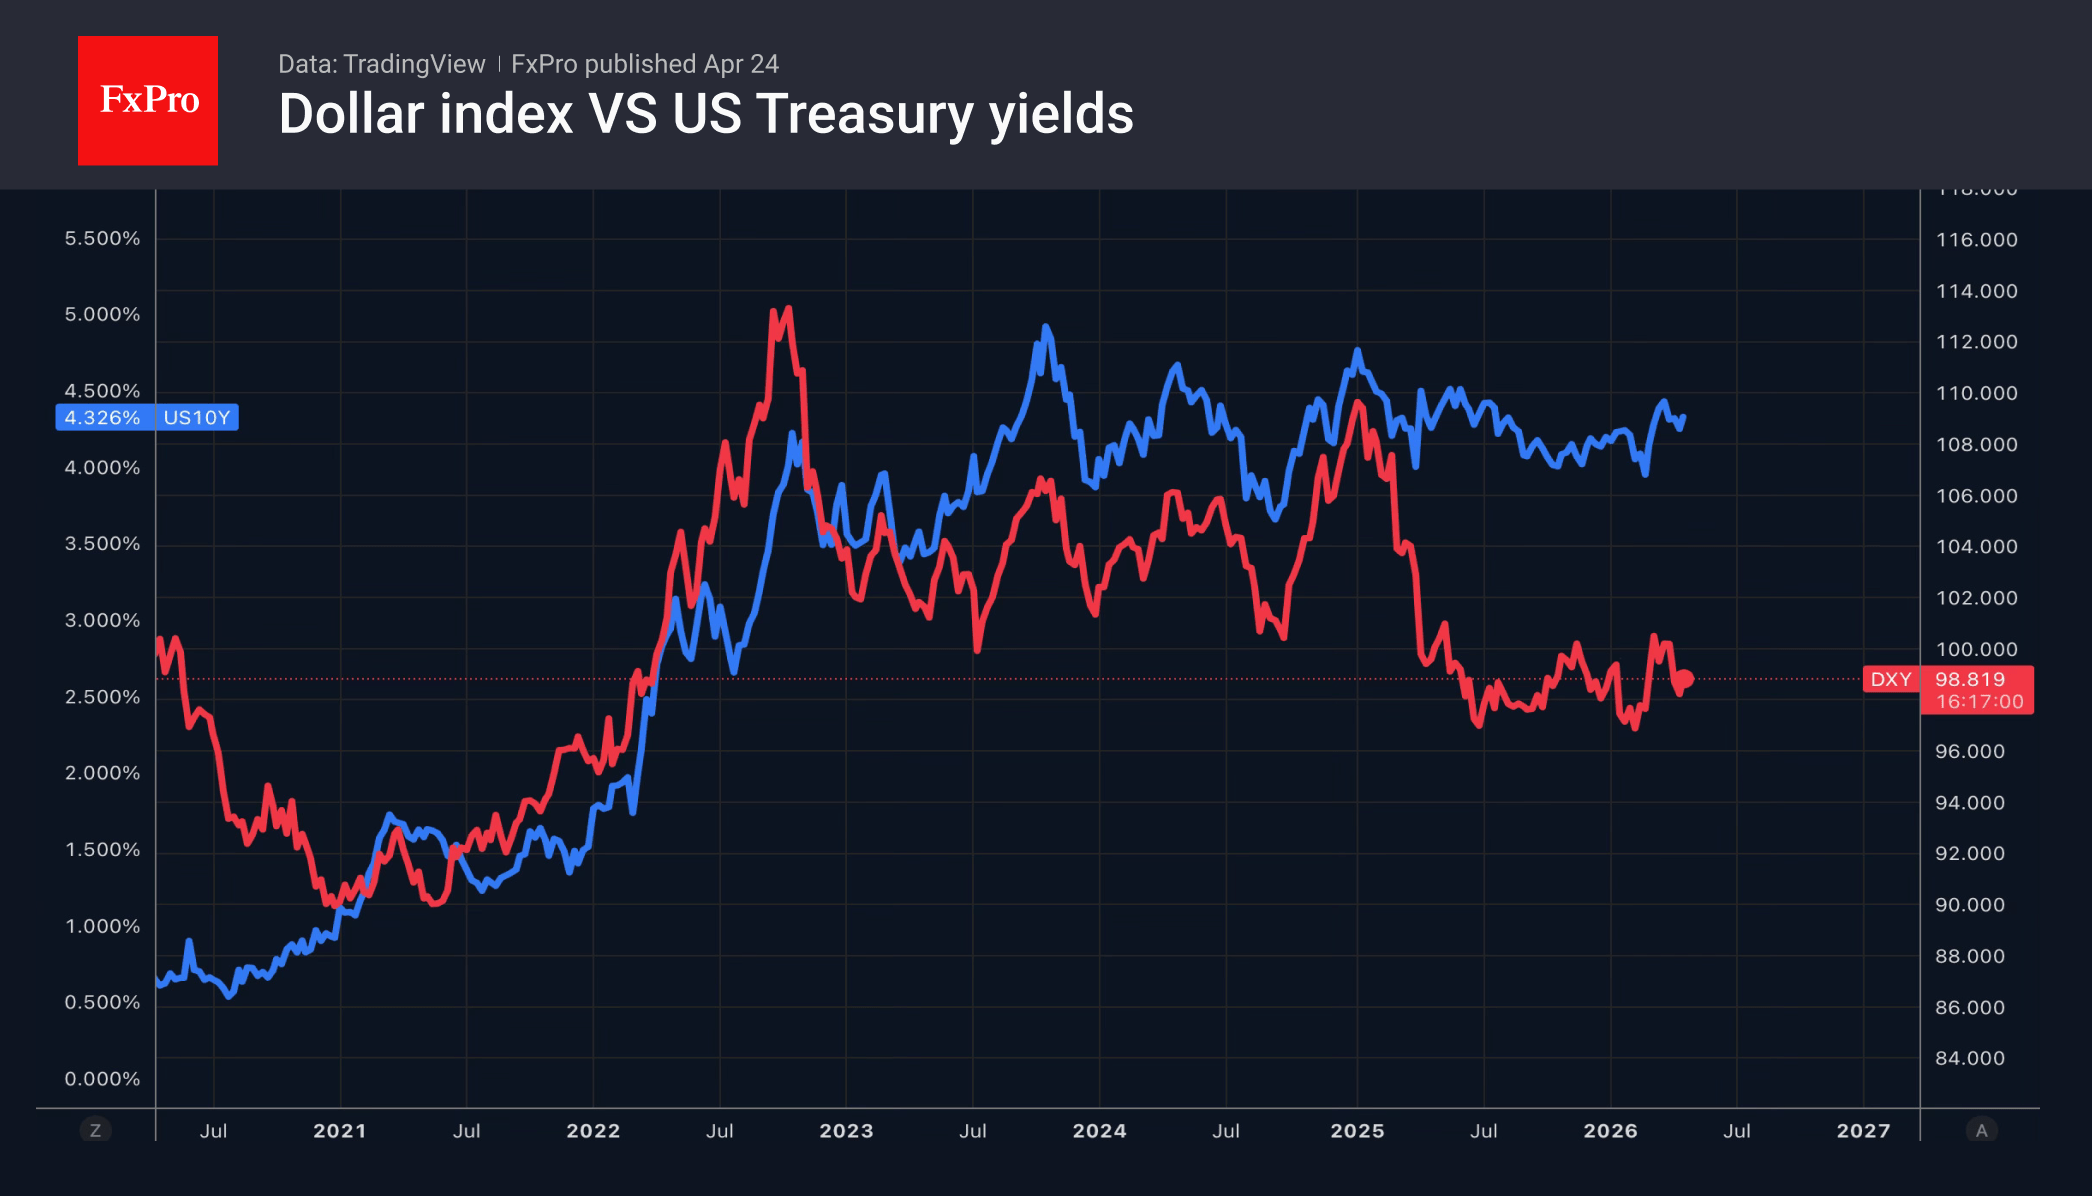
Unsurprisingly, Donald Trump’s threats to sack Jerome Powell if he remained in the FOMC after his term as chair expired put pressure on the greenback. However, the growing risks of a renewed escalation of the conflict in the Middle East triggered the opposite process. Instead of fleeing the US, investors are actively buying up American assets. They believe that the US economy will fare better than the rest of the world.
Traders are following the 2022 pattern, when Europe, weighed down by the energy crisis, was unable to offer any resistance to the US, and the EURUSD fell below parity. Not least, this was a consequence of the ECB’s slower response to rising inflation. The Fed began raising rates in March, while the European Central Bank only followed suit in July.
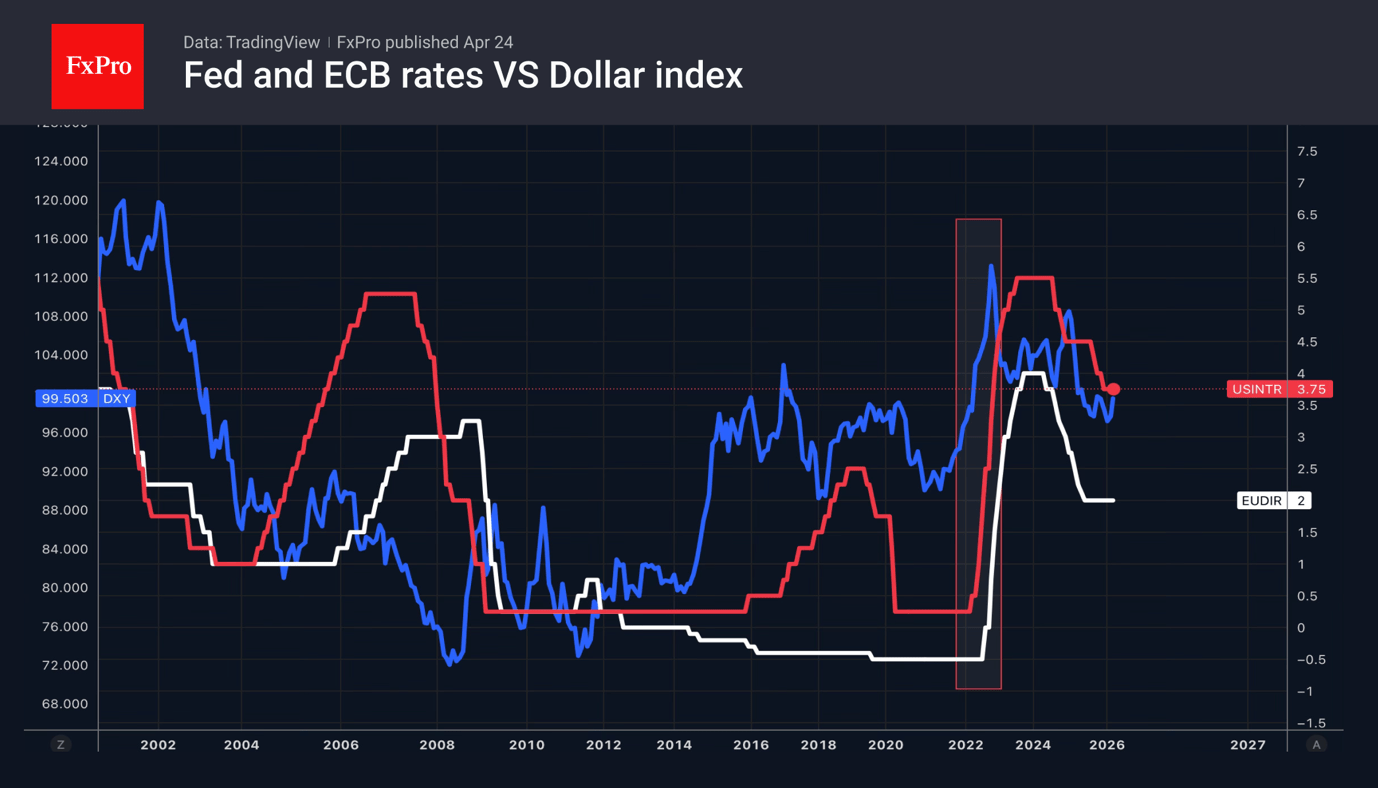
This time, Christine Lagarde and her team intend to act decisively. Bloomberg experts do not expect the ECB to tighten monetary policy in April. However, at the upcoming meeting, the Governing Council is certain to signal its readiness to raise rates.
Meanwhile, the USDJPY’s approach to the psychologically significant 160 mark has triggered a fresh wave of verbal interventions. Finance Minister Satsuki Katayama stated that officials are in close contact with their American counterparts around the clock to counter speculators weakening the yen. The authorities have sufficient funds to counter them.
Gold Falls Nearly 3.0% Over the Week Amid Geopolitical Pressure
On Friday, the price of gold remained below 4,700 USD per ounce. For the week, the price is expected to decline by approximately 3.0%, as escalating tensions between the US and Iran over the Strait of Hormuz support rising energy prices and heighten concerns about inflation.
Both sides are maintaining their blockades of this strategically vital waterway, with peace talks showing little progress.
US President Donald Trump said on social media on Thursday that he had ordered the US Navy to target and destroy any vessels laying mines in the strait. US troops also boarded a supertanker carrying Iranian oil in the Indian Ocean.
Meanwhile, the truce between the US and Iran has been extended indefinitely, as Washington awaits a new formal proposal from Tehran. The truce between Israel and Lebanon has also been prolonged for three weeks.
High energy prices are reinforcing inflation risks and strengthening expectations of potential interest rate hikes by central banks. Collectively, these factors are weighing on gold, reducing its appeal as a non-yielding asset.
Technical Analysis
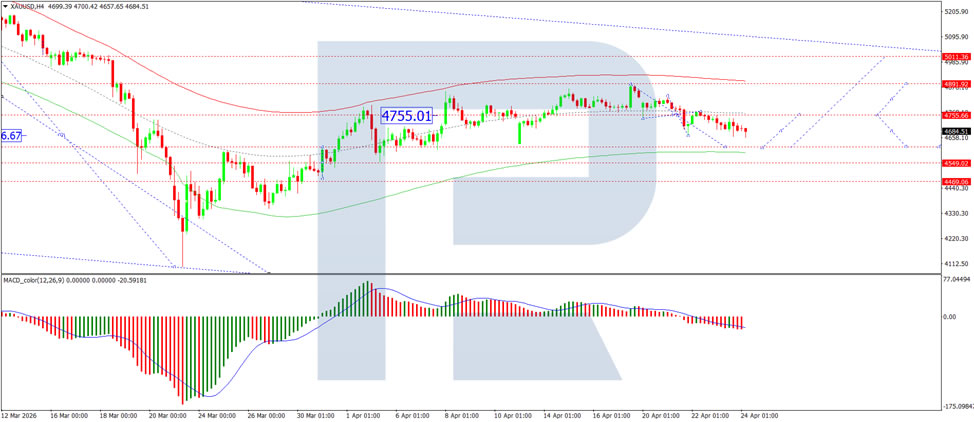
On the H4 XAU/USD chart, gold is trading within a consolidation range around the 4,685 USD level. An upside breakout could push prices towards 4,755 USD, while a downside break could lead to a decline towards 4,616 USD. The MACD indicator confirms the current downside momentum, with its signal line below the centre line and pointing firmly downwards.
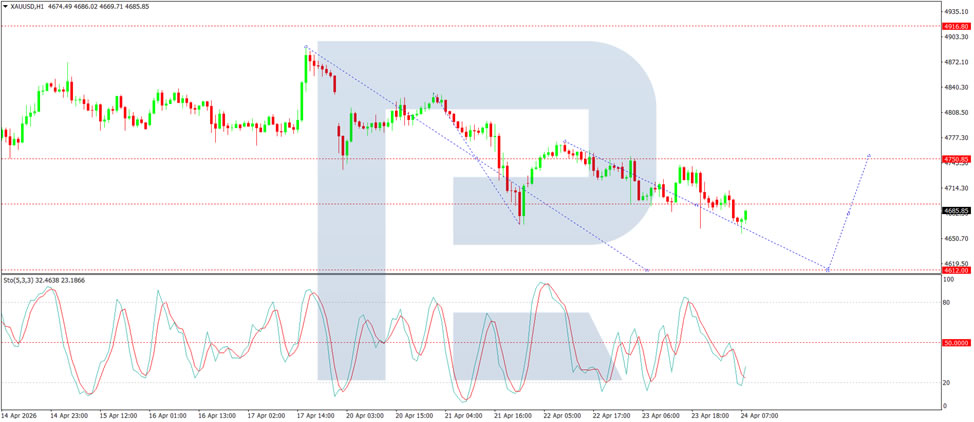
On the H1 chart, gold has broken below the 4,693 USD level and continues to move lower towards 4,616 USD. A corrective rebound towards 4,750 USD (testing from below) is likely, followed by a possible decline to 4,690 USD. The Stochastic oscillator supports this scenario, with its signal line below 50 and pointing firmly downwards towards 20.
Conclusion
Gold is poised to close the week nearly 3.0% lower amid ongoing geopolitical tensions between the US and Iran, which continue to dominate market sentiment. Both sides maintain their blockades of the Strait of Hormuz, while peace talks show little progress. President Trump's stance, ordering the Navy to destroy mines and board an Iranian oil tanker, has kept energy prices elevated and inflation concerns firmly in focus. Although truces with Iran and Lebanon have been prolonged, the lack of meaningful progress towards a resolution continues to weigh on gold. With central banks potentially leaning towards rate hikes amid persistent inflation, the non-yielding metal faces a challenging environment. Technical indicators suggest further downside towards 4,616 USD in the near term.
USD/CHF Price Analysis: Bulls Eye Key Resistance After Base Formation
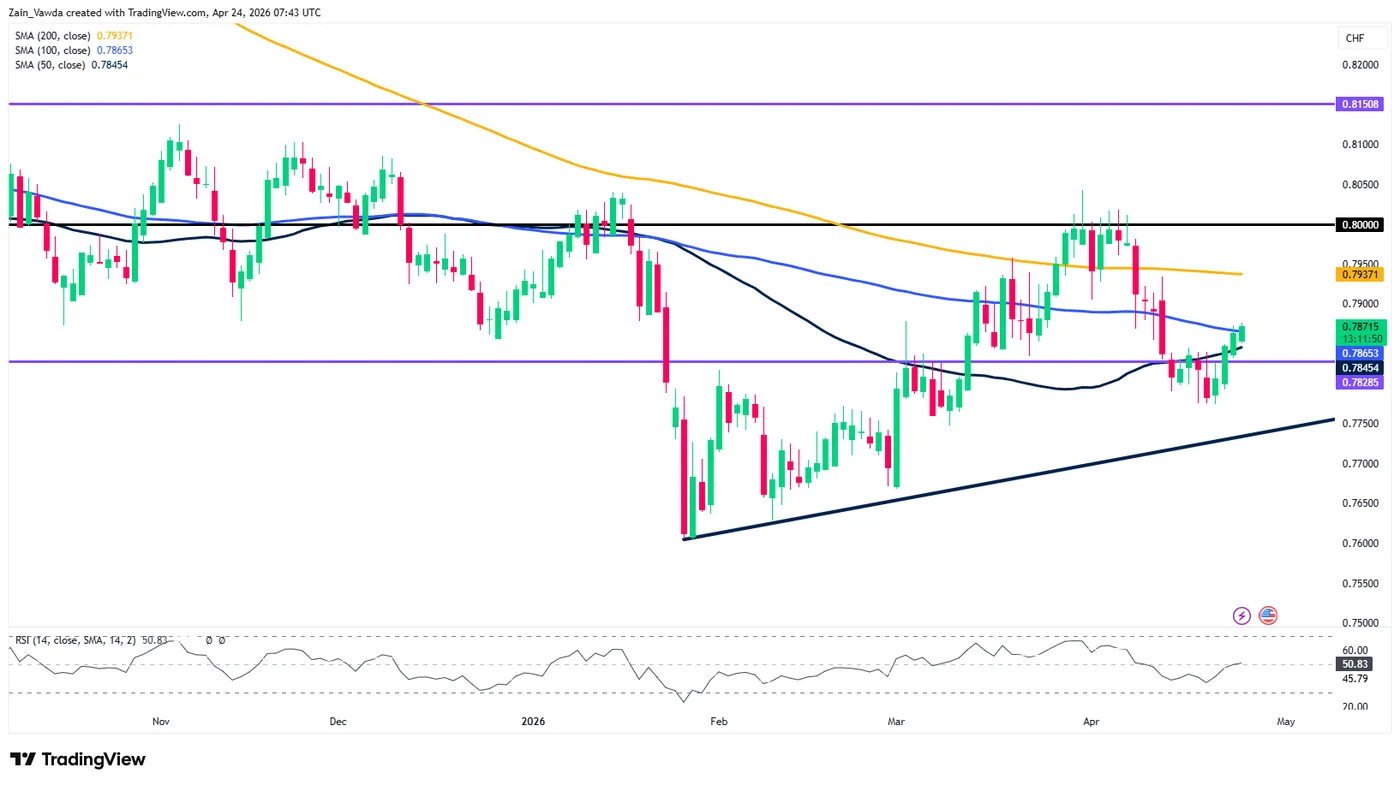
- On the daily chart, USD/CHF is in a recovery phase, currently sandwiched between the 50-day MA (0.7845) and 100-day MA (0.7865).
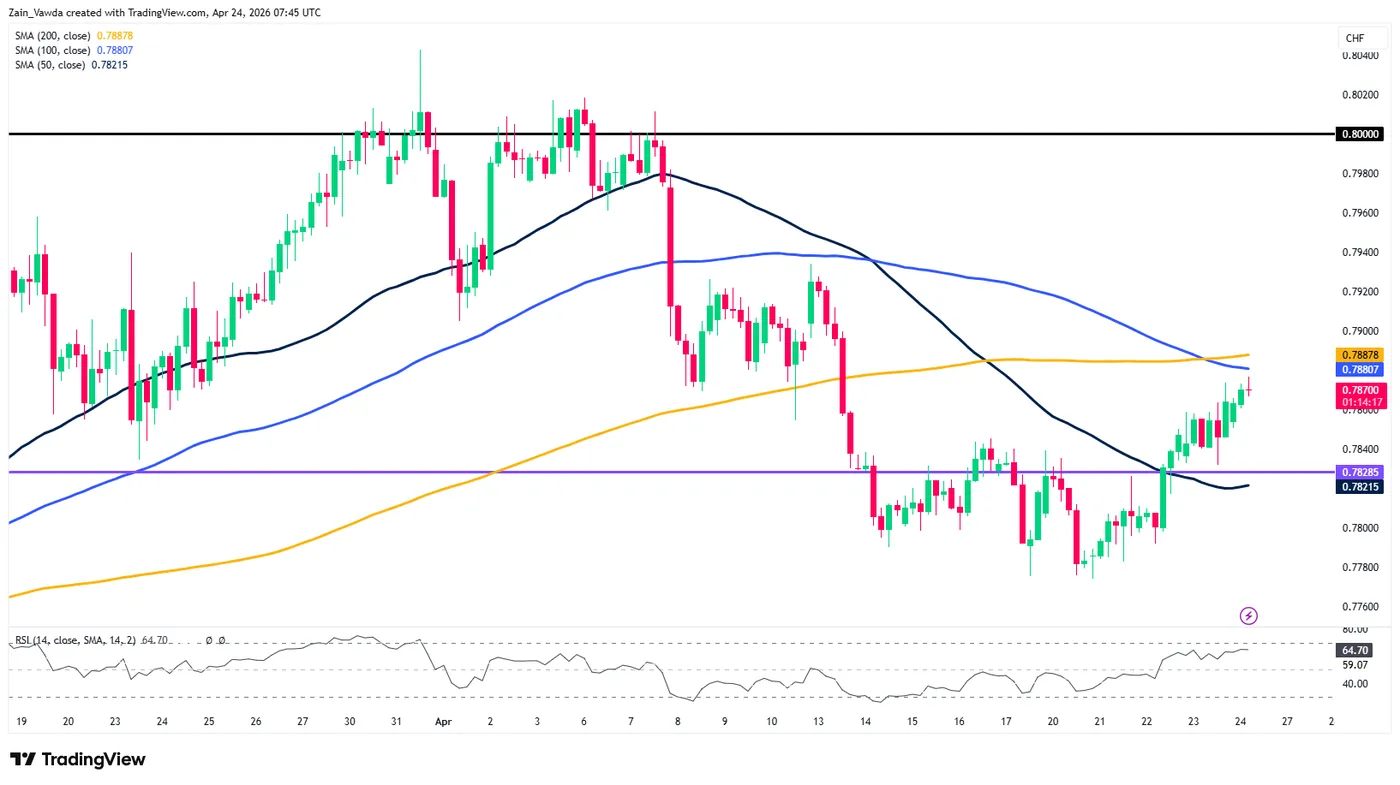
- The H4 chart shows a more defined bullish structure, featuring a "Golden Cross" (100-period MA above 200-period MA).
- Failure to hold above the 0.7846 short-term support would negate the bullish setup and likely lead to a retest of the 0.7828 support level.
USD/CHF Daily Chart: Building a Base Above Key Support
The daily timeframe shows USD/CHF in a recovery phase following the sharp sell-off witnessed in early 2026. After bottoming out near the 0.7600 handle, the pair has formed a series of higher lows, currently supported by an ascending trendline.
Price action is currently sandwiched between the 50-day MA (0.7845) and the 100-day MA (0.7865). A daily candle close above the 100-day MA would be a significant bullish signal, suggesting a shift in medium-term momentum.
However, the overhead 200-day MA at 0.7937 remains the "line in the sand" for bulls. Until that level is reclaimed, the overall daily structure remains cautious.
The RSI is hovering around the 50 midline, indicating a lack of clear directional conviction at this stage.
USD/CHF Daily Chart, April 24, 2026
Source: TradingView (click to enlarge)
H4 Chart: Testing the Golden Cross Zone
Moving down to the 4-hour chart, we see a more defined bullish structure. USD/CHF has successfully pushed above the 0.7828 horizontal support level, which previously acted as a ceiling during the consolidation in mid-April.
Notably, the H4 chart shows the 100-period MA crossing above the 200-period MA, often a precursor to sustained bullish momentum.
Price is currently testing the 200-period MA (0.7887). A sustained break above this level would open the door for a retest of the psychological 0.8000 resistance area. The RSI on this timeframe is rising toward 65.00, suggesting there is still room for further upside before reaching overbought conditions.
USD/CHF Four-Hour Chart, April 24, 2026
Source: TradingView (click to enlarge)
H1 Chart: Intra-day Scenarios and Key Levels
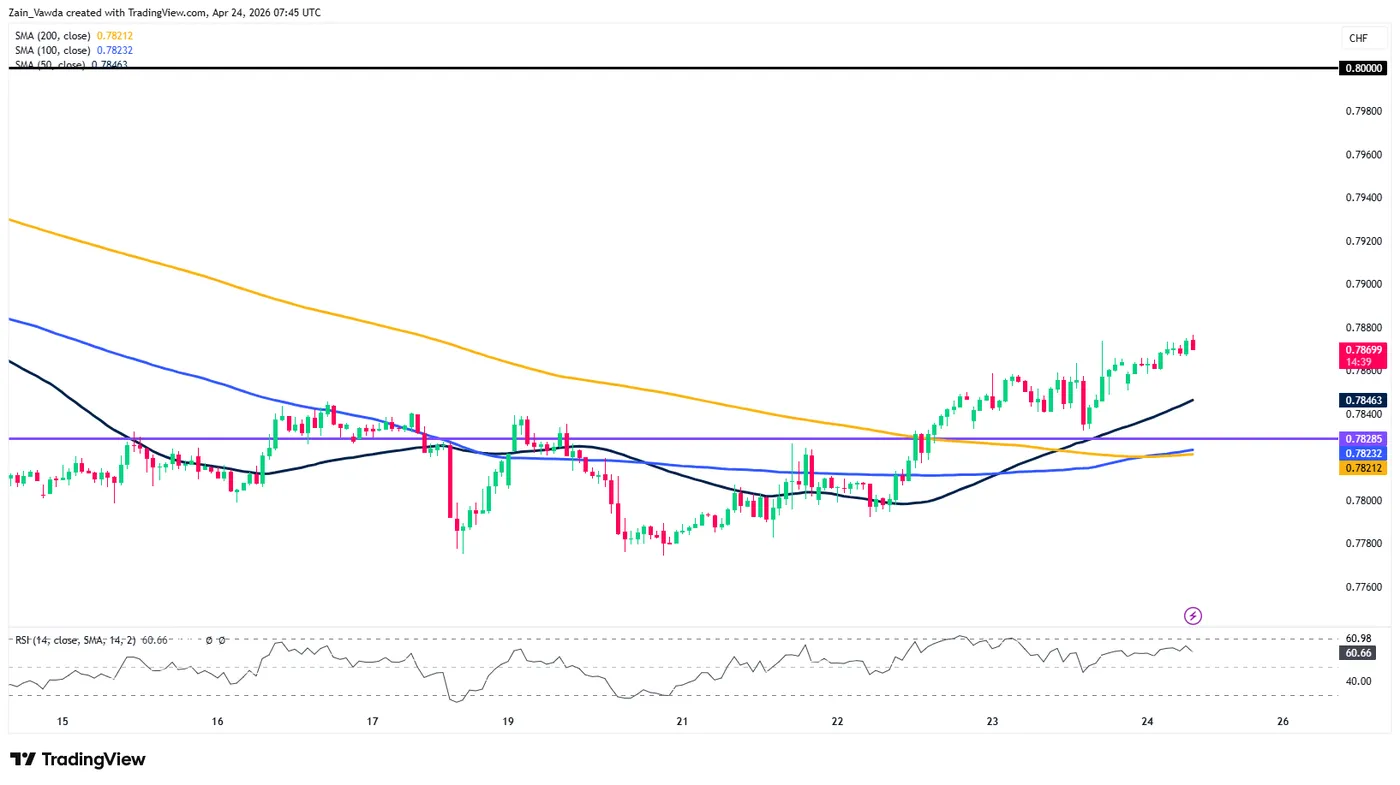
The 1-hour chart provides a granular view of the current breakout attempt. Price has found a foothold above all three major moving averages (50, 100, and 200), which are now beginning to fan out, supporting the bullish thesis.
Potential Bullish Scenario: If USD/CHF can maintain its position above the 0.7846 level (the recent swing high and current H1 support), bulls will likely target the 0.7887 (H4 200 MA) followed by the 0.7920 area. A clean break of 0.7920 would suggest a run toward the major psychological barrier at 0.8000. The path of least resistance currently appears to be to the upside, provided the 0.7840-0.7828 support zone holds.
Potential Bearish Scenario: Failure to clear the immediate overhead resistance near 0.7870/80 could result in a "bull trap." If the pair slips back below the 0.7846 mark, it would likely revisit the 0.7828 support level. A break below 0.7828 would negate the short-term bullish bias and could see the pair slide back toward the 0.7800 handle as sellers regain control.
Key Levels to Watch:
- Resistance: 0.7887, 0.7937, 0.8000
- Support: 0.7846, 0.7828, 0.7780
USD/CHF One-Hour Chart, April 24, 2026
Source: TradingView (click to enlarge)
USD/CHF is at a critical juncture. The daily chart shows a recovery in progress, while the lower timeframes suggest an imminent breakout. Traders should watch the 0.7887 level closely; a breakout here could ignite a fresh wave of buying interest heading into the weekend.
SNB’s Schlegel Flags Global Uncertainty from Middle East Conflict, Signals Policy Readiness
SNB Chair Martin Schlegel warned that the Middle East conflict is injecting significant uncertainty into the global economy, with rising energy prices set to push inflation higher in the months ahead. He noted that “the higher energy prices will lead to a further increase in inflation in many countries,” while also cautioning that global growth is likely to "slow temporarily".
Schlegel acknowledged that external shocks are beyond the control of the Swiss National Bank, stating that “the SNB cannot change the uncertain global environment.” However, he emphasized that policymakers remain focused on domestic stability and are capable of navigating these challenges.
He stressed that the SNB stands ready to act if needed, saying “we are prepared to adjust our monetary policy at any time.” Backed by institutional independence and a well-established framework, Schlegel expressed confidence that the central bank is “well equipped to ensure that we continue to fulfil our mandate”.
Germany Ifo Falls to 84.4 as Iran Crisis Hits Confidence
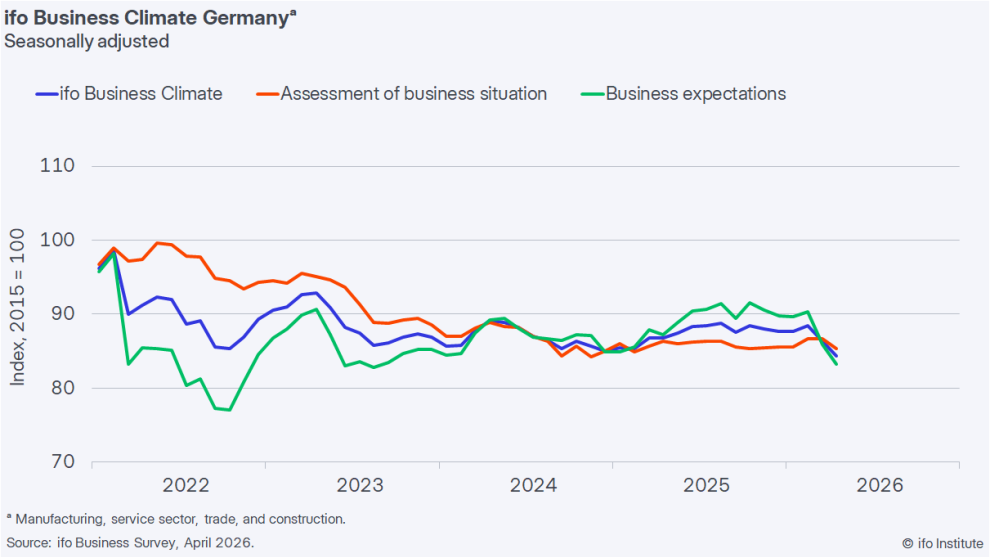
Germany’s business sentiment deteriorated sharply in April, with the Ifo Business Climate Index dropping from 86.3 to 84.4, the lowest level since May 2020. The decline reflects broad-based weakness, with both the Current Situation Index and Expectations Index falling to 85.4 and 83.3 respectively.
The drop in expectations signals growing concern over the economic outlook, as the impact of the Iran crisis feeds through rising energy costs and uncertainty. Services were hit the hardest, slipping deeper into negative territory, while manufacturing and trade showed modest improvements but remained firmly pessimistic overall.
The data underscores the vulnerability of Germany’s economy to external shocks, particularly energy disruptions. With sentiment deteriorating and expectations weakening further, the outlook points to a continued slowdown, reinforcing concerns that the Eurozone’s largest economy is being hit hard by the ongoing crisis.
| Indicator | Apr | Mar |
|---|---|---|
| Ifo Business Climate | 84.4 | 86.3 |
| Current Situation Index | 85.4 | 86.7 |
| Expectations Index | 83.3 | 85.9 |
| Manufacturing | -12.1 | -14.5 |
| Services | -2.6 | -2.1 |
| Trade | -21.1 | -24.7 |
| Construction | -14.3 | -14.8 |
| Overall Assessment | — | — |