Sample Category Title
Japan’s Core Inflation Rises to 1.8% in March, Core-Core Ticks Down
Japan’s inflation firmed slightly in March, but underlying dynamics were mixed. Core CPI (ex-fresh food) rose from 1.6% to 1.8% , slightly above expectations but still below the BoJ's 2% target for a second straight month.
Core-core CPI (excludes both fresh food and energy) ticked down from 2.5% to 2.4% , the lowest level since October 2025. Meanwhile, headline CPI ticked up from 1.3% to 1.5% .
A key factor behind the softer inflation profile is government intervention in energy prices. The abolition of the provisional gasoline tax at the end of last year and continued subsidy programs have helped contain fuel costs. Energy costs fell -5.7% , up from -9.1% . Gasoline down -5.4% , up from -14.9% .
Meanwhile, cost pressures are building at the corporate level. The corporate services price index rose from 2.7% to 3.1% , pointing to increasing input costs across the economy.
| Indicator | Mar | Feb |
|---|---|---|
| CPI Headline | 1.5% | 1.3% |
| CPI Core (ex-fresh food) | 1.8% | 1.6% |
| CPI Core-Core (ex-food & energy) | 2.4% | 2.5% |
| Energy Prices | -5.7% | -9.1% |
| Gasoline Prices | -5.4% | -14.9% |
| Corporate Services Price Index | 3.1% | 2.7% |
Cliff Notes: Middle East Conflict Seemingly at an Impasse
Key insights from the week that was.
Regarding the Middle East conflict, the week began with the expectation of a second round of in-person talks between the US and Iran. The start of the negotiations was initially pushed from Tuesday to Wednesday; but President Trump then announced on Truth Social that the meeting had been postponed at the request of Pakistani and Iranian officials to allow time for a "unified proposal" to be developed to be put to the US. Thankfully, having been stretched by both sides at the weekend, the expiring two-week ceasefire was extended indefinitely.
Since Wednesday, there has been no concrete evidence of progress towards a deal, the Iranians seemingly refusing to come to the table while the US’ blockade remains in place, and the US refusing to end the blockade until a deal is agreed. Both sides have halted and seized ships within their area of operations, but this has not triggered a ceasefire breach – although it must be noted that President Trump overnight ordered the US Navy to strike any vessel laying mines in the Strait of Hormuz, making clear the risk of further military conflict.
With no clear way out of the stalemate, or timeline for formal talks, the price of Brent oil has rebounded back to around USD106 having (very briefly) fallen as low as USD86 late last week. The longer the impasse persists, the greater the chance of a sustained period of high oil prices and refinery margins, with all costs eventually met by businesses and households across the world.
Central banks remain focused on the degree and persistence of price passthrough to domestic consumer inflation, the risk being that inflation persists well above target into 2027 on second-round effects and an uplift in inflation expectations. ECB President Lagarde this week noted that the staff currently view conditions in the Euro Area as between their baseline and adverse projections from the last meeting, and will act “as the situation demands” ahead. Next week’s run of central bank meetings across the northern hemisphere will provide a more detailed view on the balance of risks and the implications for monetary policy across the developed world.
In the US meanwhile, President Trump’s pick for the next FOMC Chair, Kevin Warsh, appeared before the Senate Banking Committee as part of the confirmation process. Warsh again made clear he believes several aspects of the FOMC’s communications and processes should change, but also showed a clear commitment to central bank independence. The next steps in Warsh’s confirmation remains highly uncertain, with Republican Senator Tillis refusing to approve the appointment at the Committee stage until the Department of Justice close their investigation into the Federal Reserve and Chair Powell. If Senator Tillis holds out until year end, the Administration may face an additional challenge in 2027 as their Senate majority is at risk in the mid-term election. Chair Powell will remain in place in the interim, giving the FOMC continuity and capacity to manage the US economy.
On data front this week, US retail sales rose 1.7% in March, beating expectations. The control group, which feeds into GDP, also surprised to the upside, 0.7%. For the quarter overall, however, the consumer pulse has been weak, and record-low confidence points to downside risks for Q2. The outlook for US business investment is also increasingly uncertain. Across the pond, the UK unemployment rate fell from 5.2% in January to 4.9% in February, though this reflected a decline in participation. Despite the softer labour market print, wages still rose 3.8%yr in February. A spike in energy prices also saw inflation rise 0.7% in March and 3.3% over the year. While the headlines focus on energy prices, sticky services inflation also remains an issue for the UK, 4.5%yr.
Our latest Market Outlook provides an in-depth view of the outlook for the US, Europe, China and global financial markets.
USD/JPY Edges Up, Can It Sustain Gradual Upside Trend?
Key Highlights
- USD/JPY regained traction and climbed above the 158.80 zone.
- It cleared a key bearish trend line with resistance at 159.35 on the 4-hour chart.
- EUR/USD started a downside correction and traded below 1.1750.
- GBP/USD started a consolidation phase below the 1.3550 pivot level.
USD/JPY Technical Analysis
The US Dollar remained supported above 158.40 against the Japanese Yen. USD/JPY started a fresh increase above the 158.80 and 159.00 levels.
Looking at the 4-hour chart, the pair settled above the 159.00 level, the 100 simple moving average (red, 4-hour), and the 200 simple moving average (green, 4-hour). Besides, the pair cleared a key bearish trend line with resistance at 159.35.
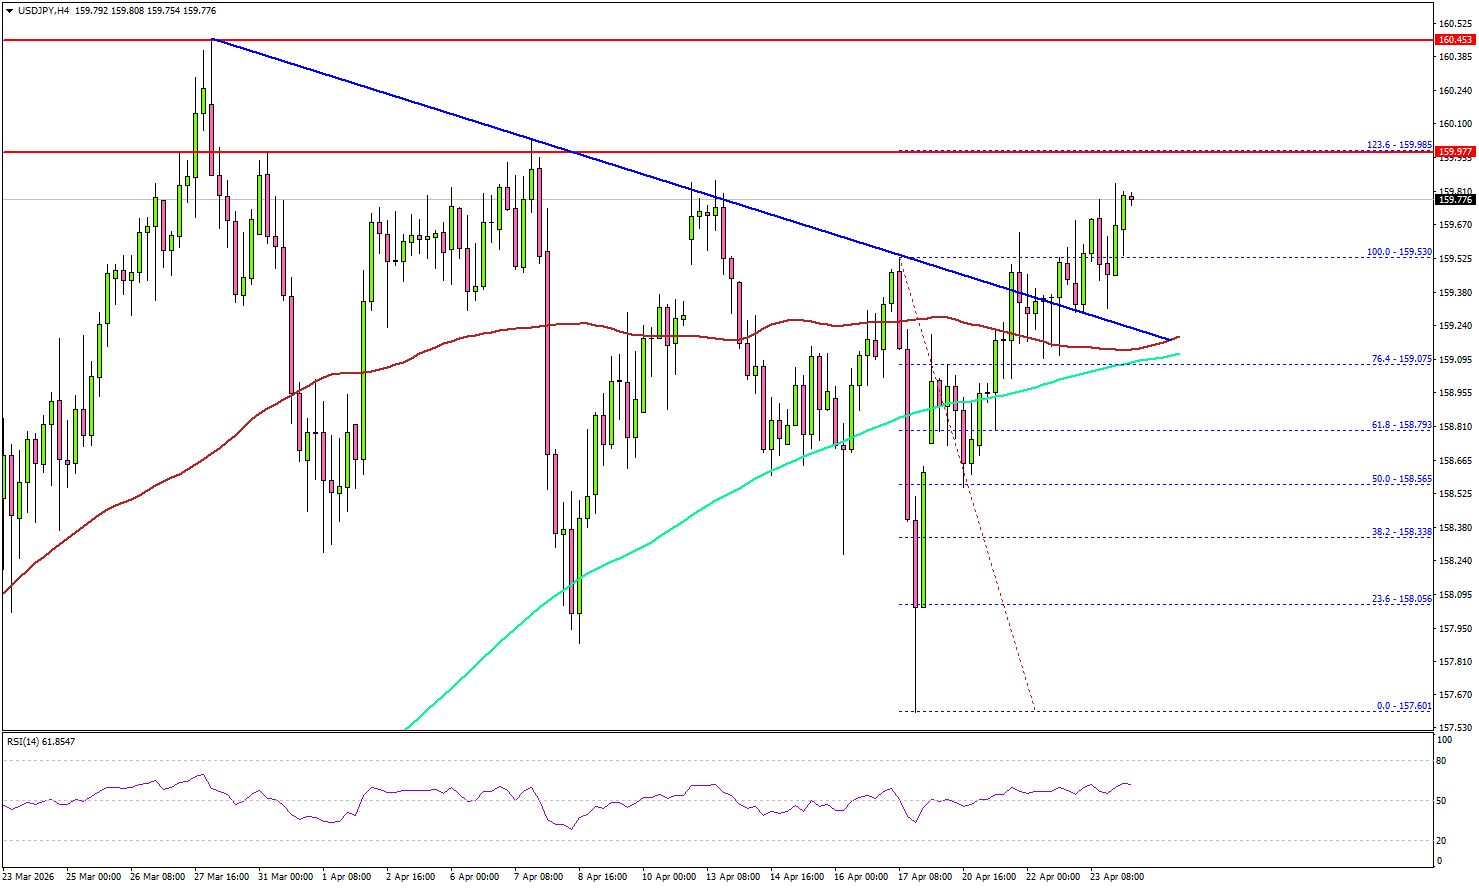
On the upside, the pair faces resistance at 160.00 or the 1.236 Fib extension level of the downward move from the 159.53 swing high to the 157.60 low.
The first major resistance sits at 160.20. The main resistance could be 160.50. A close above 160.50 could open doors for gains above 161.20. In the stated case, the bulls could aim for a move to 162.00.
Immediate support is seen near 159.20, the 100 simple moving average (red, 4-hour), and the 200 simple moving average (green, 4-hour). The next support could be 158.50. A close below 158.50 might push the pair toward 158.00. The main support sits at 157.60. Any more losses could initiate a fresh move to 155.00 in the coming days.
Looking at EUR/USD, the pair failed to extend gains and recently corrected lower below the 1.1750 support.
Upcoming Key Economic Events:
- Michigan Consumer Sentiment Index for April 2026 – Forecast 47.6, versus 47.6 previous.
Silver (XAG/USD) Under Pressure from Ceasefire Clouds – In-depth Analysis
Precious metals have been the victim of a severe reality check since late January.
Subjects of severe melt-ups since August 2025, following a slow but consistent grind higher from de-dollarization trends, the commodities got swept on all sides with extreme leverage and volatility.
And in Financial Markets, it rarely translates into anything good – Silver lost about 50% of its value in a flash crash during mid-February.
It has stalled its correction since, but the price action is still far from bullish.
Fast-forward to the beginning of the US-Iran War; A key narrative was the safe-haven appeal of the precious commodities, particularly gold, which has historically performed well during periods of tension.
But this safe-haven status was severely put in question during this conflict, as the asset class tumbled whenever Crude Oil and the US Dollar rallied, which were highly correlated with Stock Market movements.
With these Market dynamics, the question of whether metals aren't actually risk assets at current valuations is a logical one.
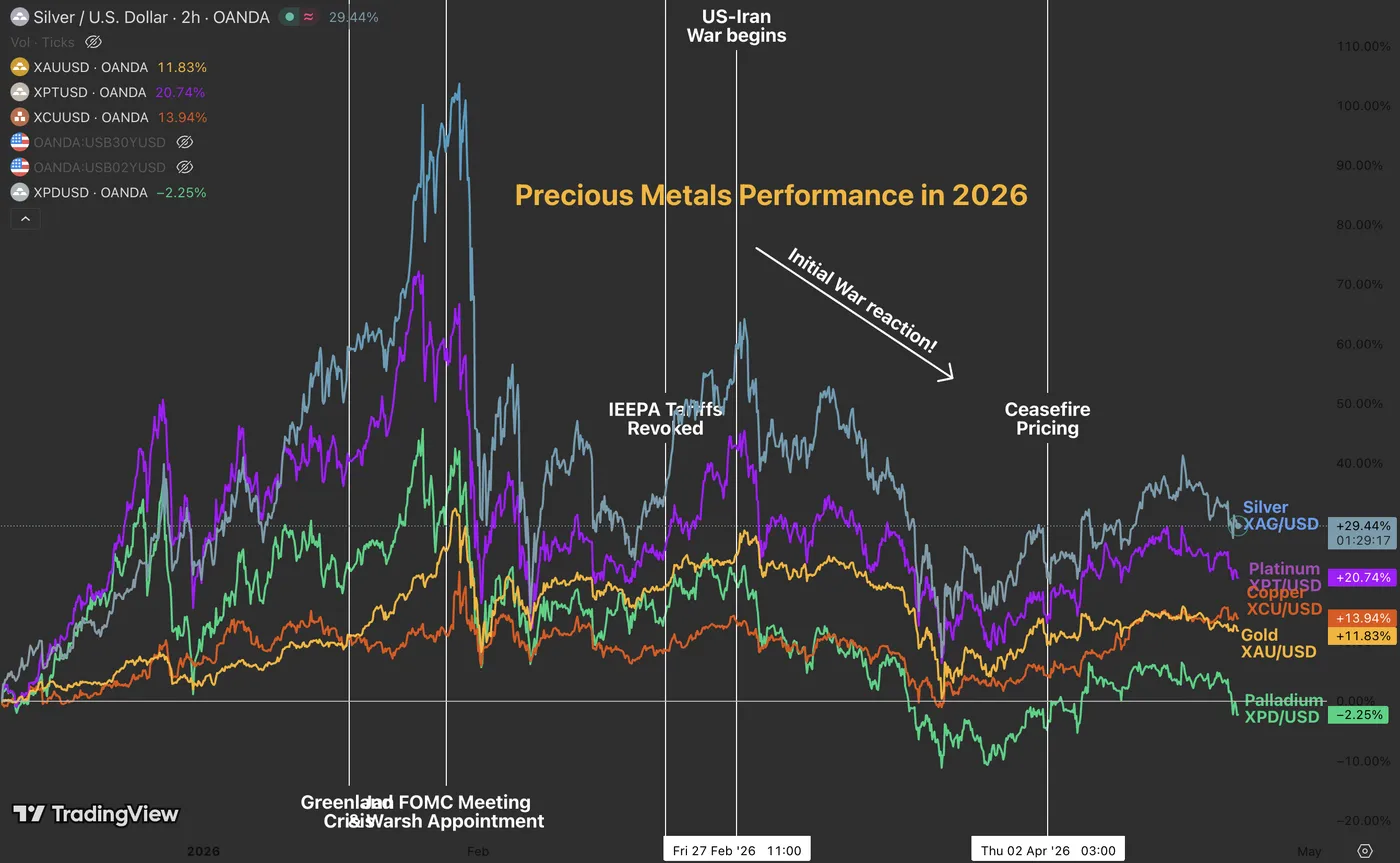
Metals performance since end 2025 – Source: TradingView. April 23, 2026
Still, Silver held relatively well, rebounding alongside other assets at the announcement of the Ceasefire and reaching +35% at its highs.
The issue, however, is that even with Equity benchmarks consolidating at all-time highs, the grey metal just isn't able to form a consistent uptrend. XAG just rejected its $84 resistance yet again, getting pressured by the cloudy peace narrative.
Will metals regain their safe-haven status in the event of a rebound in tensions?
Difficult to say for now – what is sure is that they faced high pressure from rising oil prices, so keep Black Gold in check if you want to trade the commodity.
We will dive into a Silver two-timeframe intraday analysis to prepare for a high-potential volatility event this coming weekend. Let's get right into it.
Silver (XAG/USD) Intraday timeframe Technical Analysis
4H Chart and Technical Levels
Silver 4H Chart, April 23, 2026 – Source: TradingView
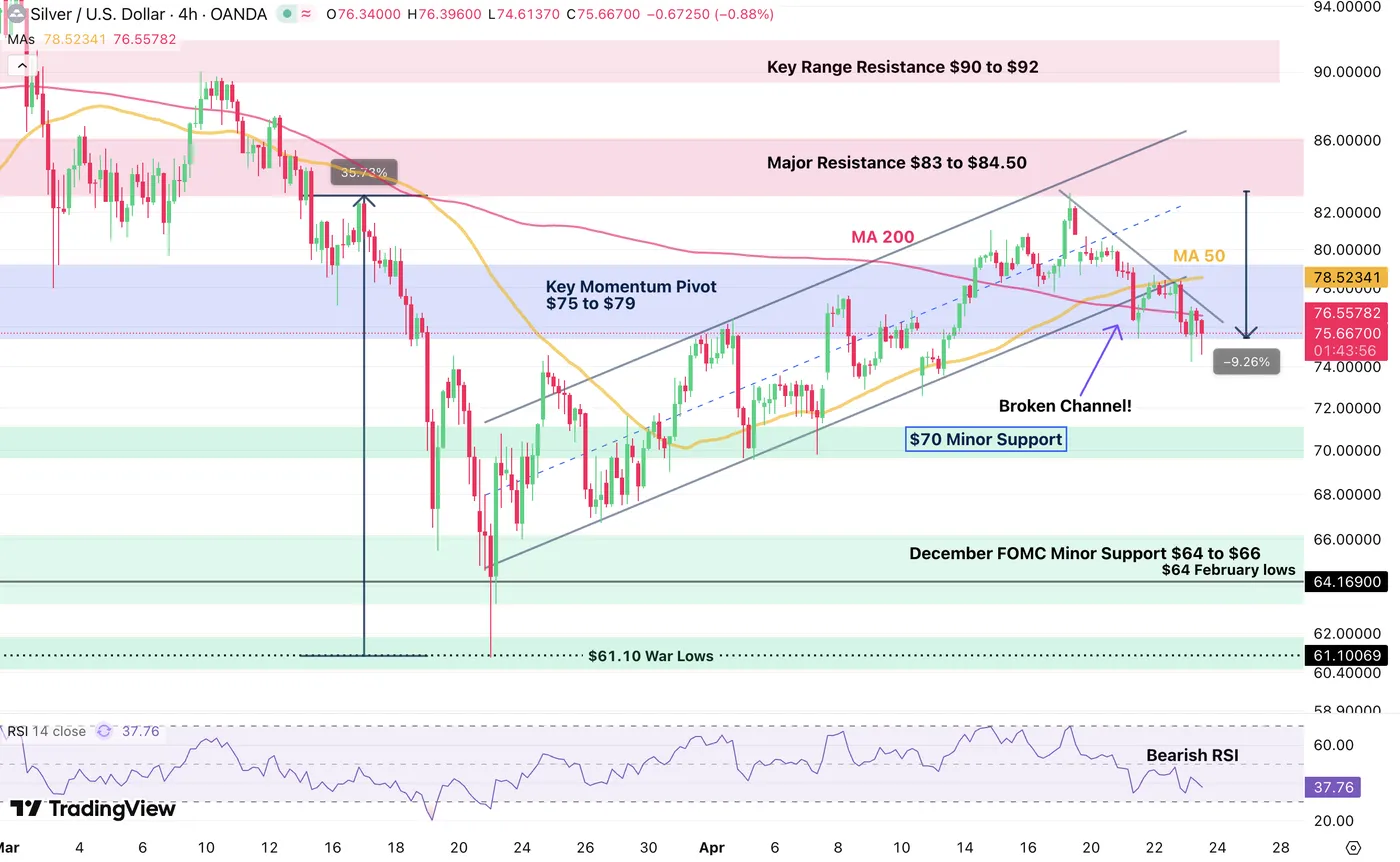
Silver retraced higher by 35% after reaching new $61 cycle lows during the war, but Participants used the rebound to take-profit on the dip.
The precious metal is down 9.30%, has officially broken and retested its recovery bull channel, which is not giving a good look for bulls.
Now testing the low of its major $75 Pivot point, there is an ongoing battel between short-term bulls and bears – To get a better idea of who will win on the short-run, we need to take a closer look.
Levels to watch for Silver (XAG) trading:
Resistance Levels:
- Major Resistance $83 to $84.50
- Friday highs $83
- Higher timeframe Range Resistance $90 to $92
- $96.47 March highs
Support Levels:
- Pivot lows $74.50 - $75
- $70 Minor Support
- December FOMC Minor Support $60 to $64 (Feb Lows)
- $61.10 War Lows
- $50 to $54 Major Support
1H Chart
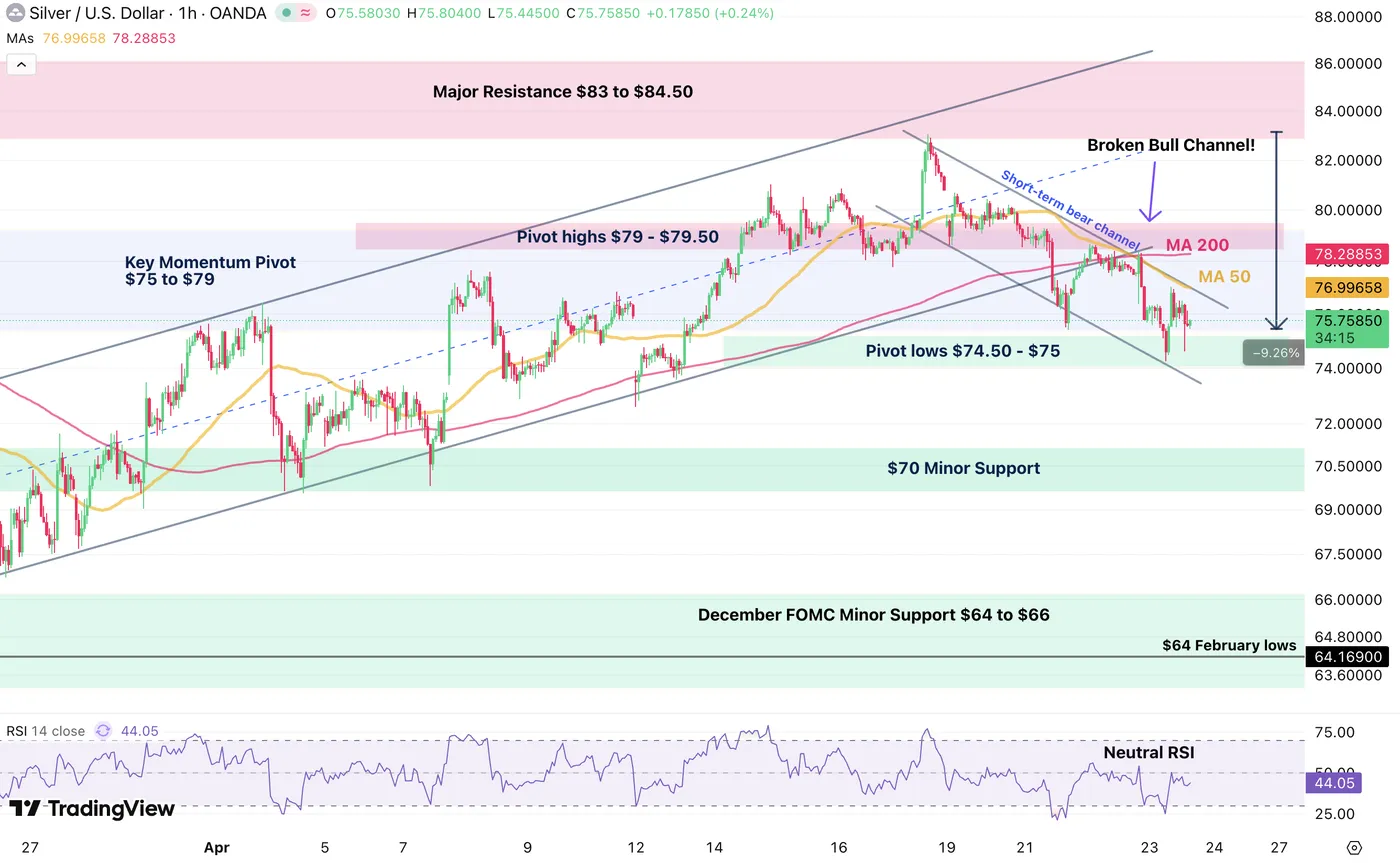
Silver 1H Chart, April 23, 2026 – Source: TradingView
Bears took the back control of the action since last Friday, forming a counter-trend bear channel which remains key to short-term trading.
However, bulls are defending the Pivot Zone lows ($74.50 to $75) and will went to use this move to break above the 50-Hour MA ($77), acting as key area for sellers since the turn lower.
Above this, the next short term resistance is at $79.
A range could easily establish in this Pivot zone as long as the geopolitical situation remains cloudy.
Breakout traders should watch for pushes above or below these key intraday levels.
Safe Trades!
Gold (XAU/USD) Technical Analysis: Bulls Defend $4700 Support. Is a Break above $4750 on the Way?
- The price is consolidating tightly between the crucial $4,700 support and the $4,750 resistance level.
- Price action is consolidating around key structural levels, suggesting a breakout from the $4,700–$4,750 range is imminent and will dictate the direction for the rest of the week.
- Bullish/Bearish Triggers: A sustained break above $4,804 signals the end of the corrective phase, while a decisive hourly close below $4,700 could trigger a sell-off toward $4,601.
Gold has experienced a period of significant uncertainty this week as tensions in the Middle East remain on a knife edge. As we head into the upcoming sessions, price action is consolidating around key structural levels, suggesting a breakout may be imminent. Will traders commit without a resolution in the Middle East?
Daily Chart: Long-Term Bullish Structure Remains Intact
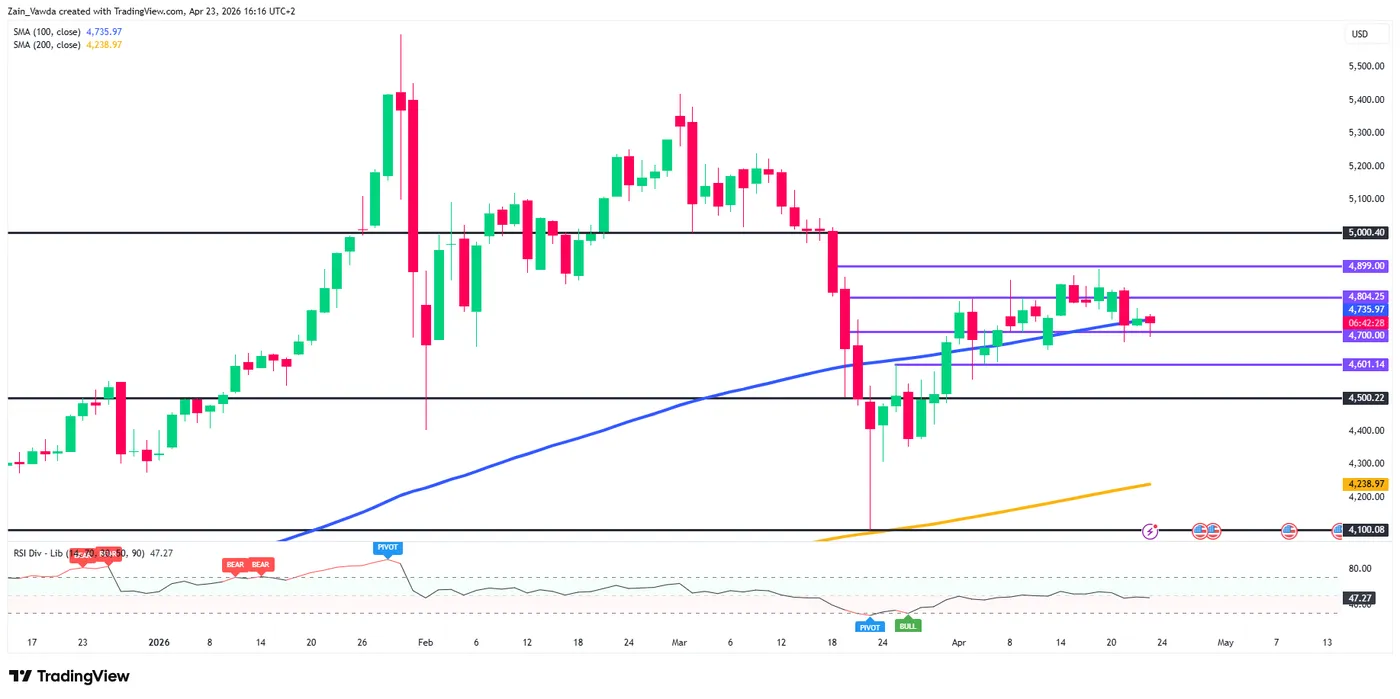
Looking at the Daily timeframe, Gold remains in a primary uptrend, supported by its position well above the 200-day Simple Moving Average (MA) currently sitting at $4238. However, the recent price action shows a significant cooling off from the $5,400 peaks.
The $4,700 level has emerged as a crucial floor for the bulls. This level previously acted as resistance and has now flipped to support, reinforced by the 100-day MA (blue line) which is currently tracking just above $4735. The RSI is hovering near the 47 mark, indicating a neutral momentum phase, neither overbought nor oversold, giving the metal plenty of room to move in either direction without immediate exhaustion.
Gold (XAU/USD) Daily Chart, April 23, 2026
Source: TradingView
H4 Chart: Falling Wedge or Bearish Continuation?
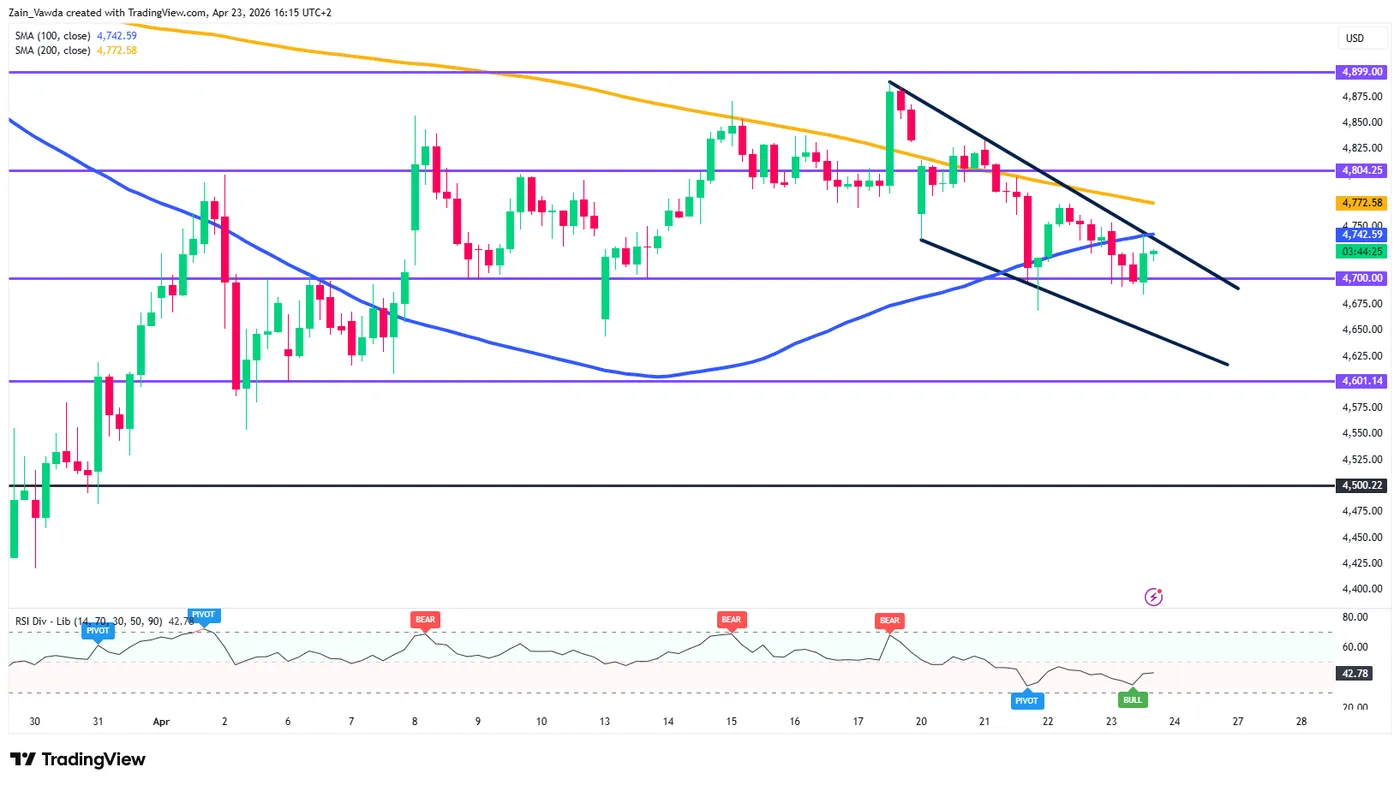
Moving down to the 4-hour chart, the picture becomes more nuanced. Price is currently oscillating within a descending channel or a large "falling wedge" pattern.
While traditionally a bullish reversal pattern, the H4 chart shows Gold struggling to reclaim the 100 and 200 MAs.
The immediate hurdle for bulls is the $4804 resistance zone. A sustained break above this level and the upper boundary of the descending channel would be the first major signal that the corrective phase is over and the broader uptrend is resuming.
Gold (XAU/USD) Four-Hour Chart, April 23, 2026
Source: TradingView
H1 Chart: Intra-day Scenarios and Key Levels
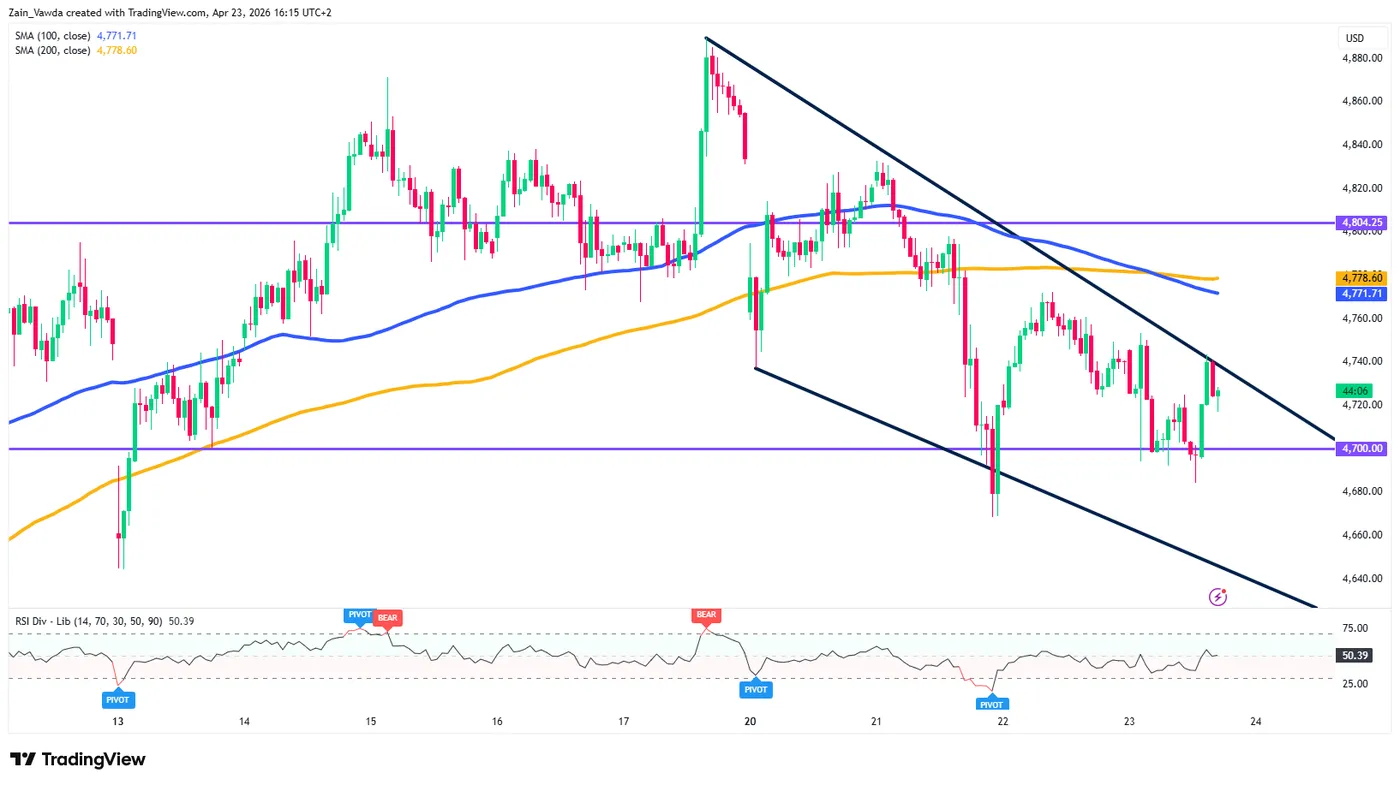
The 1-hour chart provides a clearer view of the immediate battleground. We are seeing a tight consolidation between the $4700 support and the $4750 resistance area.
Bullish Scenario: For a bullish move to materialize in the upcoming sessions, buyers need to clear the immediate intraday resistance at $4750.
A break above the descending trendline on this timeframe would open the door for a retest of $4772 (200 MA) and eventually the major psychological barrier at $4800. A "Bull" signal on the RSI Divergence indicator suggests that downward momentum is fading, supporting a potential bounce.
Bearish Scenario: On the flip side, the bears remain in control of the short-term trend. If Gold fails to break above the H1 descending trendline, a retest of the $4700 support is likely.
A decisive hourly close below $4,700 would be a significant technical blow, potentially triggering a sell-off toward the next structural support at $4601.
Gold (XAU/USD) One-Hour Chart, April 23, 2026
Source: TradingView
Key Levels to Watch:
- Resistance: $4750, $4804, $4899
- Support: $4700, $4601, $4500
Gold is at a crossroads. The daily trend remains bullish, but the intraday charts show a market looking for a catalyst. Traders should watch the $4700 – $4750 range closely. A breakout on either side of this corridor will likely dictate the direction for the remainder of the week.
Nikkei 225 Wave Analysis
Nikkei 225: ⬇️ Sell
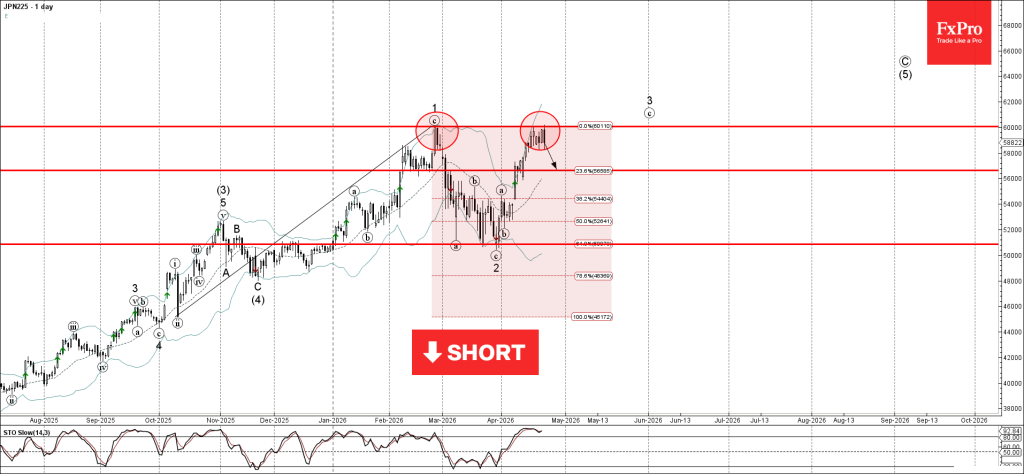
- Nikkei 225 reversed from resistance level 60000.00
- Likely to fall to support level 56645.00
Nikkei 225 index recently reversed down from the resistance zone between the key round resistance level 60000.00 (which stopped wave 1 in February) and the upper daily Bollinger Band.
The downward reversal from this resistance zone stopped the previous sharp minor impulse wave 3.
Given the strength of the resistance level 60000.00 and the overbought daily Stochastic, Nikkei 225 index can be expected to fall to the next support level 56645.00.
Eco Data 4/24/26
| GMT | Ccy | Events | Act | Cons | Prev | Rev |
|---|---|---|---|---|---|---|
| 23:01 | GBP | GfK Consumer Confidence Apr | -25 | -25 | -21 | |
| 23:30 | JPY | National CPI Y/Y Mar | 1.50% | 1.30% | ||
| 23:30 | JPY | National CPI Core Y/Y Mar | 1.80% | 1.70% | 1.60% | |
| 23:30 | JPY | National CPI Core-Core Y/Y Mar | 2.40% | 2.50% | ||
| 23:50 | JPY | Corporate Service Price Index Y/Y Mar | 3.10% | 2.90% | 2.70% | |
| 06:00 | GBP | Retail Sales M/M Mar | 0.70% | 0.20% | -0.40% | -0.60% |
| 08:00 | EUR | Germany IFO Business Climate Apr | 84.4 | 85.6 | 86.4 | 86.3 |
| 08:00 | EUR | Germany IFO Current Assessment Apr | 85.4 | 85.5 | 86.7 | |
| 08:00 | EUR | Germany IFO Expectations Apr | 83.3 | 83.9 | 86 | 85.9 |
| 12:30 | CAD | Retail Sales M/M Feb | 0.70% | 0.90% | 1.10% | 1.20% |
| 12:30 | CAD | Retail Sales ex Autos M/M Feb | 0.50% | 0.80% | 0.80% | 1.00% |
| 14:00 | USD | UoM Consumer Sentiment Apr F | 49.8 | 47.6 | 47.6 | |
| 14:00 | USD | UoM 1-Yr Inflation Expectations Apr F | 4.70% | 4.80% | 4.80% |
| 23:01 | GBP |
| GfK Consumer Confidence Apr | |
| Actual | -25 |
| Consensus | -25 |
| Previous | -21 |
| 23:30 | JPY |
| National CPI Y/Y Mar | |
| Actual | 1.50% |
| Consensus | |
| Previous | 1.30% |
| 23:30 | JPY |
| National CPI Core Y/Y Mar | |
| Actual | 1.80% |
| Consensus | 1.70% |
| Previous | 1.60% |
| 23:30 | JPY |
| National CPI Core-Core Y/Y Mar | |
| Actual | 2.40% |
| Consensus | |
| Previous | 2.50% |
| 23:50 | JPY |
| Corporate Service Price Index Y/Y Mar | |
| Actual | 3.10% |
| Consensus | 2.90% |
| Previous | 2.70% |
| 06:00 | GBP |
| Retail Sales M/M Mar | |
| Actual | 0.70% |
| Consensus | 0.20% |
| Previous | -0.40% |
| Revised | -0.60% |
| 08:00 | EUR |
| Germany IFO Business Climate Apr | |
| Actual | 84.4 |
| Consensus | 85.6 |
| Previous | 86.4 |
| Revised | 86.3 |
| 08:00 | EUR |
| Germany IFO Current Assessment Apr | |
| Actual | 85.4 |
| Consensus | 85.5 |
| Previous | 86.7 |
| 08:00 | EUR |
| Germany IFO Expectations Apr | |
| Actual | 83.3 |
| Consensus | 83.9 |
| Previous | 86 |
| Revised | 85.9 |
| 12:30 | CAD |
| Retail Sales M/M Feb | |
| Actual | 0.70% |
| Consensus | 0.90% |
| Previous | 1.10% |
| Revised | 1.20% |
| 12:30 | CAD |
| Retail Sales ex Autos M/M Feb | |
| Actual | 0.50% |
| Consensus | 0.80% |
| Previous | 0.80% |
| Revised | 1.00% |
| 14:00 | USD |
| UoM Consumer Sentiment Apr F | |
| Actual | 49.8 |
| Consensus | 47.6 |
| Previous | 47.6 |
| 14:00 | USD |
| UoM 1-Yr Inflation Expectations Apr F | |
| Actual | 4.70% |
| Consensus | 4.80% |
| Previous | 4.80% |
USD/JPY Maintains a Clear Range Ahead of Japanese CPI – FX Analysis
USD/JPY is often playing tricks on FX traders, and this time it is completely avoiding volatility after gigantic up-and-down moves.
The Currency pair is known for its erratic price action, highly affected by movements in rates, global trade, and inflation, as well as regional and geopolitical developments, all of which have been severely affected since the beginning of the US-Iran conflict.
Seen as a major safe-haven currency since the early 2000s, profiting from lower yields in times of panic, the JPY could not find any appeal during this conflict.
Even as stock markets initially sold off, risk-off assets and currencies failed to gain traction, with the US Dollar and WTI Crude drawing all the attention.
Believing the conflict would stay focused on the Middle East, a wider flight to safety was avoided.
But the economic damage to Europe, and in the case of today's USD/JPY outlook, Japan and Asia, is still heavy, and that led to massive rallies in the US Dollar against currencies from these regions.
You can see the strong correlation between USD/JPY and Oil movements in our recent analysis of the pair.
Add to this narrative a striking stall in inflation in Japan, which was the only path to justify a return to less accommodative policy, and Traders really found a natural terrain to race back to Japan shorts.
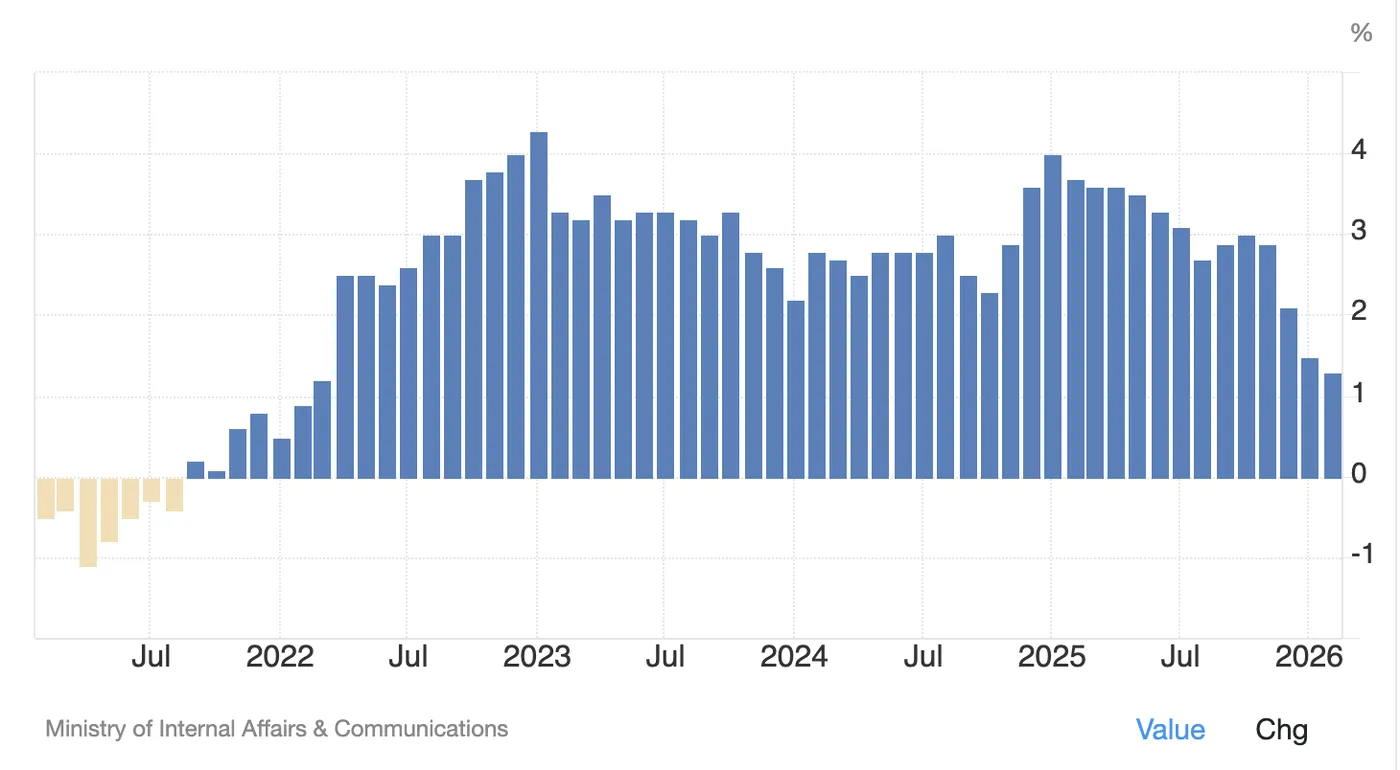
Recent Japanese CPI data – Courtesy of Trading Economics
The Japanese CPI, releasing tonight at 19:30 (ET), is expected to rebound, as supply-side inflationary pressures could once again slowly push Japanese consumer prices higher.
The Bank of Japan mentioned conflict-led inflation a few times but reportedly still leans toward a pause at the upcoming meeting, while hinting at a higher chance of a 25 bps hike in June to allow for further analysis of the war's impact.
So, unless CPI beats expectations by a lot, this pricing shouldn't change much.
With the second round of talks, delayed for almost a week and a half, set to resume tomorrow and continue throughout the weekend, this will be a decisive moment for the FX pair.
Forming a clear 2,000 pip hesitation range in recent action, traders are waiting to see if a proper peace solution is met (implying a break lower in the range) or if the war is to resume, which would add further chances to revisit 2026 highs (above 160.00).
Let's dive right into an intraday-timeframe analysis for the Gopher – more commonly named, USD/JPY.
USD/JPY Multi-Timeframe Analysis
4H Chart
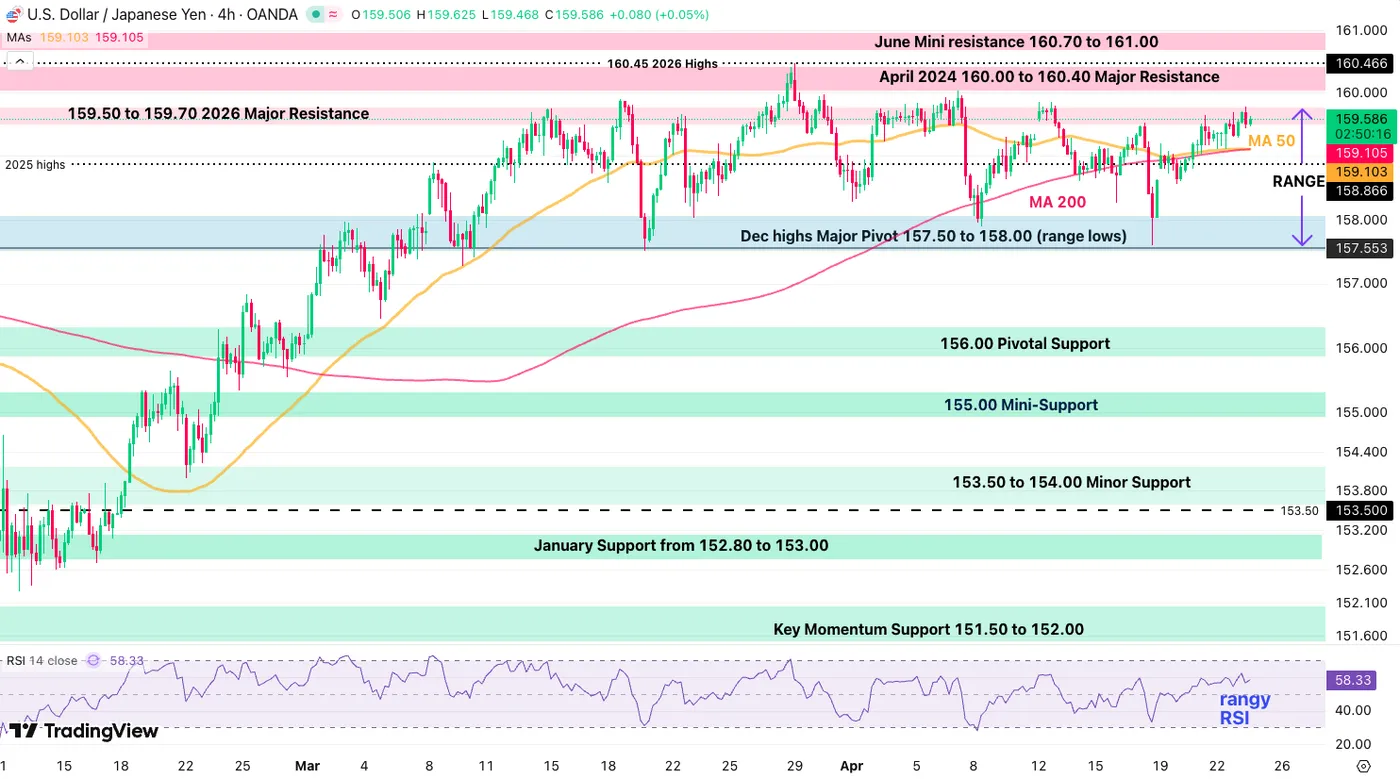
USD/JPY 4H Chart. April 23, 2026 – Source: TradingView
Instead of entering a corrective phase, as was forecasted by the break below key MAs and bull channel, USD/JPY maintained a clearly rangebound picture as the US Dollar completely stalled its correction.
Since reaching new 2026 highs on March 27, the pair has been stuck in a clear 2,000 pip range between 157.50 and 159.50 (+/- 100 pips).
While the consolidation is solid, as seen with the flattening 50 and 200 Moving Averages, traders will have to remain cautious as the narrative could change during the weekend.
Currently at the resistance, USD/JPY has more chances to reject lower, but any headlines regarding a compromised peace process would push for a breakout towards 160.50.
Let's take a closer look.
1H Chart and Technical Levels
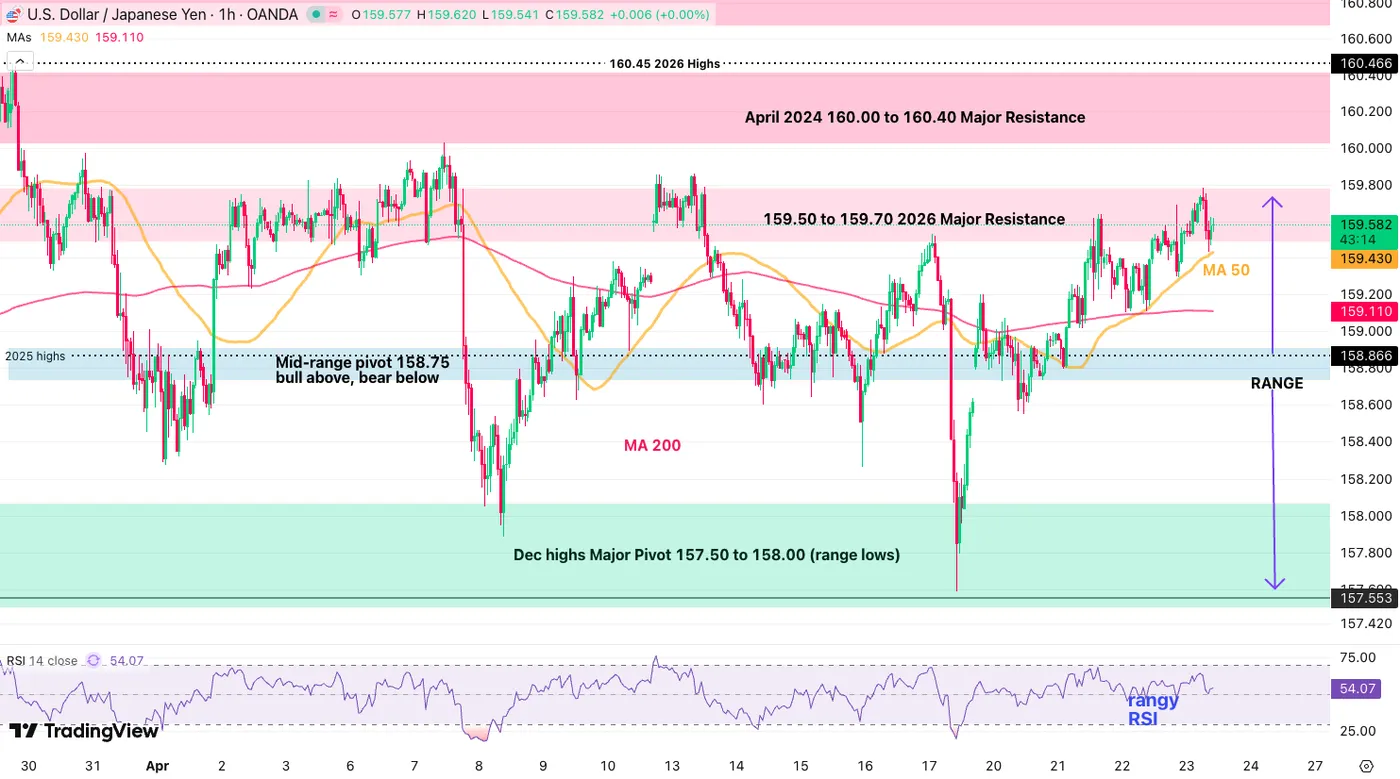
USD/JPY 1H Chart. April 23, 2026 – Source: TradingView
As can be seen on the 1H timeframe, the range has seen swift up-and-down movement, tumbling to support last Friday and exploding back to retest resistance.
With today's North American session not expected to provide any meaningful change, traders should remain patient.
If the CPI data comes hotter, expect to see a drop below 159.43 (50-Hour MA) which could provide decent sell-stop entries – Extending below 158.80 should see bearish acceleration.
- Watch out if the action breaks 159.80
- The weekend break will provide high volatility movement on Monday, so watch your size ahead of the key developments.
Resistance levels
- 159.50 to 159.70 2026 Major Resistance (range highs)
- 159.78 daily highs
- April 2024 160.00 to 160.40 Major Resistance
- June Mini resistance 160.70 to 161.00
Support levels
- 159.43 (50-Hour MA)
- Mid-range pivot 158.75 bull above, bear below
- December highs Major Pivot 157.50 to 158.00 (range lows)
- 156.00 Pivotal Support
- 155.00 Mini-Support
Safe Trades!
Sunset Market Commentary
Markets
It’s a hard time these days for (economic) analysts and central bankers alike. Their assessment on the current state and the outlook for the economy is conditional to the (until now) unpredictable extent and outcome of the conflict in the Middle East. Hard data often/mostly are outdated at the time of publication. The monthly PMI surveys (and ISM’s in the US) in this context probably provide one of the better, more or less timely pointers on the reaction of a key group of economic agents, the purchasing managers. The outcome of the April EMU PMI was ‘as feared’. The EMU economy is heading toward stagflation. First, the ‘least worse part of the story’. The overall composite PMI declined more than expected from 50.7 to 48.6, the first sub-50 reading, separating growth from contraction, since December 2024, due to a sharp contraction in activity in the (mostly domestic) services sector (47.7). S&P global analyses that the decline in output was broad-based across the region. Interestingly (surprisingly?), activity in the manufacturing sector even improved (52.2 from 51.6, best level in 47 months). However, there is a ‘but’. ‘Some of the upturn reflected reports of customers seeking to secure purchases amid concerns over price rises and supply shortages’. In this respect, manufacturers also see suppliers' delivery times lengthen to the greatest extent since mid-2022. S&P calculated that the decline signals a 0.1% quarterly rate of GDP contraction at the start of Q2. For now the negative impact on employment was limited. Still, overall confidence on the year-ahead outlook, still at a 21 month high in February, in April dropped to lowest since end 2022. The picture regarding growth was far from inspiring. The story on prices is even more worrisome. Both input costs and output prices are rising at the sharpest rates in more than three years. S&P even sees the biggest surge in cost pressures since 2000 if one excludes Covid pandemic era. The rise in costs is also not only due to higher energy prices, but due a wider rise in commodity prices and a growing supply-demand mismatch.
The ‘one million dollar question’ of course is what this means of ECB policy. EMU yields this morning initially added a few bps with Brent oil north of the $100 barrier also adding to the inflationary woes, but for now there is no follow-through price action. EMU swap yields are little changed in a daily perspective. Even so, after reducing ECB rate hike expectations to 1 ½ 25 bps steps by year end on Friday, EMU money markets currently again see a near 90% chance of a June rate hike and more than one additional step by year end. US yields show similar small ‘changes’. US weekly jobless claims rose a slightly higher than expected 214k, but remain at a benign level. The US manufacturing PMI released at the time of finishing this report even improved (composite 52 from 50.3), but with little market impact. After recent rally, gains in (US) equities stall as headlines on the Iran conflict remains highly confusing (S&P 500 and Eurostoxx 50 ceding 0.1%). The dollar ‘enjoys’ a (still modest) safe haven bid (DXY 98.7, EUR/USD 1.169, USD/JPY 159.55).
News & Views
UK activity rose in April with the composite PMI improving to a two-month high of 52, corresponding with a 0.2% quarterly growth rate. This upturn, however, comes with a catch, S&P Global said. It’s reflecting in part a rush to secure purchases ahead of price rises and already-present supply shortages linked to the Iran war. This was most visible in the manufacturing gauge (53.6, 47-month high) but also in services (52, two-month high). Advanced purchasing temporarily lifted industrial orders books while services providers reported fragile demand conditions due to business uncertainty, higher inflationary pressures (transportation costs) and elevated borrowing costs. S&P said these survey details “hint strongly that this [growth] pace cannot be sustained should the crisis persist.” Private sector employment numbers decreased for the 19th month running, be it at the slowest pace since October 2025. Price pressures are strong with manufacturers recording a steep increase in their input prices. Services companies have seen input costs rise at the fastest pace since the survey begin almost 30 years ago on greater fuel costs and wages. This resulted in the sharpest output price increase since February 2023 with both sectors contributing. Optimism for the year ahead fell to its second-weakest since December 2022 on these increasing cost burdens. Despite this ‘better performance’ compared to EMU, UK gilts underperform Bunds with yields rising 1.0 (5-y)-3.5 (30-y) bps. Recent sterling outperformance against the euro slows (EUR/GBP little changed near 0.8665).
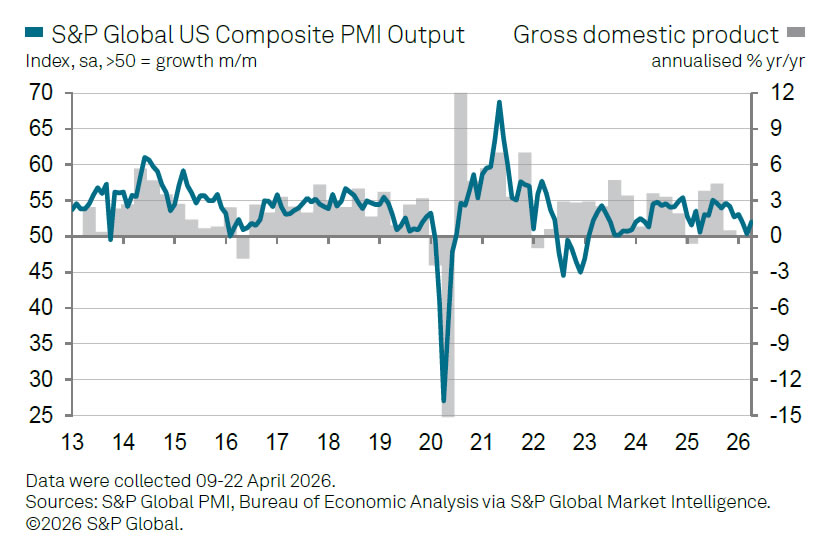
US PMI Signals Sub-1% GDP Growth as Inflation Pressures Intensify
US business activity picked up in April, with the Flash Composite PMI rising from 50.3 to 52.0, a three-month high. The improvement suggests the economy regained some momentum after near-stagnation in March, though the overall pace remains modest. The data is broadly consistent with the economy struggling to sustain annualized growth much above 1%, with the vast services sector acting as the principal drag despite a return to expansion.
Manufacturing led the economy. PMI rose from 52.3 to 54.0, while output jumped from 53.2 to 55.7, the strongest in four years. However, much of the strength appears precautionary. Firms reported “panic” and “emergency” buying of inputs, building inventories ahead of expected supply disruptions and price increases linked to the Middle East conflict and ongoing tariff pressures.
The services sector, by contrast, remains subdued. PMI edged up from 49.8 to 51.3, but demand growth is weak, with hesitancy in spending across travel, finance, and other services. Higher prices and the prospect of tighter financial conditions are acting as a drag on activity, keeping overall growth modest.
At the same time, inflation pressures are accelerating sharply. Input costs and output prices rose at the fastest pace since mid-2022, driven by energy, commodities, and rising wages.
| Indicator | Apr | Mar |
|---|---|---|
| PMI Composite | 52.0 | 50.3 |
| PMI Services | 51.3 | 49.8 |
| PMI Manufacturing | 54.0 | 52.3 |
| Manufacturing Output | 55.7 | 53.2 |