Sample Category Title
AUD/USD Daily Report
Daily Pivots: (S1) 0.7104; (P) 0.7136; (R1) 0.7160; More...
No change in AUD/USD's outlook. Intraday bias stays neutral, and more consolidations would be seen below 0.7221 temporary top. In case of deeper retreat, downside should be contained above 0.7000 support to bring rebound. On the upside, above 0.7221 will extend the larger up trend to 61.8% projection of 0.6420 to 0.7187 from 0.6832 at 0.7306. However, break of 0.7000 will bring deeper fall back to 0.6832 support instead.
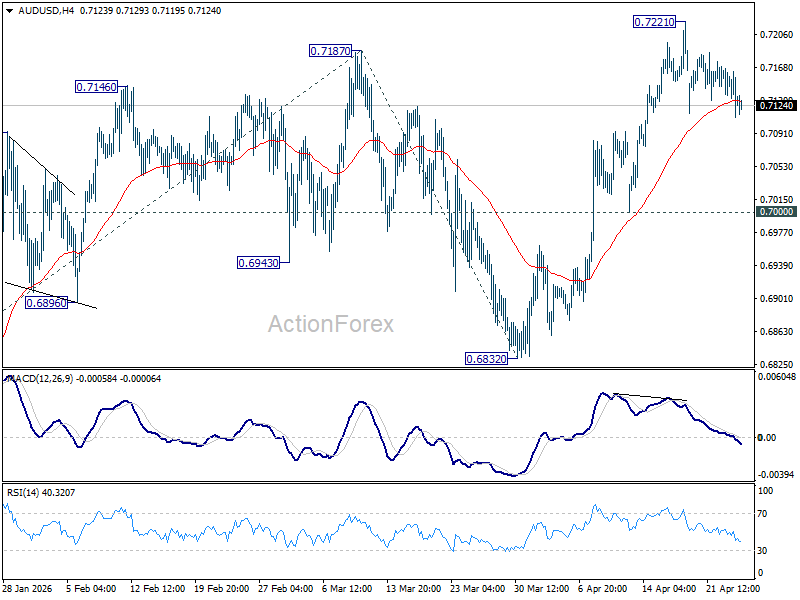
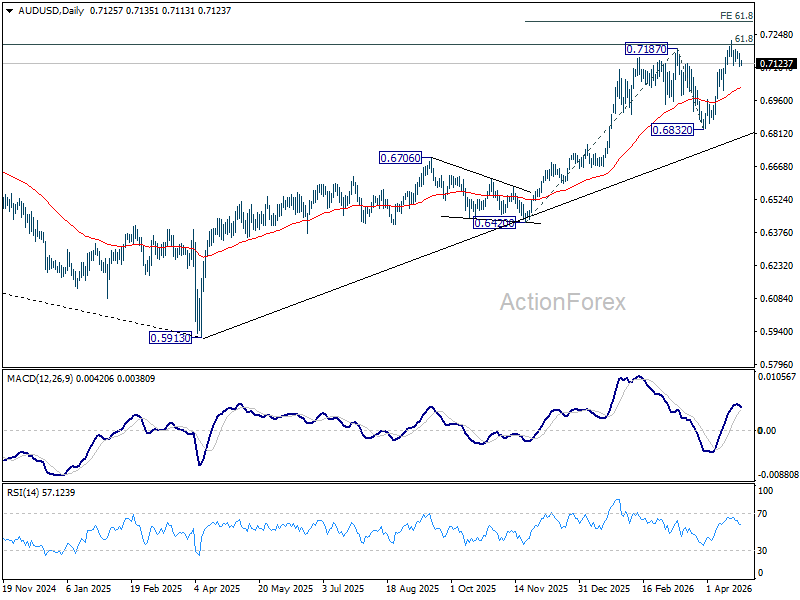
In the bigger picture, rise from 0.5913 (2024 low) is still in progress. Decisive break of 61.8% retracement of 0.8006 to 0.5913 at 0.7206 will solidify the case that it's already reversing the down trend from 0.8006 (2021 high). Further rally should then be seen to retest 0.8006. For now, outlook will remain bullish as long as 0.6832 support holds, in case of pullback.
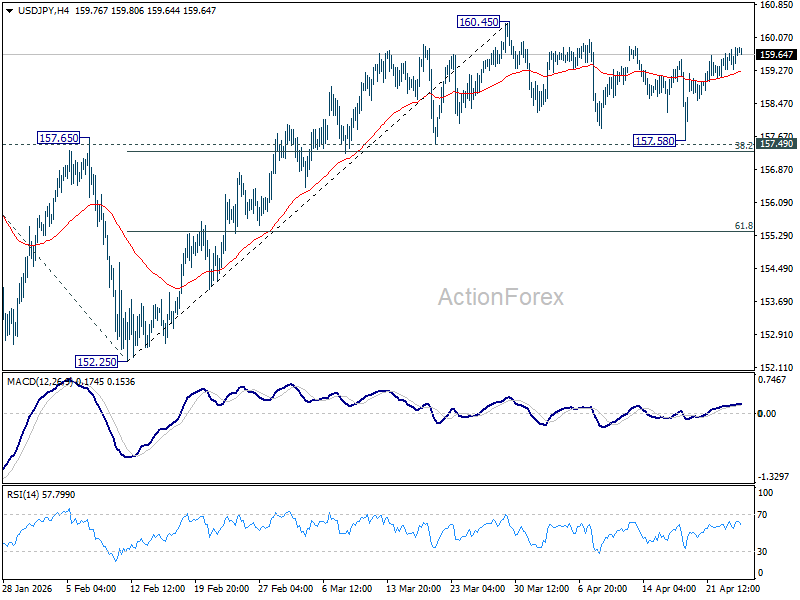
USD/JPY Daily Outlook
Daily Pivots: (S1) 159.41; (P) 159.64; (R1) 159.99; More...
Intraday bias in USD/JPY remains neutral as range trading continues below 160.45. Further rise is expected with 157.49 cluster support (38.2% retracement of 152.25 to 160.45 at 157.31) intact. On the upside break of 160.45 will target a retest on 161.94 high. However, firm break of 157.31/49 will bring deeper fall back to 61.8% retracement at 155.38 next.
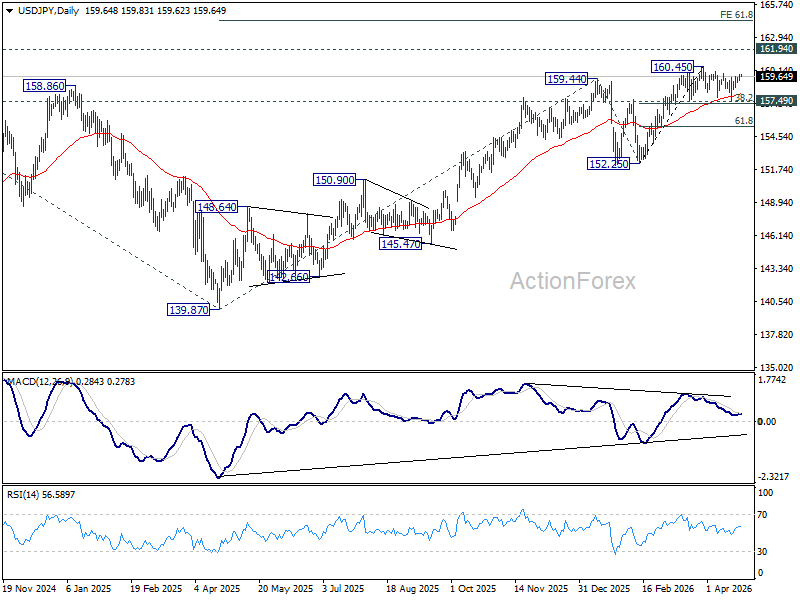
In the bigger picture, outlook is unchanged that corrective pattern from 161.94 (2024 high) should have completed with three waves at 139.87. Larger up trend from 102.58 (2021 low) could be ready to resume through 161.94. This will remain the favored case as long as 55 W EMA (now at 153.80) holds. Firm break of 161.94 will pave the way to 61.8% projection of 102.58 to 161.94 from 139.87 at 176.75.
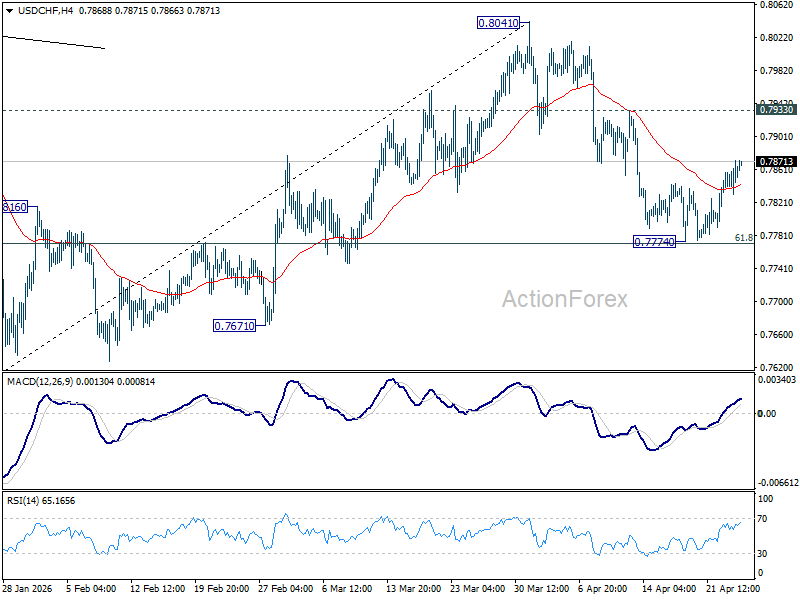
USD/CHF Daily Outlook
Daily Pivots: (S1) 0.7838; (P) 0.7856; (R1) 0.7882; More….
Intraday bias in USD/CHF remains neutral at this point. Further decline is expected as long as 0.7933 resistance holds. On the downside, sustained break 61.8% retracement of 0.7603 to 0.8041 at 0.7770 will resume the decline from 0.8041 to retest 0.7603 low. However, break of 0.7933 will bring retest of 0.8041 high instead.
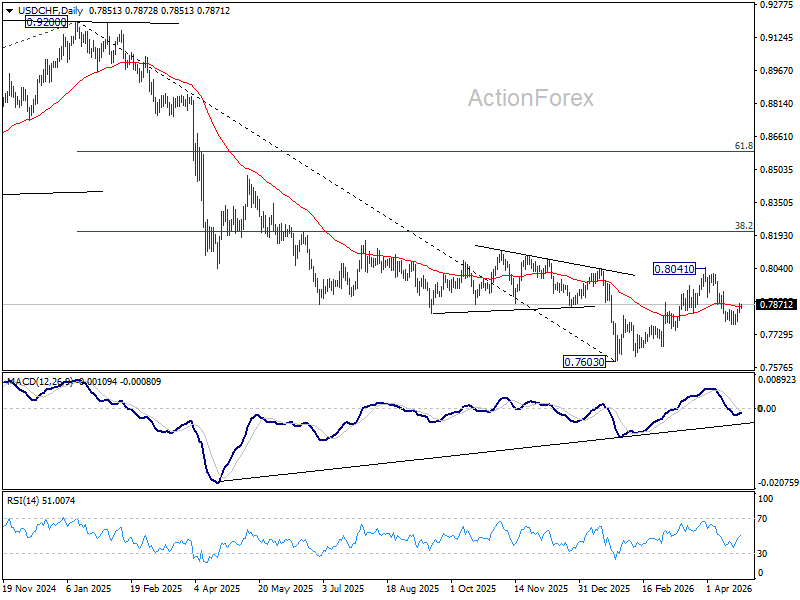
In the bigger picture, rebound from 0.7603 medium term bottom is seen as correcting the fall from 0.9200 only. Rejection by 55 W EMA (now at 0.8059) will affirm this bearish case, and setup down trend resumption to 100% projection of 1.0146 (2022 high) to 0.8332 from 0.9200 at 0.7382 at a later stage. Though, sustained break of 55 W EMA will suggest that it's probably correcting the larger scale down trend from 1.0146 (2022 high).
GBP/USD Daily Outlook
Daily Pivots: (S1) 1.3435; (P) 1.3477; (R1) 1.3507; More...
Intraday bias in GBP/USD remains neutral, and further rise is still in favor with 1.3379 support intact. On the upside, sustained break of 61.8% retracement of 1.3867 to 1.3158 at 1.3596 will pave the way to retest 1.3867 high. However, firm break of 1.3379 will bring deeper fall back to 1.3158 low instead.
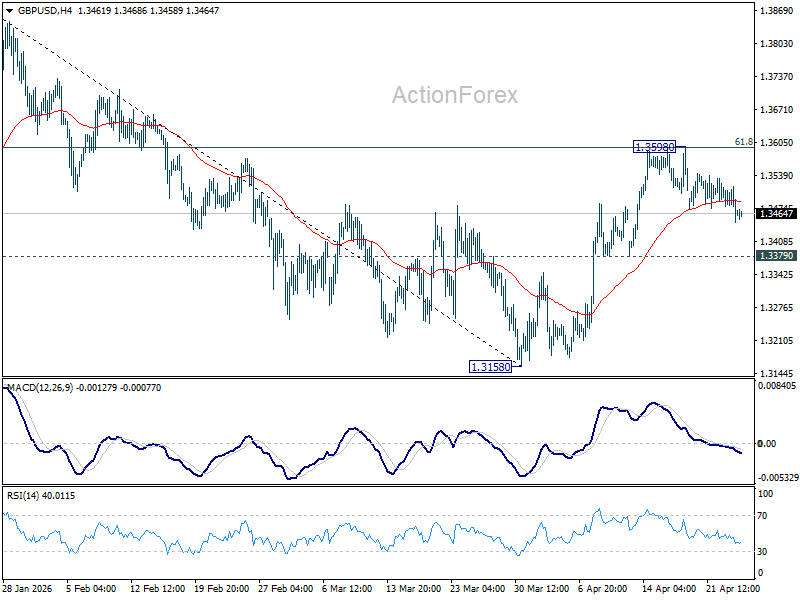
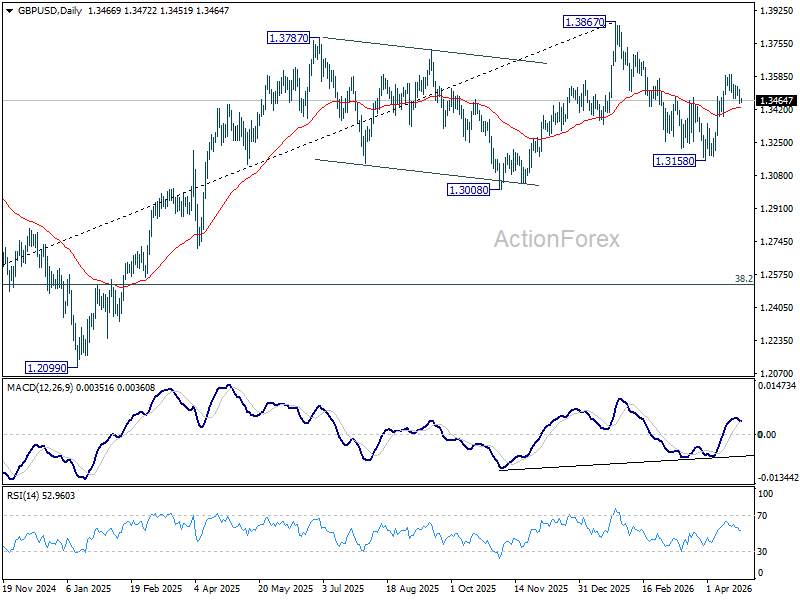
In the bigger picture, current development suggests that price actions from 1.3867 are merely a corrective pattern within the broader up trend from 1.0351 (2022 low). With 1.3008 support intact, medium term bullishness is maintained and break of 1.3867 is back in favor for a later stage, towards 1.4248 key resistance (2021 high).
The Ceasefire is Holding, but Remains Fragile
Geopolitical tensions remain elevated. The ceasefire is holding, but remains fragile. The US Navy reportedly “boarded a supertanker carrying Iranian oil in the Indian Ocean,” while Donald Trump ordered American forces to shoot boats placing mines in the Strait of Hormuz. Iran, frustrated by Trump’s blockade and public bashing, appears unwilling to return to the negotiating table.
Oil prices are consolidating near the $100 per barrel level. Developed market yields are rising alongside oil prices, fueling inflation expectations, while equities remain hesitant near all-time highs.
PMI data released yesterday confirmed the negative impact of the energy shock on economic activity. European services were particularly affected. The EURUSD has fallen back below its 100-day moving average and is now testing the 200-day moving average to the downside.
A broadly stronger US dollar is also weighing on the global FX complex, with the dollar index testing its own 50-day moving average to the upside as geopolitical tensions persist into the weekend and rising oil prices increase demand for dollars.
As a result, the rally across global equity indices stalled yesterday. The Stoxx 600 closed flat, while the S&P 500 pulled back from all-time highs.
A sharp sell-off in software stocks added to concerns after results from IBM failed to reassure investors that the transition alongside AI would be smooth. The company highlighted slowing software growth and did not upgrade guidance, reinforcing doubts about the sector’s momentum. This revived fears that AI could disrupt traditional software models, prompting broad-based selling across the sector—not just IBM. The iShares Expanded Tech Software ETF fell more than 5%.
This also feeds into concerns around private credit exposure linked to these companies. In short, the software demons were back yesterday.
On the other side of the trade, AI enablers continue to extend gains. Chip stocks moved higher again, with VanEck’s Semiconductor ETF hitting a fresh all-time high as appetite for AI investment remains strong.
Intel earnings after the bell put a cherry on top. The company reported better-than-expected results and guidance, driven by demand for data center chips powering AI expansion, particularly its Xeon server processors.
While Intel has struggled to compete in GPUs against Nvidia and AMD, it remains strong in CPUs. As companies build AI infrastructure, demand for CPUs is also increasing, as they are needed to support systems surrounding GPUs. Nvidia itself launched its Grace CPU earlier this year to tap into that demand. Intel also benefits from its foundry ambitions and US government support to reshore semiconductor production. And if it makes any difference: Elon Musk said he would use Intel tech to build his in-house chip manufacturing plant. Shares rose around 20% in after-hours trading. Intel could benefit further from sustained CPU demand tied to AI expansion.
Across the Pacific, SK Hynix reported similarly strong results. Profit surged significantly, while revenue rose sharply on the back of memory chip demand.
Across the Pacific, the Korean SK Hynix echoed a similar story. Their profit jumped fivefold to over $25bn last quarter while revenue tripled past the $35bn mark. That’s more than half of what Nvidia announced the quarter before and triple the Intel revenue! It’s a big number. SK Hynix investors however were less impressed than Intel’s – as the surge in revenue has been priced. The stock is up by nearly 700% since last year. This surge is partly due to the fact that we’re in a memory chip boom cycle, that SK Hynix expects to last for another 3 years, but after that, if history is any guidance, there will be plenty of chips in the market and that the prices will tank and we will enter the bust cycle. There is a possibility that AI helps memory chip makers break that cycle. But what’s more realistic is that AI demand will make the boom cycle longer, but not keep the sector in the boom phase forever. So profit taking on blockbuster results were on the menu for SK Hynix following the earnings as a sign that it may be time for a certain downside correction and consolidation for memory chip makers
Elsewhere, TSMC reached a fresh all-time high in Taiwan after regulators lifted caps on single-stock holdings. Meanwhile, China’s DeepSeek launched a preview of its anticipated V4 model, lifting Chinese semiconductor stocks. Hua Hong Semiconductor rose sharply, Cambricon Technologies gained, and SMIC also advanced. Alibaba Group—which is reportedly considering an investment in DeepSeek—also saw increased demand.
As a result, the Hang Seng rebounded from early losses, while tech-heavy Nasdaq futures outperformed US and European peers this morning. Geopolitical uncertainty may continue to support demand for technology stocks, as investors remain cautious toward sectors more directly exposed to conflict and global growth risks.
Oil Steady Despite Extended Israel-Lebanon Ceasefire
In focus today
- Today is light on the data calendar, with no tier-1 releases scheduled.
- In Sweden, the Producer Price Index for March will be published, serving as a reliable leading indicator for goods prices over a 3-6-month horizon. We will closely monitor to what extent the high energy prices and the war have impacted other prices besides energy.
- Have a great weekend!
Economic and market news
What happened overnight
In the Middle East conflict, Trump announced a three-week extension to the ceasefire between Israel and Lebanon. However, this did little to calm oil prices, with Brent crude holding yesterday's levels, trading at the highest level since the ceasefire announcement slightly over two weeks ago. The market reacted to signs of renewed escalation of the US-Iran conflict and reduced odds of reopening the Strait of Hormuz. Prediction markets signal less than 50% chance of traffic normalising before the end of May.
In Japan, the national March CPI confirmed consensus expectations of a modest increase in core inflation to 1.8% y/y, as government fuel subsidies and easing food inflation offset cost-push pressures from the energy shock. While inflation remains below the Bank of Japan's 2% target, renewed acceleration could come in the coming months as firms pass on higher input costs. These dynamics will likely be key factors at the Bank of Japan policy meeting next week.
What happened yesterday
In the euro area, the composite PMI fell more than expected in April to 48.6 (prior: 50.7), driven by weaker services at 47.4 (cons: 49.8, prior: 50.2). The manufacturing index surprised on the upside at 52.2 (prior: 51.6), partly due to longer delivery times, but output and new orders was still above 50 indicating that the sector is not hit as hard as feared. As services is the largest sector, this decline is more important than the manufacturing rise, which is dovish for the ECB. However, price components rose sharply, partly countering the dovish take from the growth data. Overall, the diverging trends in growth and prices supports the view of ECB holding rates unchanged in April as they await more data. With the ECB being more focused on curbing upside inflationary pressures relative to downside growth pressures we still see two hikes this summer as the most likely scenario.
In the US, the Composite PMI recorded a solid uptick to 52.0 (prior: 50.3), driven by stronger manufacturing at 54.0 (prior: 52.3) and services at 51.3 (prior: 49.8). However, manufacturing indices appear to have been partly distorted by longer supply delivery times and potentially by front-loaded new orders ahead of expected cost increases and shortages. On the surface, this appears to support the notion that the euro area is relatively more vulnerable to the energy shock, but we caution against overinterpreting single data prints.
In the UK, April PMIs suggest the economy has remained afloat, with the service sector even accelerating, leaving the composite PMI at 52 - much stronger than expected. Price indices rose sharply, driven primarily by input prices, but also the output price index climbed above 62, its highest level since early 2023. On the other hand, consumer sentiment declined for a third consecutive month to the lowest level since late-2023. Overall, recent data probably strengthens the arguments for hiking rates and will likely serve to split the hawks and doves in the Bank of England already at the policy meeting next week.
In Sweden, Anna Seim delivered a speech, aligning closely with Governor Thedeen's stance on Wednesday, maintaining a relatively hawkish tone while emphasising the need for more evidence before adjusting policy. Her remarks suggest vigilance regarding inflation risks but acknowledge subdued inflationary pressures in Sweden.
In Norway, preliminary wage statistics showed that annual wage growth (3-month moving average) slowed from 3.8% to 3.3% in March. While this figure is significantly below Norges Bank's (NB) 2026 estimate of 4.5%, it is important to note that the NB estimate accounts for contributions from central negotiations and wage drift throughout the year. That said, the figures clearly point to a slowdown in overall wage growth, which could indicate a somewhat weaker labour market.
Equities: Global equities ended a touch lower at 0.4% in general sour risk sentiment. S&P500 declined 0.4%, Nasdaq -0.9%, Russell2000 -0.4%. Stoxx600 was flat. Value stocks largely reversed Wednesday's decline, amid an otherwise defensive outperformance to cyclicals. The tech sector was the clear underperformer, however this was entirely driven by the software companies that was 5.1% down yesterday. Futures are generally down, with the exception of Nasdaq as Intel gave strong AI driven outlook. Asian indices are mostly in red.
FI and FX: Trump's announcement of an extended ceasefire between Israel and Lebanon did little to calm oil prices, which continued rising yesterday with Brent crude rising to the highest level since the announcement of ceasefire a little over two weeks ago. By extension, EUR/USD also declined further below 1.17. Global yields held fairly steady with USD swap rates ending the day 1-3bp higher across the curve while EUR swap rates did a minor twist flattening of the curve. PMI releases failed to significantly move markets. The upwards pressure on EUR/DKK eased a bit yesterday. It might be that DKK has started to receive support from the recent bout of positive risk sentiment, which has also benefitted SEK and NOK.
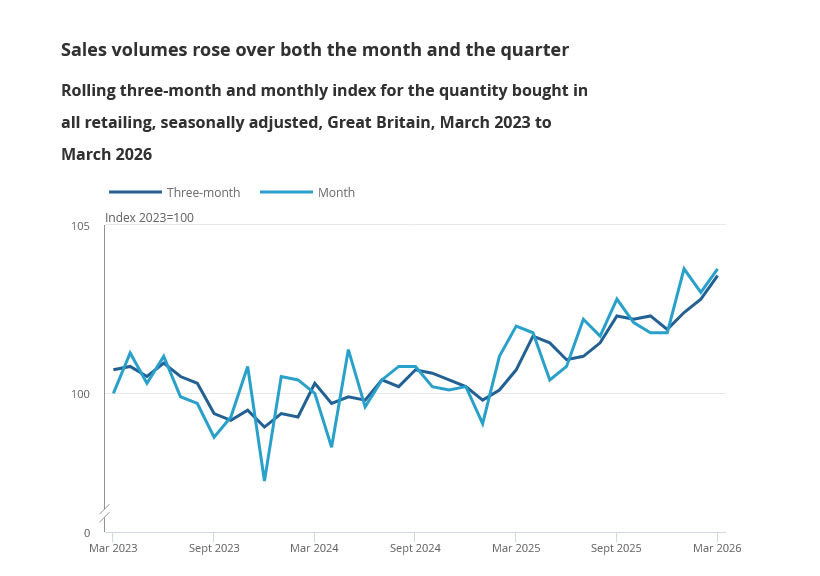
UK Retail Sales Rise 0.7% as Fuel Stockpiling Drives March Rebound
UK retail sales rebounded strongly in March, with volumes rising 0.7% mom, well above expectations of 0.0% and reversing a revised -0.6% decline in February. The data points to a solid end to the first quarter, with overall retail volumes increasing 1.6% qoq.
However, the strength was driven largely by a surge in fuel sales, as households rushed to fill up amid rising prices. Excluding automotive fuel, retail sales rose a more modest 0.2% mom, suggesting that underlying consumer demand remains relatively subdued despite the headline beat.
On an annual basis, retail sales rose 1.7% yoy, also above expectations of 1.2%.
| Indicator | Mar 2026 |
|---|---|
| Retail Sales (MoM) | +0.7% |
| Retail Sales ex-Fuel (MoM) | +0.2% |
| Retail Sales (QoQ, Q1) | +1.6% |
| Retail Sales (YoY) | +1.7% |
EUR/USD Daily Outlook
Daily Pivots: (S1) 1.1663; (P) 1.1691; (R1) 1.1712; More….
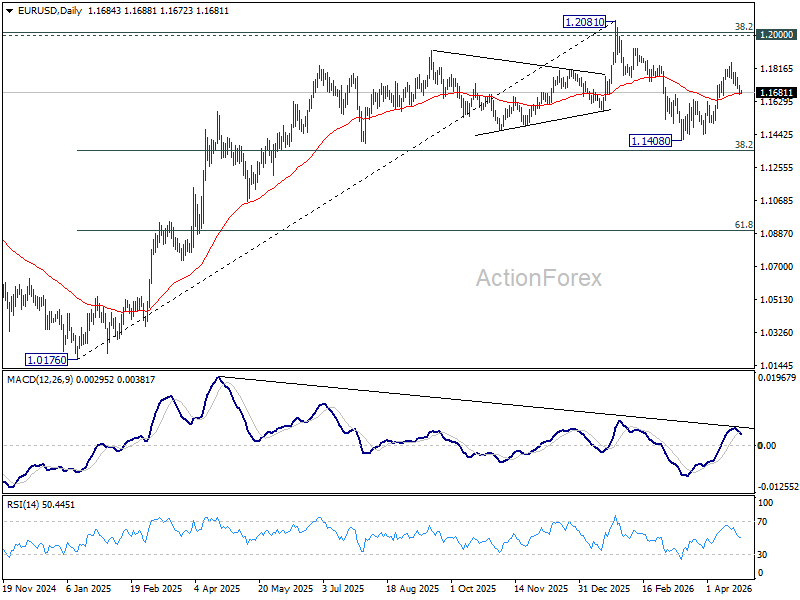
EUR/USD edged lower today but stays above 1.1662 support. Intraday bias remains on the upside and further rise is still in favor. On the upside, sustained trading above 61.8% retracement of 1.2081 to 1.1408 at 1.1824 will pave the way to retest 1.2081 high. However, firm break of 1.1662 support will indicate the the rebound fro 1.1408 has completed, and bring deeper decline back towards this low instead.
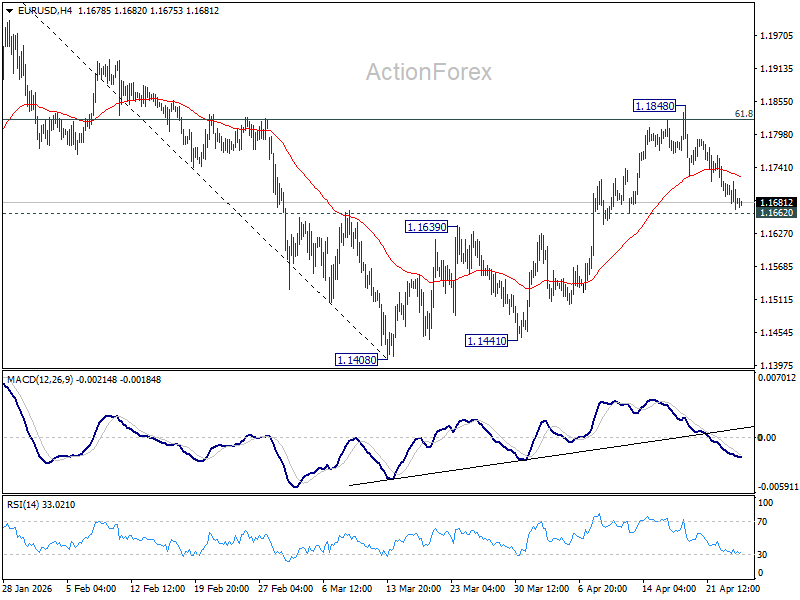
In the bigger picture, the strong support from 38.2% retracement of 1.0176 to 1.2081 at 1.1353 suggests that the pullback from 1.2081 is more likely a corrective move. Strong support was also found in 55 W EMA (now at 1.1507). Focus is back on 1.2 key cluster resistance level. Decisive break there will carry long term bullish implications. Nevertheless, break of 1.1408 support will revive the case of medium term bearish trend reversal.
Dollar Rises as US–Iran Stalemate Lift Oil Prices, Euro Hit by Weak Outlook
Dollar and oil are rising together today as ceasefires extend—but conflict persists. Despite a three-week extension of the Israel–Hezbollah truce and the ongoing “indefinite” pause in US–Iran conflicts, markets are increasingly focused on what is still happening rather than what has been paused. Maritime seizures, naval blockades, and localized escalations continue to define the situation, keeping risk elevated and supply disruption concerns firmly in place.
The US has maintained its naval blockade of Iranian ports, while Iran’s IRGC continues to seize vessels in the Strait of Hormuz. This evolving maritime standoff is reinforcing the idea that the ceasefire is a delay, not a resolution. As a result, oil prices are extending higher, reflecting expectations of prolonged disruption.
This backdrop is supporting Dollar strength. Rising oil prices are feeding into inflation expectations, reinforcing the higher-for-longer rate outlook while also attracting safe-haven demand. The combination of yield support and geopolitical uncertainty is keeping the Dollar bid, even as broader market conviction remains limited.
Euro, by contrast, is emerging as the weakest link. This week's PMI data shows the Eurozone has already slipped into contraction, with services activity deteriorating sharply. Germany’s downgrade of its growth outlook, from 1.0% to just 0.5% in 2026, adds to the concern that the region is particularly exposed to the energy shock. If markets are moving toward a stagflation narrative, Europe appears to be leading the downturn.
Yen remains soft but is finding some support from intervention risks. Japan’s Finance Minister has reiterated warnings of “decisive action,” and traders remain cautious about pushing USD/JPY beyond the 160 level. This has limited downside momentum in Yen despite the broader Dollar strength.
Currency performance for the week reflects this fragmented environment. Dollar leads, followed by oil-supported Canadian Dollar. Euro is the weakest, with Yen and Swiss Franc also under pressure. Sterling, Aussie and Kiwi sit in the middle, lacking clear directional drivers.
In Asia, at the time of writing, Nikkei is up 0.85%. Hong Kong HSI is down -0.14%. China Shanghai SSE is down -0.68%. Singapore Strait Times is down -0.51%. Japan 10-year JGB yield is up 0.015 at 2.441. Overnight, DOW fell -0.36%. S&P 500 fell -0.41%. NASDAQ fell -0.89%. 10-year yield rose 0.029 to 4.323.
Silver Fails at $84—Will Oil and Dollar Strength Accelerate a Move to $60?
Silver has broken below $75 after failing at $84, as oil and Dollar strength take control. If both continue higher, a move toward $60 is coming into focus. Read More.
Japan's Core Inflation Rises to 1.8% in March, Core-Core Ticks Down
Japan CPI rises to 1.8% in March but remains below BoJ's target as core-core inflation slips to 2.4%. Rising oil prices and cost pressures pose risks ahead. Read More.
EUR/USD Daily Outlook
Daily Pivots: (S1) 1.1663; (P) 1.1691; (R1) 1.1712; More….
EUR/USD edged lower today but stays above 1.1662 support. Intraday bias remains on the upside and further rise is still in favor. On the upside, sustained trading above 61.8% retracement of 1.2081 to 1.1408 at 1.1824 will pave the way to retest 1.2081 high. However, firm break of 1.1662 support will indicate the the rebound fro 1.1408 has completed, and bring deeper decline back towards this low instead.
In the bigger picture, the strong support from 38.2% retracement of 1.0176 to 1.2081 at 1.1353 suggests that the pullback from 1.2081 is more likely a corrective move. Strong support was also found in 55 W EMA (now at 1.1507). Focus is back on 1.2 key cluster resistance level. Decisive break there will carry long term bullish implications. Nevertheless, break of 1.1408 support will revive the case of medium term bearish trend reversal.
Silver Price Fails at $84—Will Oil and Dollar Strength Accelerate a Move to $60?
Silver has come under notable pressure this week, slipping back below the $75 level as oil prices and the Dollar strengthen. The metal is now at risk of a deeper decline toward the March low near $60, especially if the rallies in oil and the Dollar continue to gather momentum.
The backdrop remains the evolving US–Iran situation. With talks cancelled and the ceasefire extended indefinitely, tensions in the Strait of Hormuz remain elevated. Ongoing supply disruptions are keeping oil prices firm, with Brent holding above $106 and pushing toward $110. This sustained strength in energy markets is feeding directly into inflation expectations.
For Silver, the implication is clear. Higher oil prices are lifting inflation expectations, which in turn are pushing global interest rate expectations higher. Rather than benefiting from geopolitical risk, Silver is being weighed down by the “higher-for-longer” rate outlook, as rising yields and a stronger Dollar reduce the appeal of non-yielding assets.
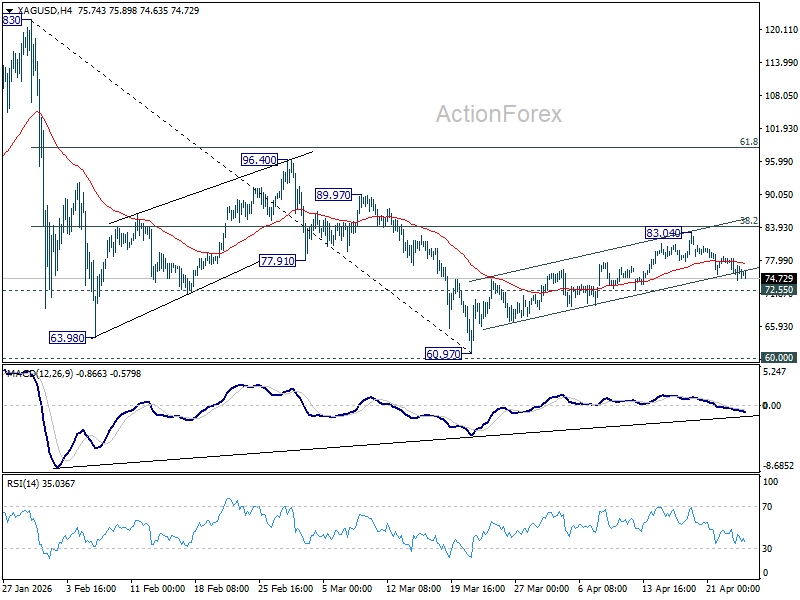
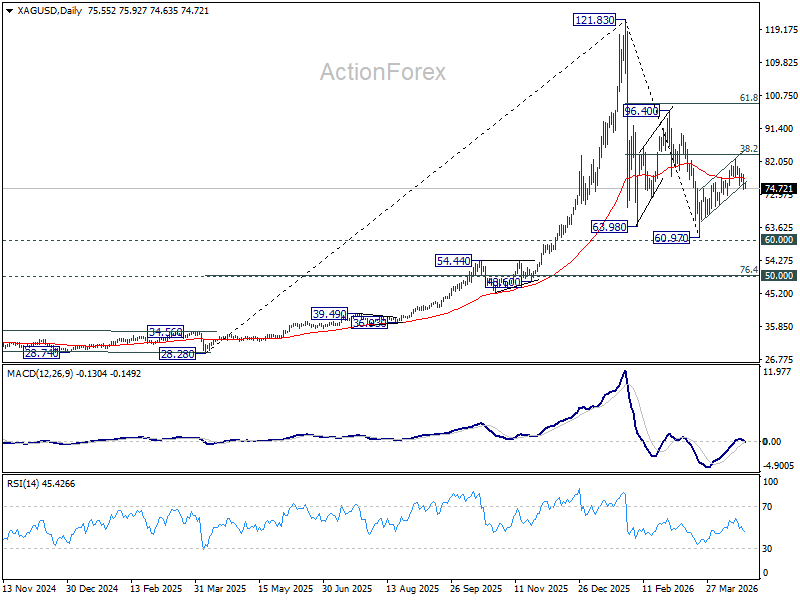
Technically, the near term outlook for Silver has deteriorated. The rejection ahead of the 38.2% retracement of 121.83 to 60.97 at 84.21 suggests that the rebound from 60.97 has likely completed at 83.04. The break below the near-term rising channel support adds further confirmation that downside momentum is building. This development signals that the corrective bounce from 60.97 low has ended and that a new leg lower may be underway.
Attention now turns to the 72.55 support level. Decisive break here would solidify the bearish case and open the path for a deeper decline. The next targets lie at the prior low of 60.97, with the psychological 60 level likely to come into focus.