

Sample Category Title
EUR/USD Mid-Day Outlook
Daily Pivots: (S1) 1.1684; (P) 1.1724; (R1) 1.1745; More….
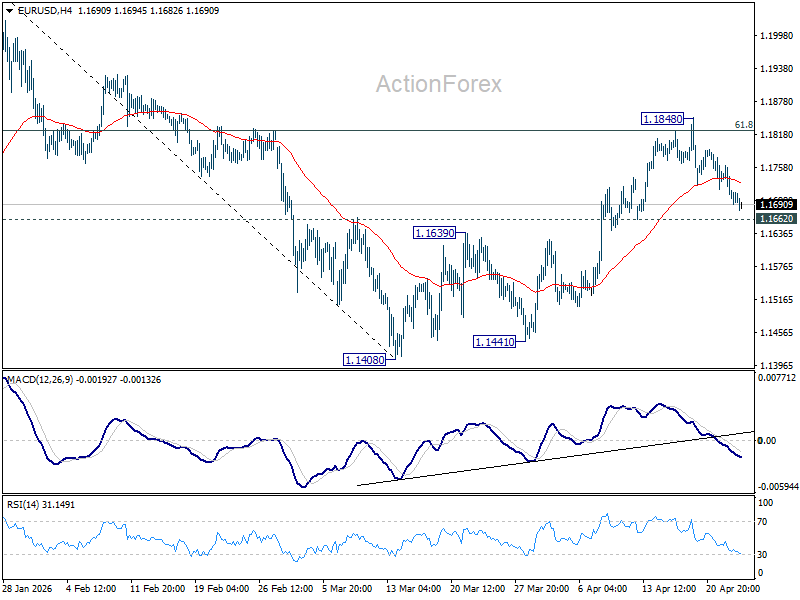
No change in EUR/USD's outlook as it's staying above 1.1662 support. Intraday bias remains on the upside and further rise is still in favor. On the upside, sustained trading above 61.8% retracement of 1.2081 to 1.1408 at 1.1824 will pave the way to retest 1.2081 high. However, firm break of 1.1662 support will bring deeper decline back towards 1.1408 low instead.
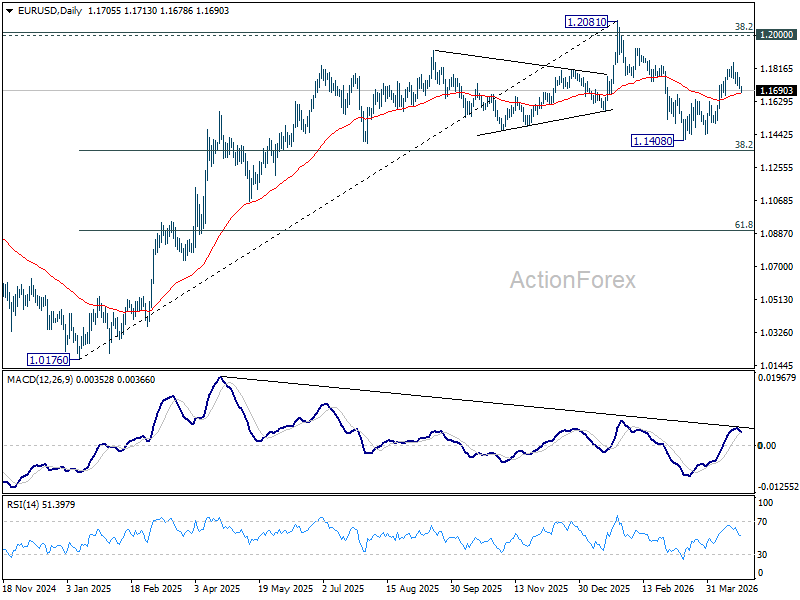
In the bigger picture, the strong support from 38.2% retracement of 1.0176 to 1.2081 at 1.1353 suggests that the pullback from 1.2081 is more likely a corrective move. Strong support was also found in 55 W EMA (now at 1.1507). Focus is back on 1.2 key cluster resistance level. Decisive break there will carry long term bullish implications. Nevertheless, break of 1.1408 support will revive the case of medium term bearish trend reversal.
GBP/USD Mid-Day Outlook
Daily Pivots: (S1) 1.3484; (P) 1.3511; (R1) 1.3529; More...
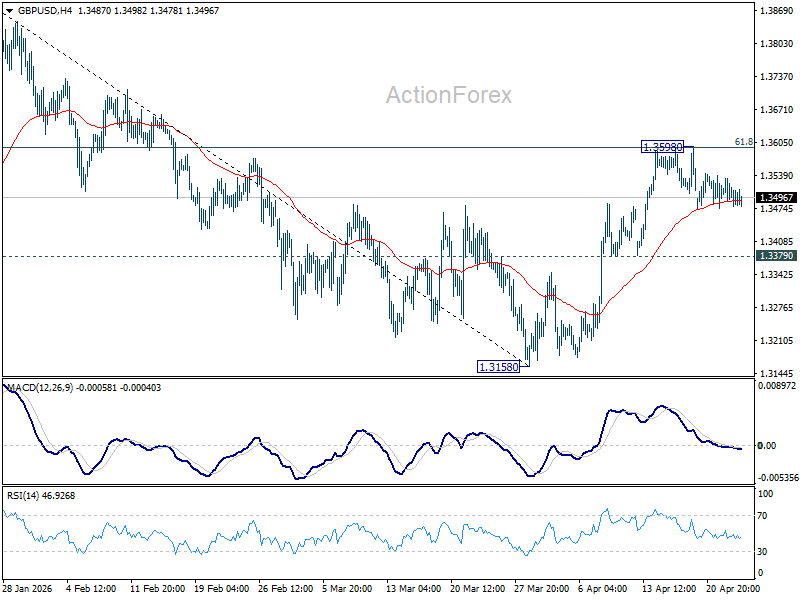
No change in GBP/USD's outlook as it's still extending consolidations from 1.3598 and intraday bias remains neutral. With 1.3379 support intact, further rise is favor. On the upside, sustained break of 61.8% retracement of 1.3867 to 1.3158 at 1.3596 will pave the way to retest 1.3867 high. However, firm break of 1.3379 will bring deeper fall back to 1.3158 low instead.
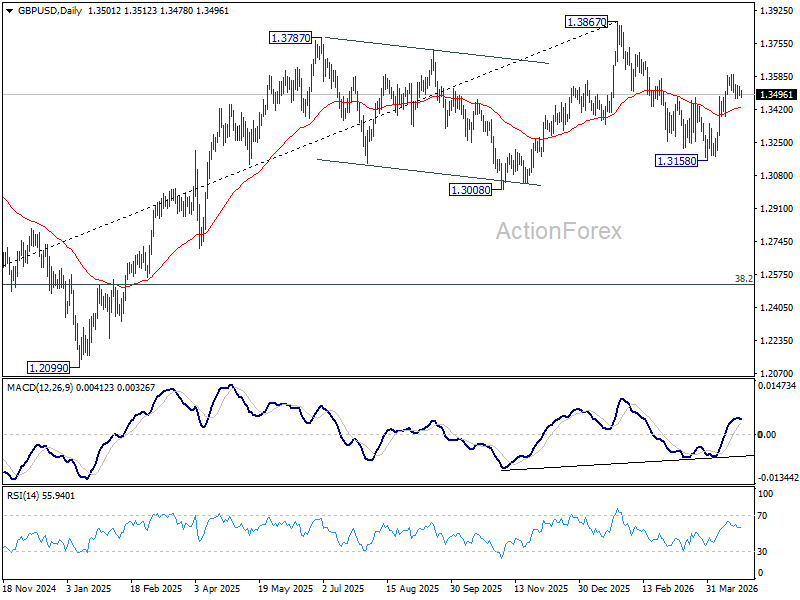
In the bigger picture, current development suggests that price actions from 1.3867 are merely a corrective pattern within the broader up trend from 1.0351 (2022 low). With 1.3008 support intact, medium term bullishness is maintained and break of 1.3867 is back in favor for a later stage, towards 1.4248 key resistance (2021 high).
USD/CHF Mid-Day Outlook
Daily Pivots: (S1) 0.7808; (P) 0.7830; (R1) 0.7867; More….
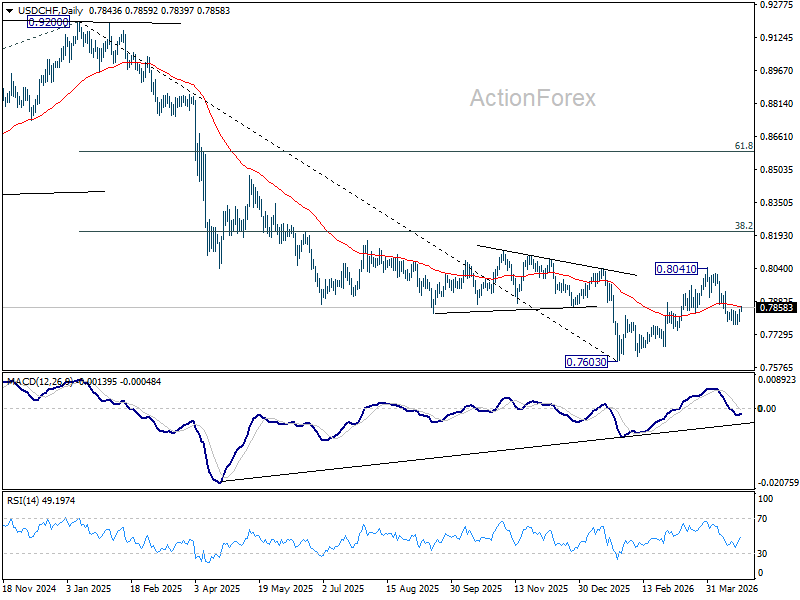
USD/CHF recovers further today but stays well below 0.7933 resistance. Intraday bias remains neutral and further decline is expected. Sustained break of 61.8% retracement of 0.7603 to 0.8041 at 0.7770 will resume the decline from 0.8041 to retest 0.7603 low.
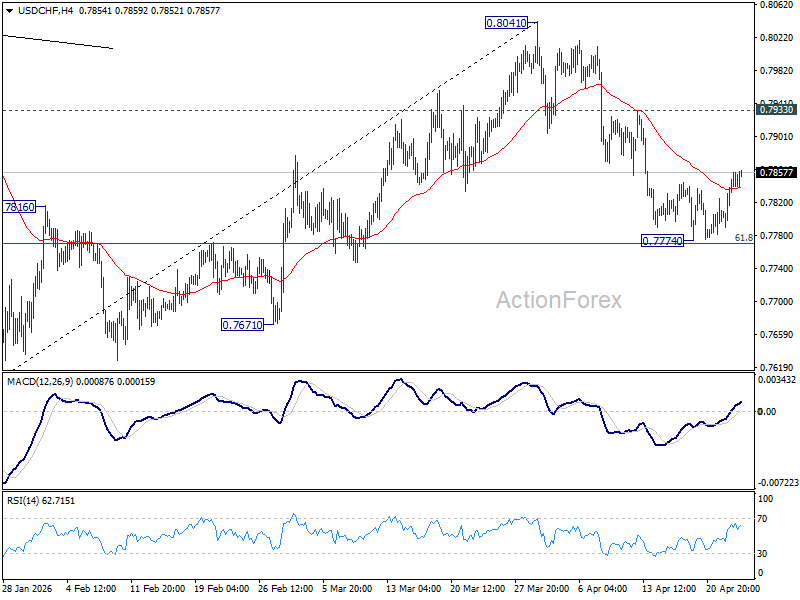
In the bigger picture, rebound from 0.7603 medium term bottom is seen as correcting the fall from 0.9200 only. Rejection by 55 W EMA (now at 0.8059) will affirm this bearish case, and setup down trend resumption to 100% projection of 1.0146 (2022 high) to 0.8332 from 0.9200 at 0.7382 at a later stage. Though, sustained break of 55 W EMA will suggest that it's probably correcting the larger scale down trend from 1.0146 (2022 high).
USD/JPY Mid-Day Outlook
Daily Pivots: (S1) 159.20; (P) 159.38; (R1) 159.66; More...
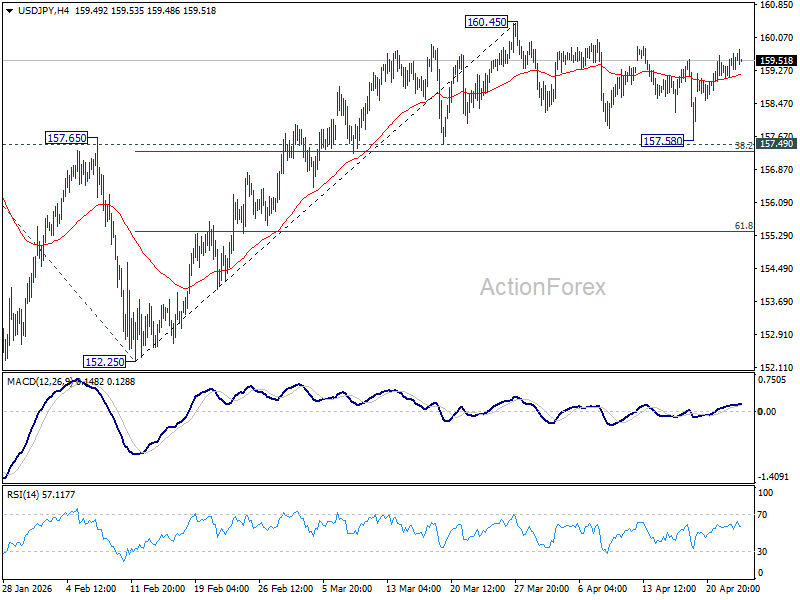
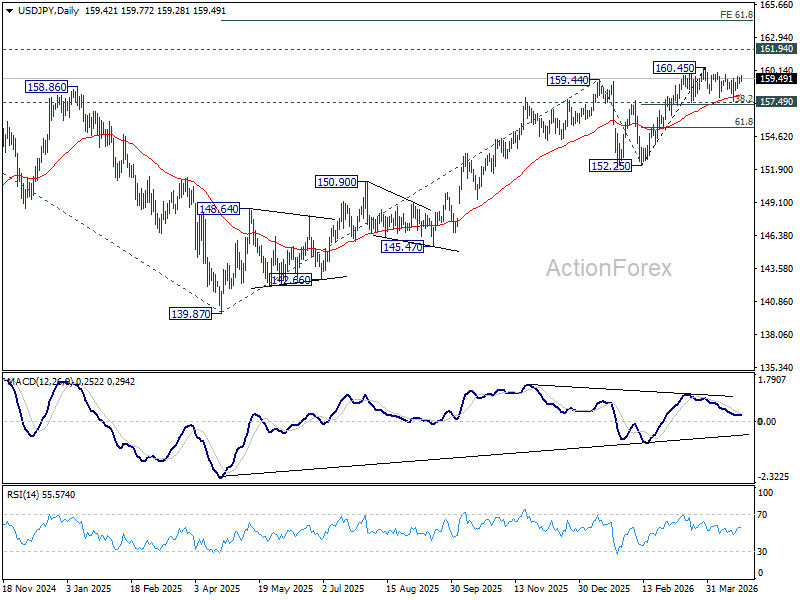
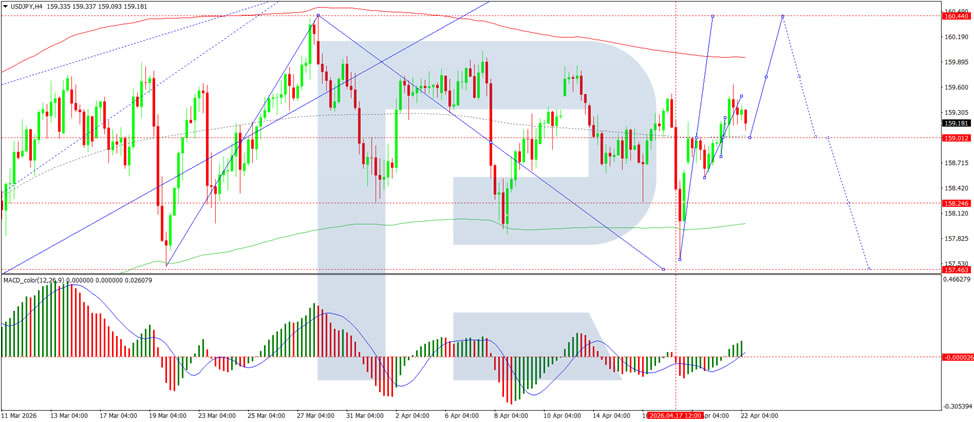
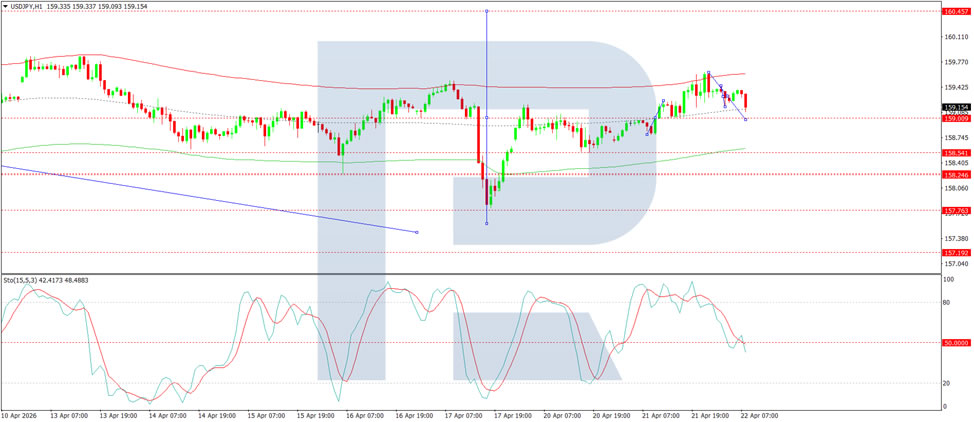
USD/JPY edged higher today, but remains bounded in established range below 160.45. Intraday bias remains neutral and more consolidations could still be seen. Further rise is expected with 157.49 cluster support (38.2% retracement of 152.25 to 160.45 at 157.31) intact. On the upside break of 160.45 will target a retest on 161.94 high. However, firm break of 157.31/49 will bring deeper fall back to 61.8% retracement at 155.38 next.
In the bigger picture, outlook is unchanged that corrective pattern from 161.94 (2024 high) should have completed with three waves at 139.87. Larger up trend from 102.58 (2021 low) could be ready to resume through 161.94. This will remain the favored case as long as 55 W EMA (now at 153.80) holds. Firm break of 161.94 will pave the way to 61.8% projection of 102.58 to 161.94 from 139.87 at 176.75.
Global PMIs Diverge as Iran War Shock Spreads: Europe Contracts, UK Front-Loads, Australia Trapped, Japan Absorbs Costs
Global PMI data for April paints a clear picture: the Iran war shock is now feeding through the world economy, but not in a uniform way. Rising energy costs and supply disruptions are hitting all major regions, yet the transmission differs sharply depending on economic structure, demand conditions, and policy constraints. What emerges is not synchronized slowdown, but fragmented stagflation.
The common thread is unmistakable. Across Australia, Japan, the Eurozone and the UK, businesses are reporting surging input costs, longer delivery times, and a growing need to secure supplies ahead of further disruptions. Energy, shipping, and raw materials are the key drivers, with the Strait of Hormuz disruption acting as the central transmission channel. The result is a broad-based cost shock now pushing through supply chains globally.
Nowhere is the impact clearer than in the Eurozone. The Flash Composite PMI fell into contraction, driven by a sharp collapse in services, the weakest since the pandemic period. The region’s heavy reliance on imported energy makes it particularly vulnerable to the “Hormuz gap,” where supply disruption translates quickly into both higher prices and weaker demand. While manufacturing remains in expansion, this strength is largely artificial, driven by stockpiling rather than genuine demand. The Eurozone is already slipping into a stagflationary phase—falling growth alongside rising prices.
The UK is showing a different pattern, but one that may prove equally fragile. PMI data rebounded, With Manufacturing reaching a multi-year high. However, this strength is being driven by front-loaded demand, as firms rush to secure inputs before costs rise further. Price pressures have surged at rates not seen outside the pandemic, and supply delays are intensifying. Growth is being pulled forward, suggesting that the current expansion may not be sustainable.
Australia presents a classic policy trap. The Composite PMI returned to expansion, but manufacturing output remains in contraction, pointing to underlying weakness. At the same time, cost pressures have surged to the highest level in nearly four years. This creates a “nightmare scenario” for the Reserve Bank of Australia: growth is fragile, yet inflation is being pushed higher by external shocks, leaving limited room for policy flexibility.
Japan’s case is more nuanced but no less challenging. Manufacturing is surging, with PMI at 54.9 and output at multi-year highs, supported by export demand and precautionary production. However, services are slowing, and input costs are rising rapidly. The weak Yen is acting as a double-edged sword—boosting exports while sharply increasing the cost of imported energy and raw materials. Rather than broad inflation, Japan is experiencing a margin squeeze, with companies struggling to pass through rising costs.
| Economy | Growth Impact | Inflation Impact | Overall Risk |
|---|---|---|---|
| Eurozone | Sharp slowdown | Strong | Stagflation 🔴 |
| UK | Temporary rebound | Very strong | Delayed slowdown 🟠 |
| Australia | Fragile | Rising | Policy trap 🟠 |
| Japan | Mixed (exports up) | Imported inflation | Margin squeeze 🟡 |
Across all regions, a key feature is the role of stockpiling. Firms are accelerating purchases and building inventories in anticipation of further supply disruptions and price increases. This behavior is temporarily boosting manufacturing activity but is unlikely to be sustained. Once inventories are rebuilt or demand weakens, production could slow sharply.
Inflation dynamics are also shifting. This is no longer just an energy story. While oil remains the initial trigger, price increases are spreading across goods and services, reflecting both supply constraints and precautionary pricing behavior. The risk of second-round effects is rising, particularly in Europe and the UK, where cost pass-through is more immediate.
Central banks are now facing increasingly complex trade-offs. The European Central Bank is confronted with contraction and inflation simultaneously, limiting its policy options. The Bank of England and Reserve Bank of Australia are facing pressure to tighten policy even as growth shows signs of fragility. The Bank of Japan remains more cautious but is not immune to rising cost pressures.
The broader takeaway is clear. The oil shock from the Iran war is not producing a synchronized global slowdown, but a fragmented and uneven adjustment. Europe is already contracting, the UK is front-loading growth, Australia is caught in a policy trap, and Japan is absorbing the shock through costs.
Ultimately, this divergence is likely to define the next phase of the global cycle. Markets will increasingly differentiate between regions based on how they absorb the shock. The common factor remains oil—and as long as supply risks persist, the inflationary pressure will continue to shape both policy and market direction.
US Initial Unemployment Claims Edge Higher to 214k
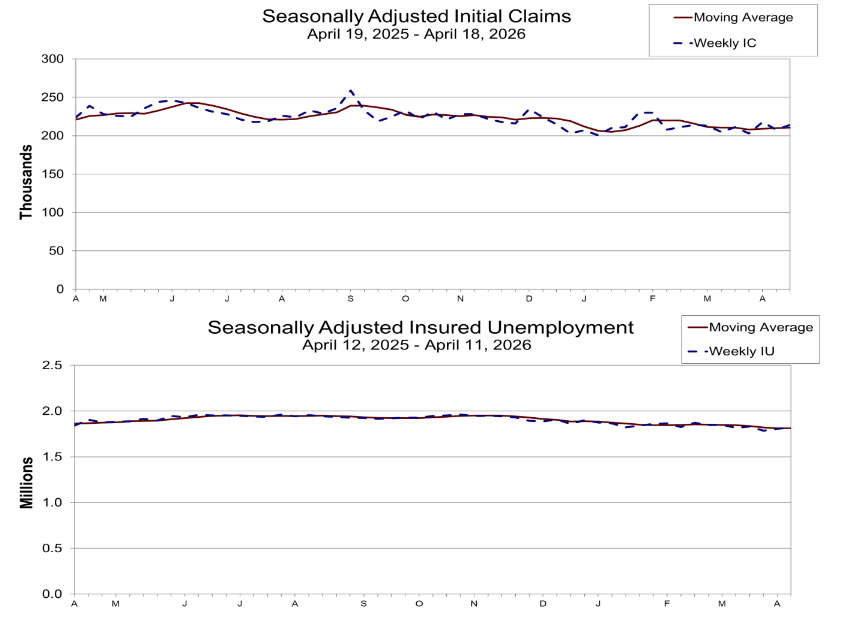
US initial jobless claims ticked up by 6k to 214k in the week ending April 18, above expection of 210k. Four-week average also edged higher to 210.75k. Read More.
UK PMI Composite rises to 52.0 and Manufacturing Surges to 47-Month High
PMI data shows the UK economy rebounding, but inflation pressures are rising fast. The recovery may not last if the crisis drags on. Read More.
Eurozone PMI Composite Falls to 48.6, Signals -0.1% GDP Contraction in Q2
Eurozone PMI drops below 50 as war-driven energy costs hit services and push inflation higher, signaling -0.1% GDP contraction. Read More.
Japan PMI Composite Falls to Four-Month Low, Out Prices Hit Record
Manufacturing is driving Japan’s growth, but services are losing momentum and costs are rising fast. The divergence is becoming harder to ignore. Read More.
Australia Composite PMI Back in Expansion, Price Pressures Highest in Nearly Four Years
Australia PMI Composite returned to growth at 50.1 in April, led by services rebound. Manufacturing output weakened while rising fuel and shipping costs lifted inflation pressures to highest in nearly four years. Read More.
USD/JPY Mid-Day Outlook
Daily Pivots: (S1) 159.20; (P) 159.38; (R1) 159.66; More...
USD/JPY edged higher today, but remains bounded in established range below 160.45. Intraday bias remains neutral and more consolidations could still be seen. Further rise is expected with 157.49 cluster support (38.2% retracement of 152.25 to 160.45 at 157.31) intact. On the upside break of 160.45 will target a retest on 161.94 high. However, firm break of 157.31/49 will bring deeper fall back to 61.8% retracement at 155.38 next.
In the bigger picture, outlook is unchanged that corrective pattern from 161.94 (2024 high) should have completed with three waves at 139.87. Larger up trend from 102.58 (2021 low) could be ready to resume through 161.94. This will remain the favored case as long as 55 W EMA (now at 153.80) holds. Firm break of 161.94 will pave the way to 61.8% projection of 102.58 to 161.94 from 139.87 at 176.75.
US Initial Unemployment Claims Edge Higher to 214k
US initial jobless claims ticked up by 6k to 214k in the week ending April 18, above expectation ion of 210k. Four-week average also edged higher to 210.75k.
Continuing claims rose by 12k to 1.821M in the week ending April 11, suggesting a modest increase in the number of people staying on unemployment benefits. Four-week moving average of continuing claims rose 1k to 1.812M.
EUR/USD Falls for Third Day as Geopolitics and Strong Dollar Dictate Terms
EUR/USD has declined steadily, falling to 1.1688 on Thursday. The US dollar has returned to ten-day highs amid a lack of progress in US-Iran peace talks, boosting demand for the currency as a safe-haven asset.
The Strait of Hormuz remains effectively closed. Tehran continues to control this strategically vital waterway, with reports indicating it has previously seized two vessels in the area. At the same time, the US blockade of Iranian ports persists, contributing to higher energy prices and increasing risk for inflation.
Meanwhile, US President Donald Trump stated that the current truce will remain in force indefinitely, as Washington awaits a new peace proposal from Iran.
Investors remain concerned about US inflation, reinforcing expectations that the Federal Reserve will keep interest rates unchanged for the remainder of the year. Earlier, Fed nominee Kevin Warsh emphasised the importance of maintaining the central bank's independence from the White House.
Market focus now shifts to weekly jobless claims and PMI data, which should provide further insight into the outlook for the US economy.
Technical Analysis
On the H4 chart, EUR/USD is trading within a consolidation range around 1.1736, currently extending down to 1.1693. The pair is likely to move lower towards 1.1680. The MACD indicator supports this scenario, with its signal line below zero and pointing firmly downwards, indicating sustained bearish momentum.
On the H1 chart, EUR/USD is developing a move lower towards 1.1680. A corrective rebound to 1.1711 may follow, before a further decline towards 1.1620. The Stochastic oscillator confirms this view, with its signal line below 20 and pointing firmly downwards, suggesting continued short-term downside pressure.
Conclusion
EUR/USD has declined for a third consecutive session amid geopolitical tensions and a stronger dollar. The lack of progress in US-Iran peace talks, combined with Tehran's control over the Strait of Hormuz and the ongoing US blockade of Iranian ports, has kept energy prices elevated and inflation risks in focus. Trump's indication that the truce will remain in place indefinitely, pending a new proposal from Iran, offers little immediate relief. With markets now pricing in no Fed rate cuts this year and key US data approaching, the euro remains under pressure. Technical signals suggest further downside towards 1.1680, and potentially to 1.1620 in the near term.
UK PMI Composite rises to 52.0 and Manufacturing Surges to 47-Month High
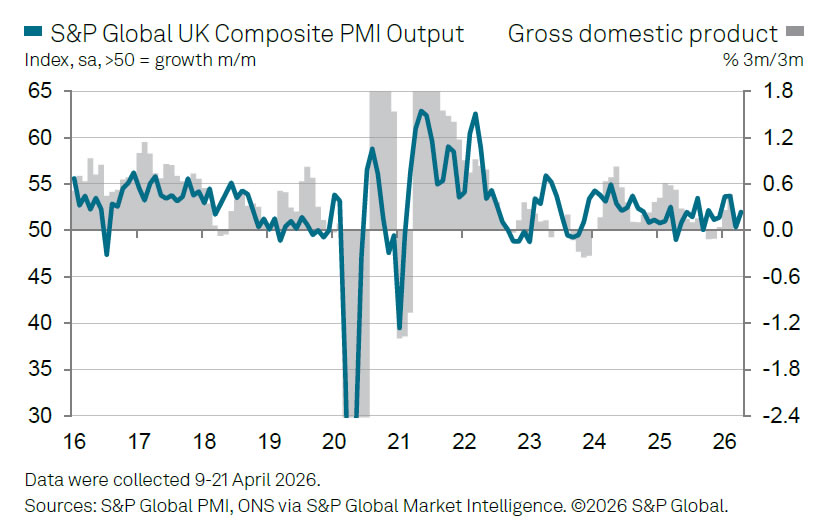
UK business activity picked up in April, with the Flash PMI Composite rising from 50.3 to 52.0, a two-month high. Services activity rose from 50.5 to 52.0. Manufacturing PMI jumped from 51.0 to 53.6, the highest level in nearly four years, with output returning to expansion at 51.8, up from 49.2. However, much of this strength appears to be driven by front-loaded demand, as firms rush to secure inputs and build inventories ahead of expected supply disruptions.
That urgency is being fueled by rising costs. Price pressures have surged at one of the fastest rates outside of the pandemic period, driven not only by higher energy prices but also broader supply concerns. Supply chain delays have also intensified, reaching levels rarely seen outside crisis periods, adding further upward pressure to prices.
The survey underscores the increasingly difficult trade-off facing the Bank of England. The sharp spike in price pressures is likely to intensify calls for further rate hikes to contain inflation. However, policymakers cannot ignore the growing signs of fragility in demand and confidence.
While April’s PMI points to a modest rebound from March, consistent with around 0.2% quarterly growth, the underlying details—softening employment, weaker sentiment, and supply-driven activity—suggest that this pace may prove short-lived if the crisis persists.
| Indicator | Apr | Mar |
|---|---|---|
| PMI Composite | 52.0 | 50.3 |
| PMI Services | 52.0 | 50.5 |
| PMI Manufacturing | 53.6 | 51.0 |
| Manufacturing Output | 51.8 | 49.2 |
| GDP Signal | ~0.2% qoq | Flat |
Eurozone PMI Composite Falls to 48.6, Signals -0.1% GDP Contraction in Q2
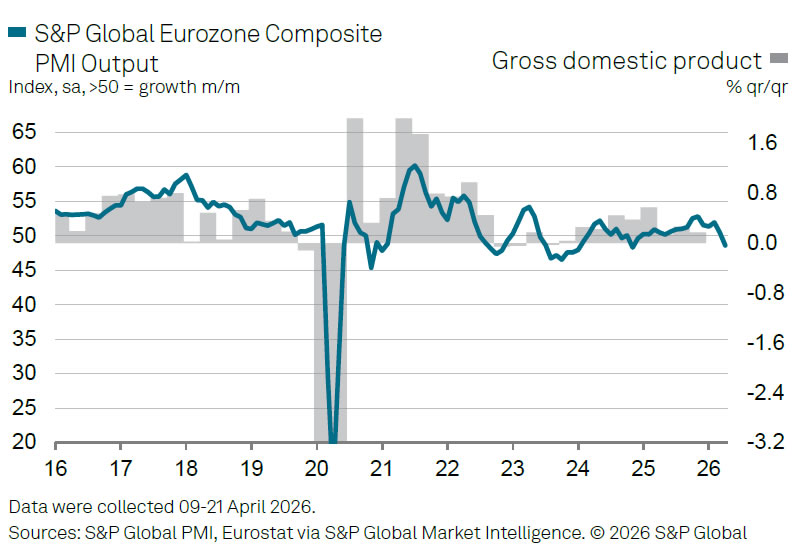
Eurozone business activity slipped back into contraction in April, with the Flash Composite PMI dropping from 50.7 to 48.6, a 17-month low. The downturn was driven primarily by a sharp deterioration in the services sector, where activity fell from 50.2 to 47.4, the weakest level in over five years.
The services slump highlights the growing impact of the Middle East conflict on the broader economy. Rising energy costs and supply disruptions are weighing heavily on demand, pushing activity down at a pace not seen since the pandemic period. The data suggests the Eurozone is already entering a mild contraction, with GDP expected to shrink slightly by -0.1% in the second quarter.
In contrast, manufacturing continues to show resilience. Output edged up from 52.0 to 52.2, while the headline PMI rose to from 51.6 52.2, the highest in nearly four years. However, this strength appears less encouraging beneath the surface. Much of the growth is being driven by "stock building" as firms rush to secure inputs ahead of further price increases and supply shortages.
Price pressures are intensifying sharply. Input costs and output prices have surged at the fastest rates since 2000 outside of the pandemic, reflecting higher energy prices and broader commodity inflation.
| Indicator | Apr | Mar |
|---|---|---|
| PMI Composite | 48.6 | 50.7 |
| PMI Services | 47.4 | 50.2 |
| Manufacturing PMI | 52.2 | 51.6 |
| Manufacturing Output | 52.2 | 52.0 |
Crypto Market Pauses as Bitcoin Holds Firm
Market Overview
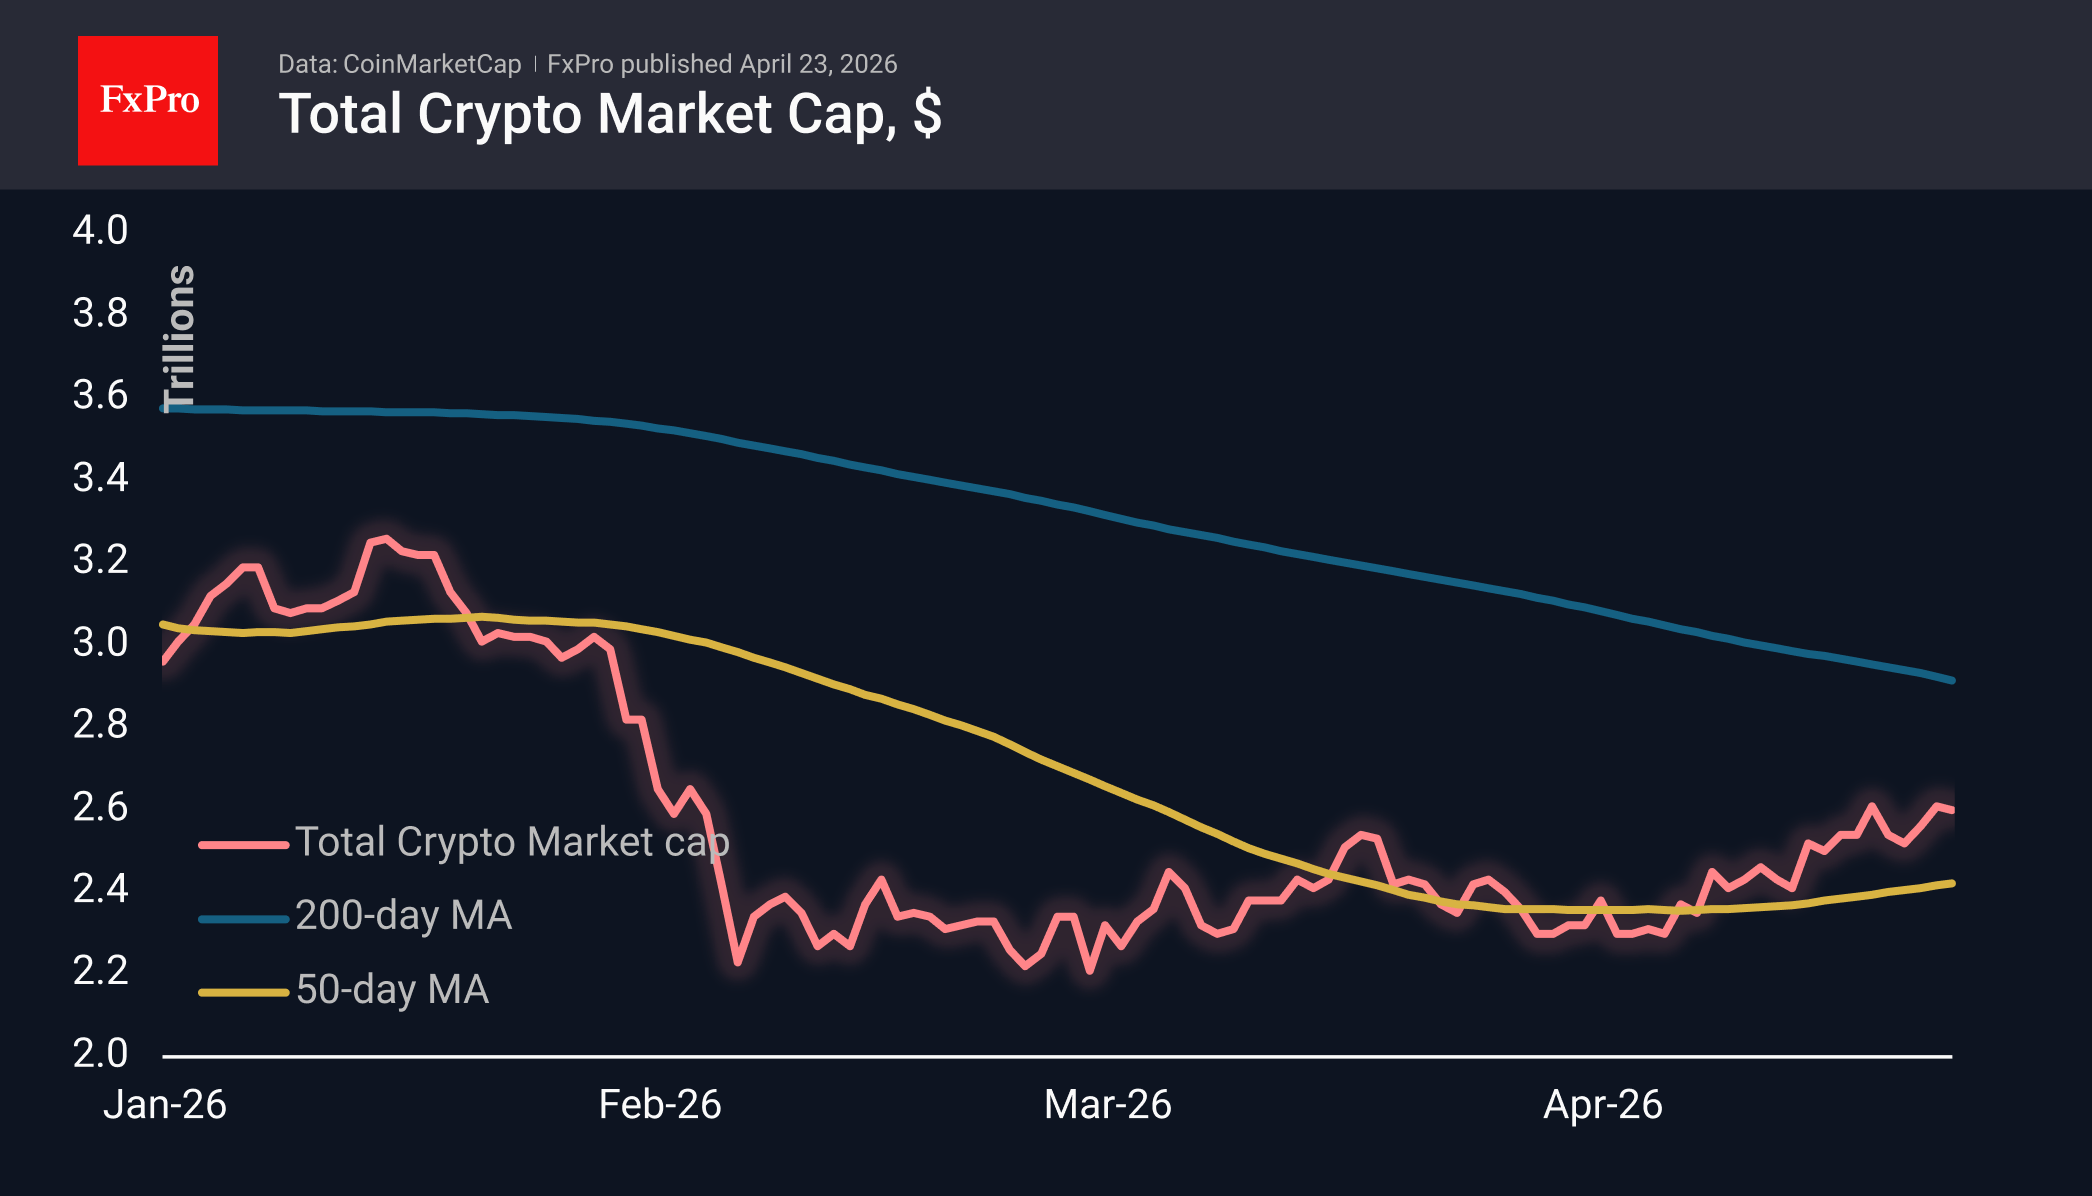
The crypto market capitalisation has fallen by 0.8% over the past 24 hours to $2.6 trillion, driven by pressure on altcoins, while Bitcoin has been pulling the market upwards, a relatively unusual situation. Leading the day’s gains with fairly modest figures were Bitcoin (+0.4%), Hedera (0%) and Aptos (0%). The corrective pullback is more pronounced, with losses of 5% for Dash, 4.9% for Theta and 4.8% for Basic Attention Token.
Sentiment continues to improve rapidly, with the corresponding index rising to 46 — a high not seen in over three months.
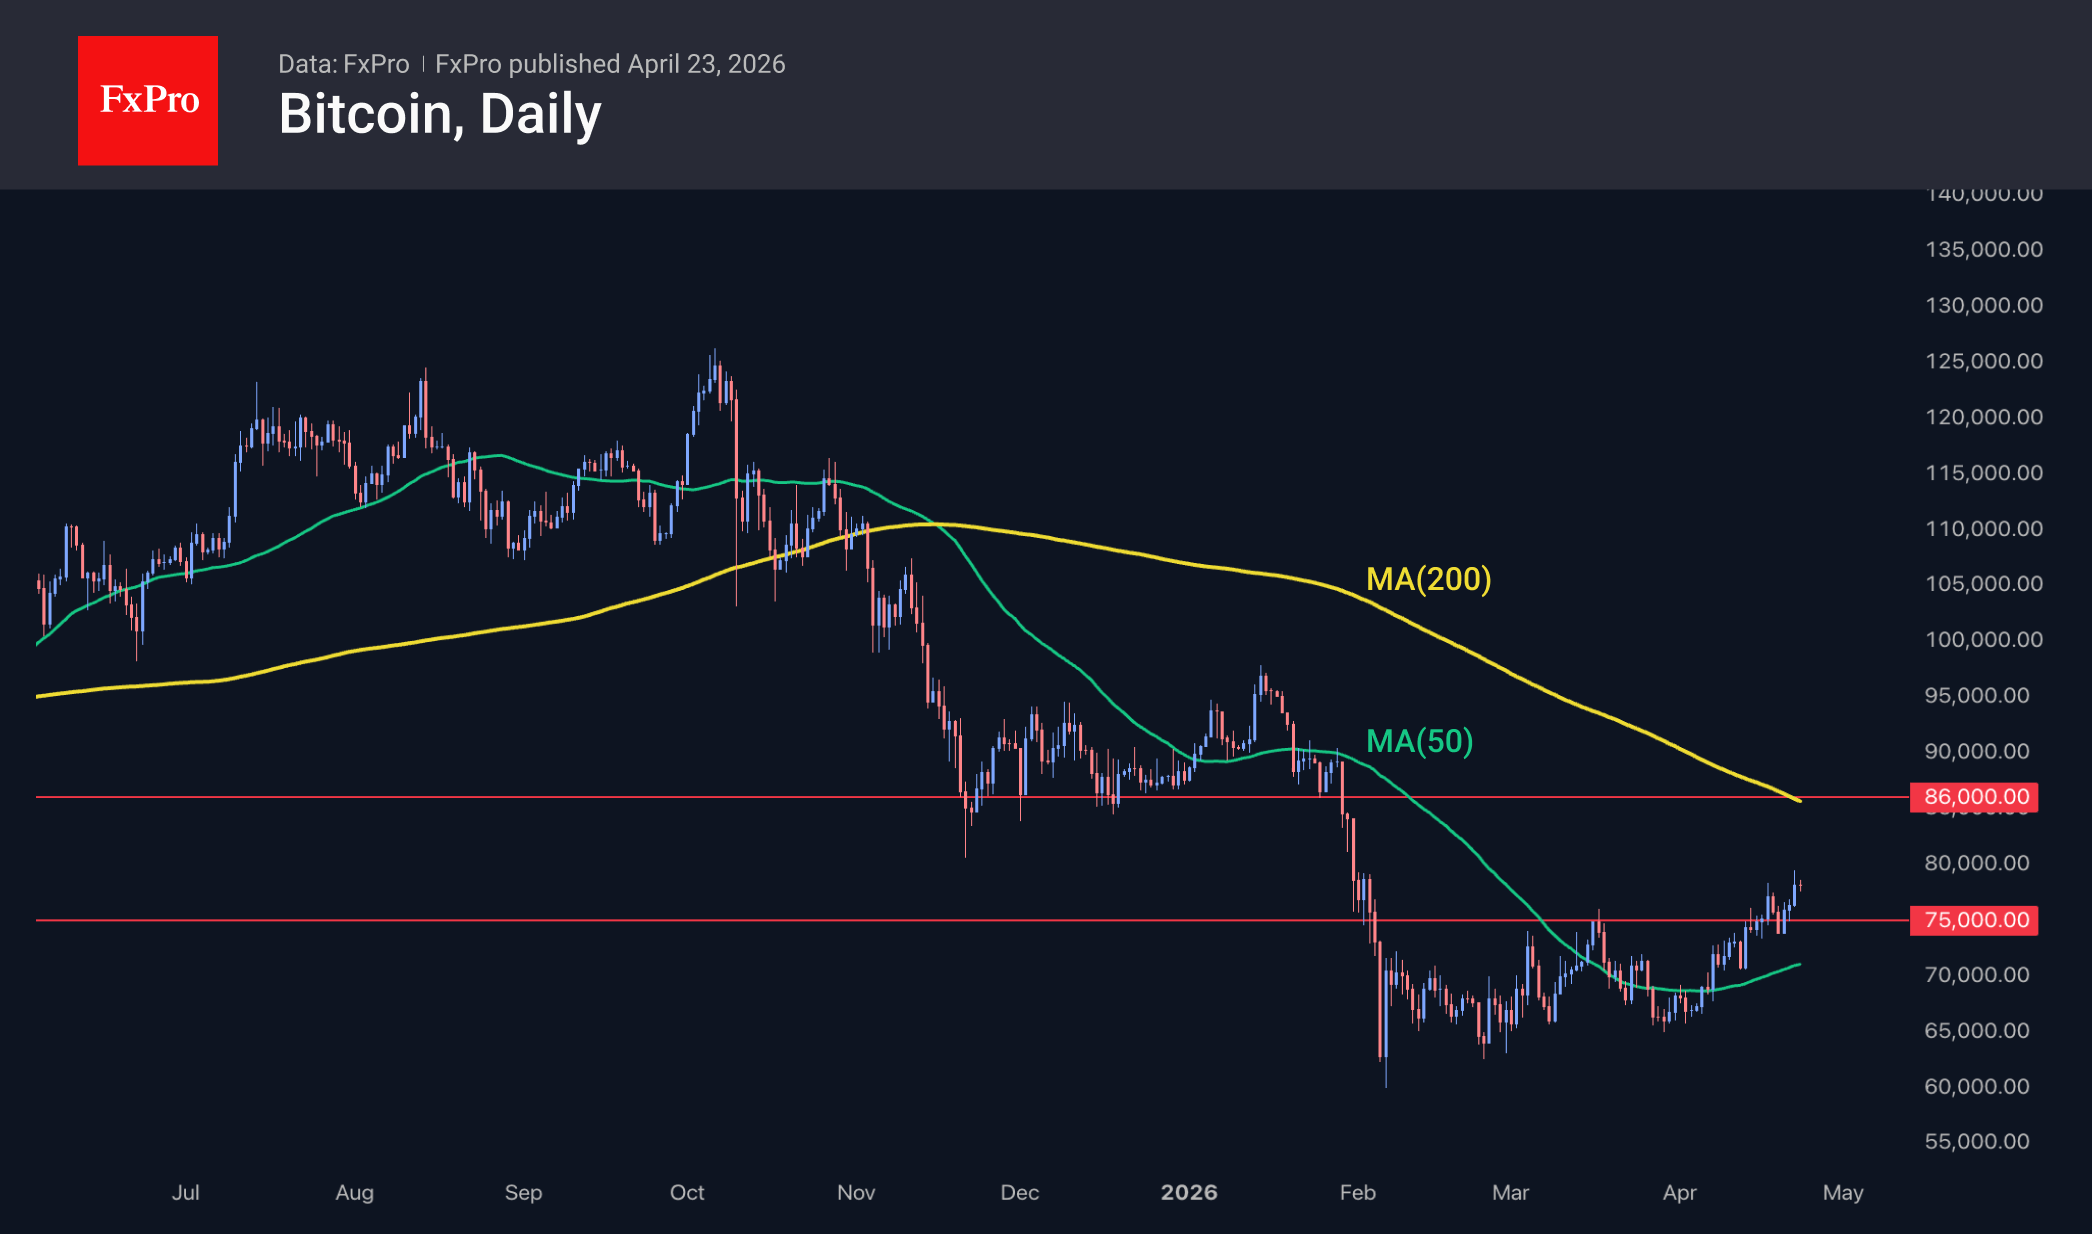
On Wednesday evening, Bitcoin briefly exceeded $79K, confirming our view of relatively weak resistance in the $75–86K range. This was the positive side of the close correlation with traditional financial markets. The flip side of this correlation was a pause in growth as key indices pulled back from all-time highs, causing the leading cryptocurrency to retreat to the $78K range.
News Background
The Volo liquid staking protocol on the Sui blockchain lost $3.5 million due to a hack. According to estimates by Memento Research, April was the worst month for the decentralised finance (DeFi) sector in terms of losses. The largest incidents involved the Drift and Kelp protocols, with combined losses approaching $600 million.
Within a few days of the Kelp hack, users withdrew $15.1 billion from the Aave lending protocol, notes EmberCN. Aave, the largest decentralised lending protocol, found itself at the centre of a systemic DeFi crisis after hackers used it to withdraw funds stolen from Kelp.
Tron founder Justin Sun has filed a lawsuit in a California federal court against Donald Trump’s family crypto platform, World Liberty Financial, claiming that his WLFI tokens were frozen without cause and threatened with destruction.
New York has sued crypto exchanges Coinbase and Gemini over contracts on the prediction market that violate gambling laws. The lawsuit follows several similar proceedings in other states. There is a possibility that the case will reach the US Supreme Court.
Trump’s nominee for Fed chair, Kevin Warsh, expressed support for cryptocurrencies during his testimony before the US Senate. According to him, digital assets “have already become an integral part of the US financial services industry”.