Sample Category Title
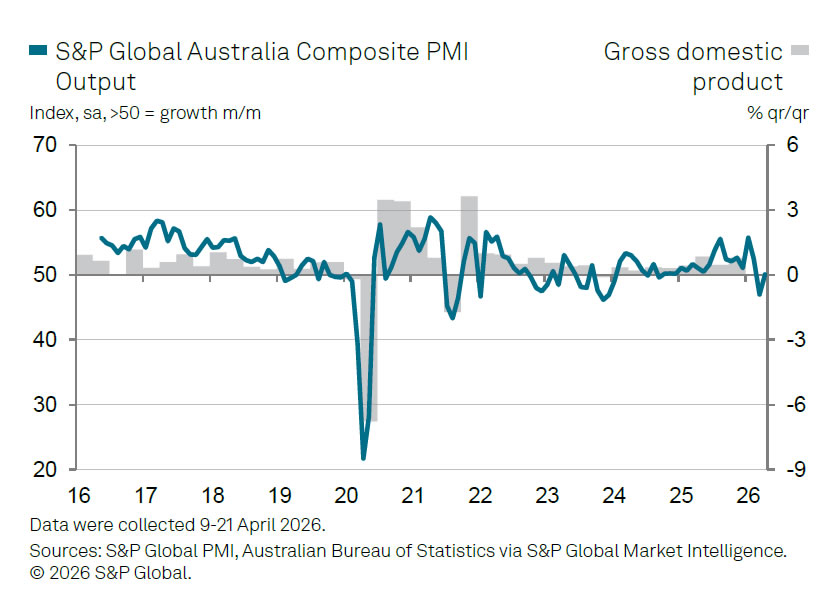
Australia Composite PMI Back in Expansion, Price Pressures Highest in Nearly Four Years
Australia’s private sector returned to modest growth in April, with the S&P Global Flash Composite PMI rising from 46.6 to 50.1, just crossing back above the expansion threshold. The improvement was driven by a sharp rebound in services, where PMI jumped from 46.3 to 50.3, signaling stabilization after March’s contraction.
However, the recovery remains uneven. Manufacturing PMI rose from 49.8 to 51.0, back into expansion territory, but output within the sector fell further from 49.4 to 48.2. This divergence suggests that while sentiment and headline activity improved, actual production conditions remain under pressure, reflecting ongoing disruptions in supply chains.
Cost pressures are intensifying. Input price inflation accelerated for a third consecutive month, reaching its highest level since August 2022, driven largely by higher fuel and shipping costs linked to the Middle East conflict. Businesses are passing on part of these increases, with output prices rising at the fastest pace in three-and-a-half years.
Overall, the data points to a fragile recovery. Services are providing near-term support, but manufacturing remains constrained, and inflation pressures are building again.
| Indicator | Apr 2026 | Mar 2026 |
|---|---|---|
| PMI Composite | 50.1 | 46.6 |
| PMI Services | 50.3 | 46.3 |
| PMI Manufacturing | 51.0 | 49.8 |
| Manufacturing Output | 48.2 | 49.4 |
| Input Cost Inflation | ↑ | ↑ |
| Output Price Inflation | ↑ | ↑ |
| Supply Chain Lead Times | Lengthened | — |
| Demand / Confidence | Soft | Soft |
Cryptos Breakout of Bear Trends, But Will It Continue? Bitcoin (BTC) & Ethereum (ETH) Outlook
- Bitcoin reaches $79,000 in daily trading and tests a breakout of its main October descending channel
- Profiting from the rebound and new inflows in tech, exploring if Crypto has enough momentum to keep bouncing
- Exploring a Technical Analysis and trading levels for Bitcoin and Ethereum
Only 13 days since our last Crypto in-depth analysis, Bitcoin has surged an additional $7,000, (10%!) and Ethereum has broken through several major resistance levels, back to $2,400.
While altcoins are slowly gathering momentum, the spotlight remains firmly on the largest, highest-cap cryptocurrencies, with the rest still struggling to catch up as Investors still aim to pick up the highest quality names in case the narrative shifted again for the worst.
Nevertheless, the total crypto market cap is extending gains at levels similar to last Friday, clearly dominating the February lows – A very positive sign but this move will need further traction to avoid forming a short-term double top.
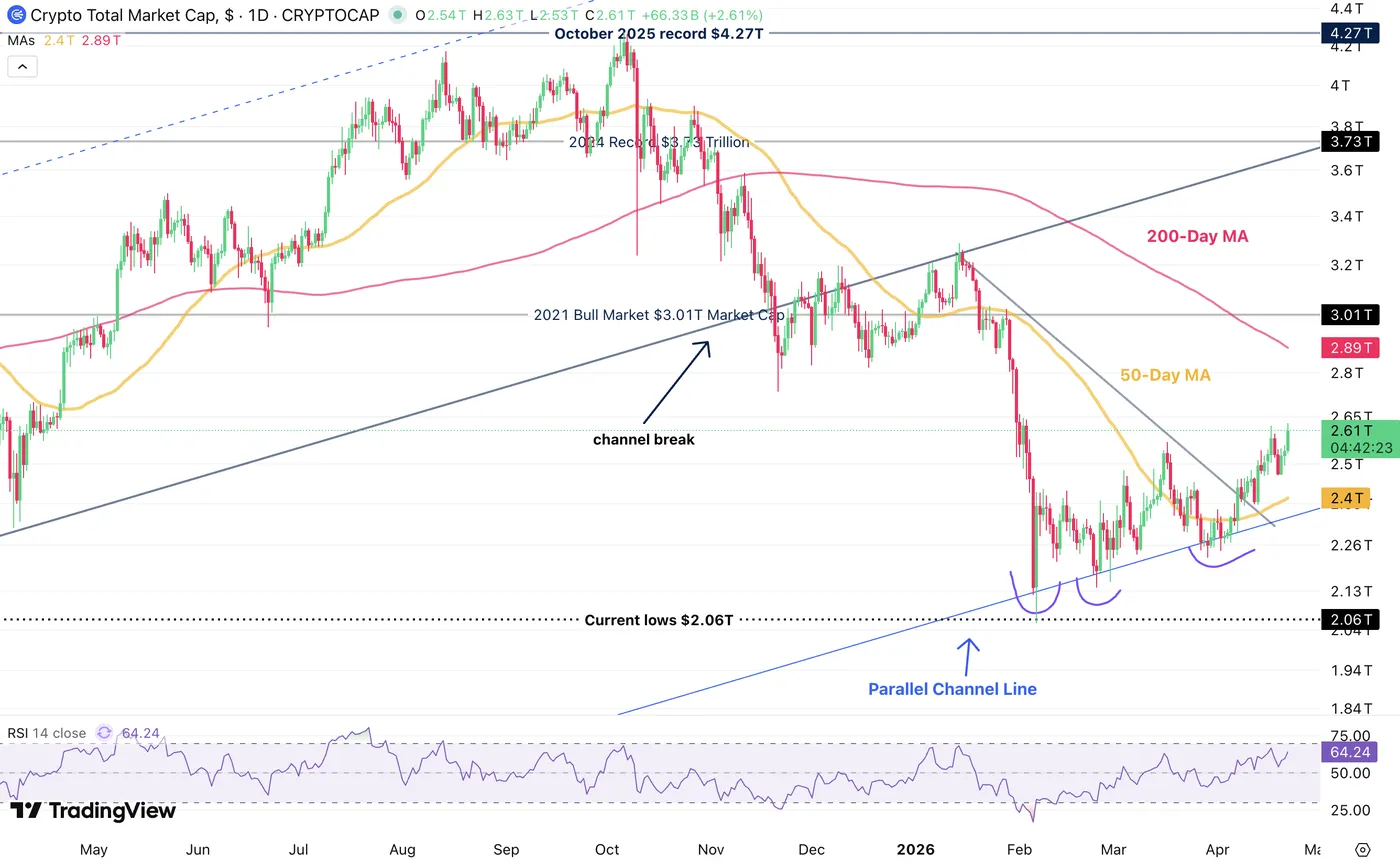
Total Crypto Market Cap – Daily Chart. April 22, 2026 – Source: TradingView
Extending beyond $2.65T will be key for the next phase of the rebound.
The coming days will present a particularly key test with the well-anticipated peace talks; In the event of a tumble in negotiations, Participants will be watching closely to see if crypto truly behaves as the safe haven its proponents claim, or if it remains just another risk asset.
So far, cryptocurrencies have maintained a strong correlation with the Nasdaq.
However, while the tech index has reclaimed its all-time highs, Bitcoin is now testing a major breakout at $79,000 as it challenges the upper boundary of its main October descending channel.
The big question now is whether cryptos will decouple from equities in the event of a stock market downturn—a factor that could determine if Bitcoin and its peers are truly poised to return to record highs.
Profiting from renewed tech sector inflows, the priorly dormant Crypto markets are exploring whether there is enough momentum to sustain this bounce.
Let's dive right into a technical analysis and key trading levels for both Bitcoin and Ethereum to spot if a clear breakout in indeed into play from here.
Bitcoin (BTC) 4H Chart and Technical Levels
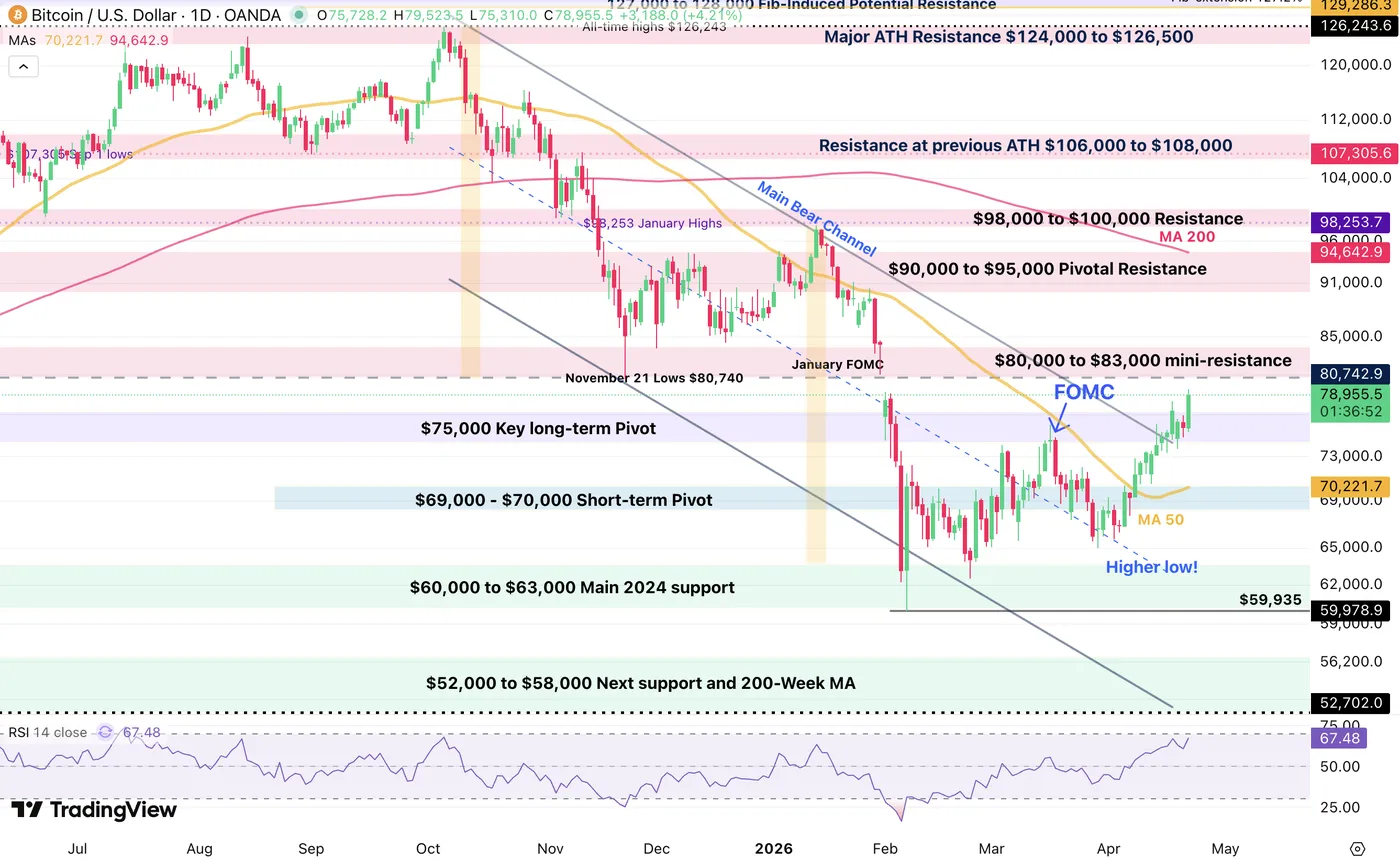
Bitcoin (BTC) 4H Chart, April 22, 2026 – Source: TradingView
Bitcoin is now clearly extending above its $75,000 long-term pivot, a quintessential level of action for the Bulls to dominate the next phase and an even better run as traders finally broke out of the October bear channel.
For buyers to continue the run, with the RSI momentum coming closer to overbought, they will have to at least break above the $80,000 level – They do have the intermediate momentum in hand however.
Failing to break the level could however provide a decent opportunity for profit-takers to stall the move.
Levels of interest for BTC trading:
Support Levels:
- $75,000 Key long-term Pivot (acting as resistance)
- $70,000 Short-term momentum Pivot (50 and 200-4H MA)
- $60,000 to $63,000 Main 2024 support (recent double bottom)
- $59,935 February Lows
- $52,000 to $58,000 Next support and 200-Week MA ($55,000 Mid-point)
- $40,000 Mid-2024 breakout support
Resistance Levels:
- $79,100 Daily Highs
- $80,000 to $83,000 mini-resistance
- $90,000 to $95,000 minor Resistance
- $98,000 to $100,000 Pivotal Resistance
- Current ATH Resistance $124,000 to $126,000
Ethereum (ETH) 4H Chart and Technical Levels
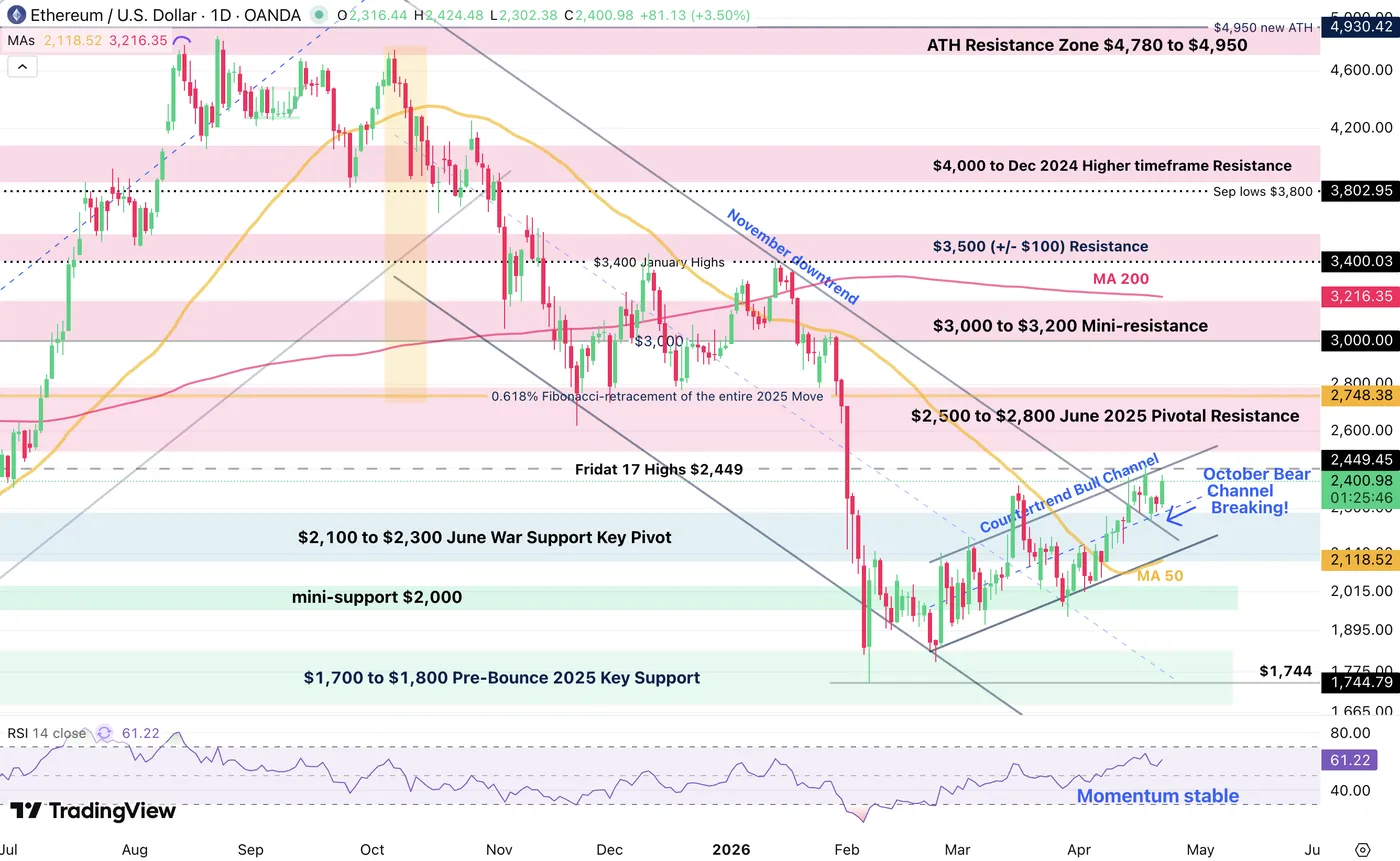
Ethereum (ETH) 4H Chart, April 22, 2026– Source: TradingView
The rebound in Ethereum remains very consistent, having also officially broken out of its descending channel.
ETH bulls will have to breach the $2,450 highs reached last Friday to confirm a breakout, but overall are well in control of the action.
Entering the $2,500 pivotal resistance within the next week should maintain high odds of a continued breakout – With Momentum not close to overbought, ETH buyers still have space to push.
Shorter timeframes are hinting at a slowdown, so traders will have to be careful for the next phase.
Levels of interest for ETH trading:
Support Levels:
- 4H 50 and 200 MA $2,118
- Channel lows $2,000
- $1,700 to $1,800 Pre-Bounce 2025 Key Support (testing)
- $1,744 February 6 lows
- $1,380 to $1,500 2025 Support
- 2025 Lows $1,384
Resistance Levels:
- March 4 Highs $2,201 (breaking!)
- $2,300 June War Key Pivot (bullish above)
- $2,500 to $2,700 June 2025 Key Support now Resistance (Channel Highs)
- $3,000 to $3,200 Major momentum Pivot (Test of the $3,000)
- $4,950 Current new All-time highs
The narrative is easing, but keep track of WTI Crude and the latest headlines to stay ahead of the game.
Safe Trades!
Nasdaq Breaks a New Record after Ceasefire Extension – Dow Jones and US Stock Market Outlook
- US Stock Benchmarks corrected yesterday from a reappearing angst regarding the Ceasefire and Kevin Warsh's hawkish hearing
- Donald Trump saved the day by announcing yet another short-term extension to the Ceasefire
- Exploring Technical Levels for the Dow Jones, Nasdaq and S&P 500
US stock benchmarks experienced a sharp correction yesterday, dragged down by reappearing angst over a collapsing US-Iran ceasefire and incoming Fed Chair Kevin Warsh’s hawkish Senate hearing.
However, President Trump quickly swooped in to save the day, announcing yet another short-term extension to the fragile truce.
While Trump has yet to set an official timeline for this new ceasefire extension, recent reports suggest that high-stakes talks with the Iranian delegation are now possible by Friday.
This crucial geopolitical lifeline allowed investors to aggressively buy the dip and erase the pain from yesterday's selloff.
By doing so, buyers successfully voided the ominous double-top formation that was threatening the Nasdaq, sending the tech-heavy index skyrocketing back to fresh all-time highs – the S&P 500 is still threatened by its double-top however.
Technology continues to relentlessly lead the broader market.
The Nasdaq is currently outperforming all other global benchmarks as US bulls keep flexing their insatiable risk appetite.
This tech-lead rally is directly spilling over into the crypto space as well, with Bitcoin surging to new highs and closing in fast on the massive $80,000 milestone.
Expect volatility to remain elevated as markets eagerly await further confirmation regarding Friday's potential diplomatic meetings and traders will have to see proper developments to maintain the current optimism.
Let's dive into intraday charts and trading levels for the Dow Jones Industrial Average, Nasdaq Composite, and S&P 500.
Current Session's Stock Heatmap
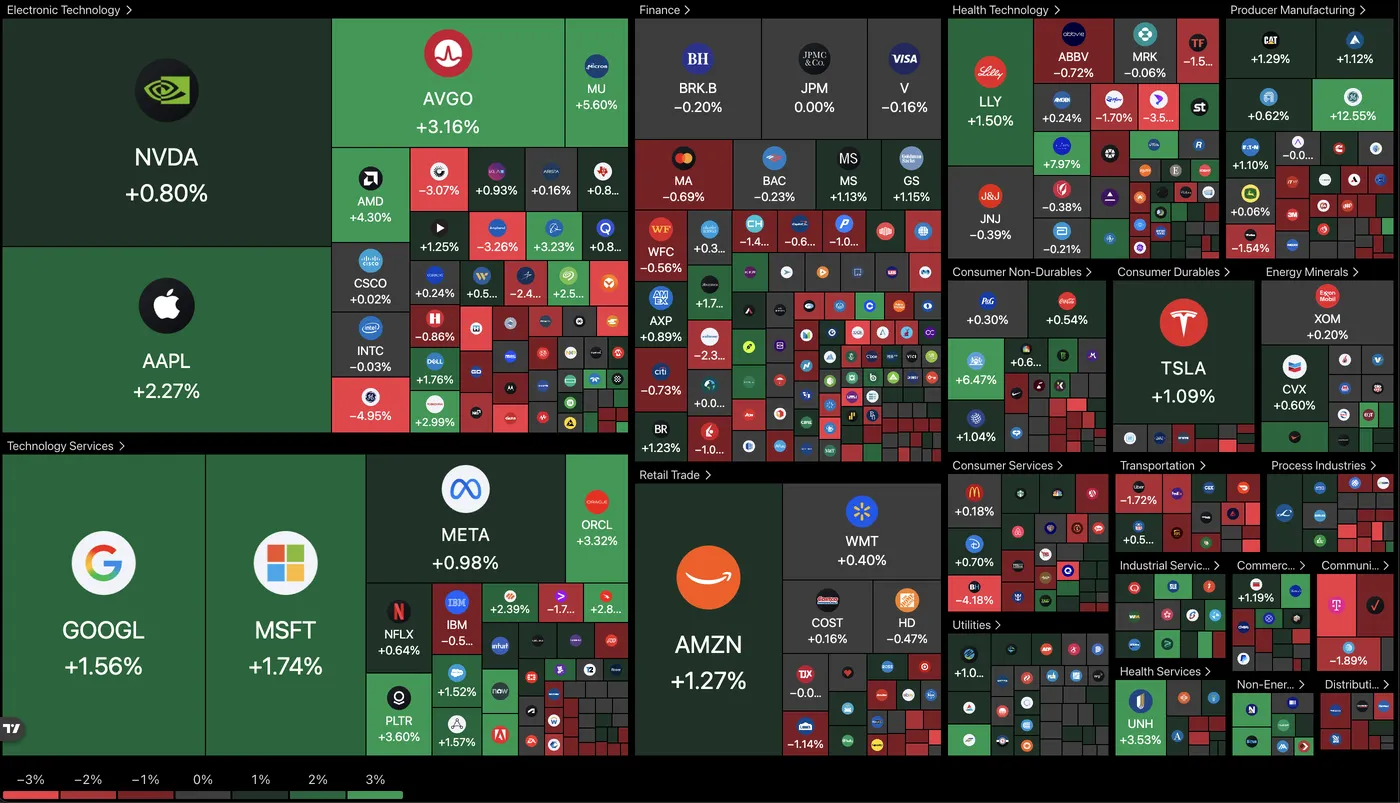
Current picture for the Stock Market (11:21) – Source: TradingView – April 22, 2026
The Stock Market is mostly green, but under some heavy sectorial inequality as investors still focus on local targeted plays, with a preference for value in the already high-cap Magnificent 7s, outperforming all other Stocks and helping to propel Nasdaq on top.
Dow Jones 2H Chart and Trading Levels
Dow Jones (CFD) 2H Chart – April 22, 2026 – Source: TradingView
The DJIA is slowly creeping higher but still lacks some conviction.
Bulls will want to see an extension above 49,600 to confirm a test of 50,000.
However, as long at the action remains above the 2H 50-period MA, bulls remain in control.
Dow Jones technical levels for trading:
Resistance Levels
- Weekend Gap Fill Resistance 49,500 - 49,600 (testing)
- 49,900 to 50,000 Resistance and Early 2026 Highs
- All-Time Highs 50,544
Support Levels
- 2H 50-period MA (49,300)
- Major Pivot – 49,000 to 49,200 (short-term bearish below)
- Momentum Support 48,500
- Pivotal Support at 48,000 (Mid-term Bearish below)
- Mini Support 47,400 to 47,600
Nasdaq 2H Chart and Trading Levels
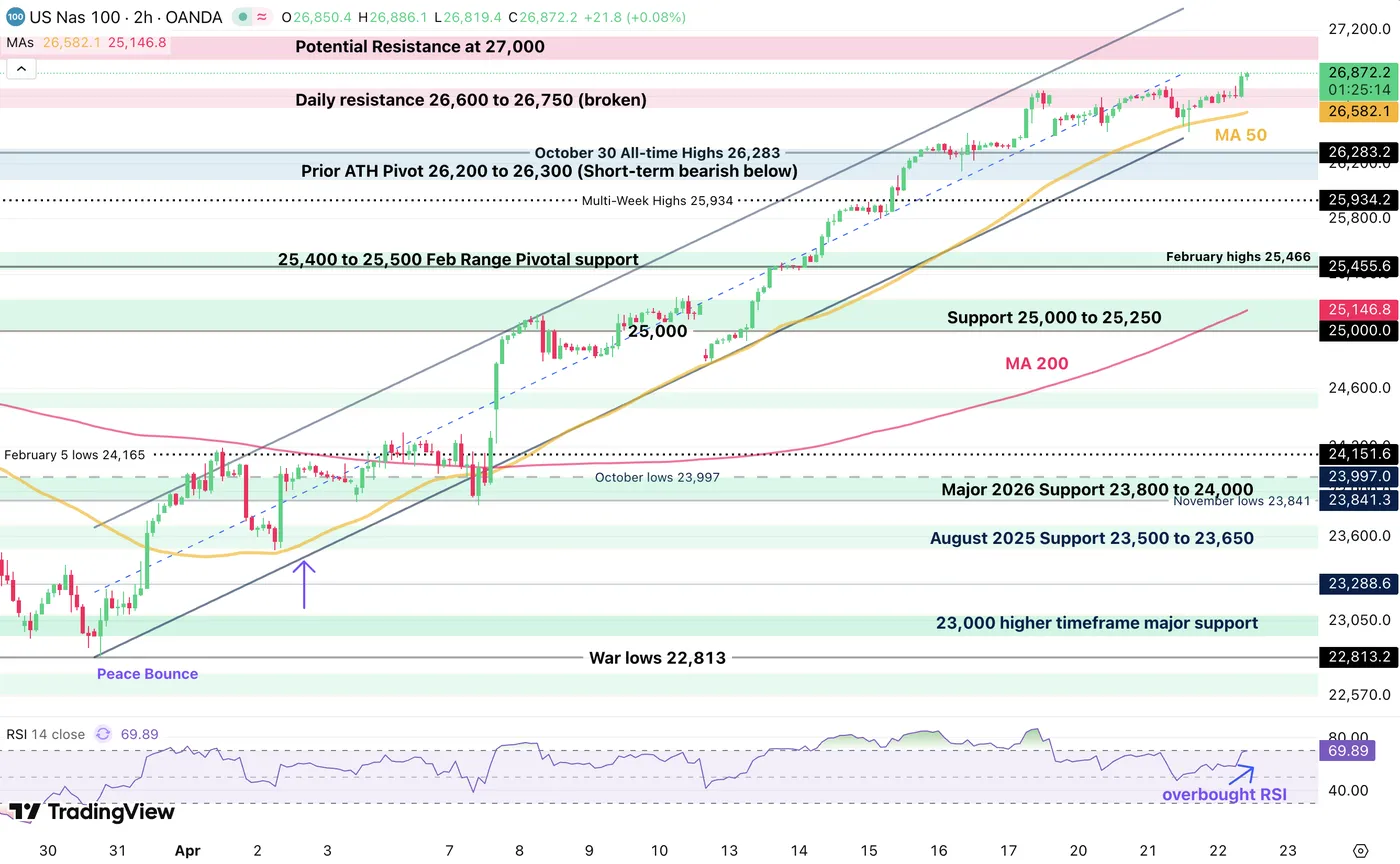
Nasdaq (CFD) 2H Chart – April 22, 2026 – Source: TradingView
Nasdaq is officially breaching some new all-time highs and running towards 27,000.
Momentum is stalling about 100 points to the psychological level with RSI reaching overbought conditions, so a newfound momentum will have to be found.
Still, the path of least resistance on the short-run is to the upside for the index.
- The situation turns more bearish short-term if sellers bring back the action below 26,580 (2H 50-period MA)
Nasdaq technical levels of interest:
Resistance Levels
- Daily resistance 26,600 to 26,750
- New all-time highs 26,736
- Potential Resistance at 27,000
Support Levels
- 26,580 (2H 50-period MA)
- Prior ATH Pivot 26,200 to 26,300 (Short-term bearish below)
- 25,400 to 25,500 Feb Range Intraday Support
- War Support 25,000 to 25,250
- 24,450 to 24,550 Key Support
- Early 2025 ATH at 22,000 to 22,229 Support
S&P 500 2H Chart and Trading Levels
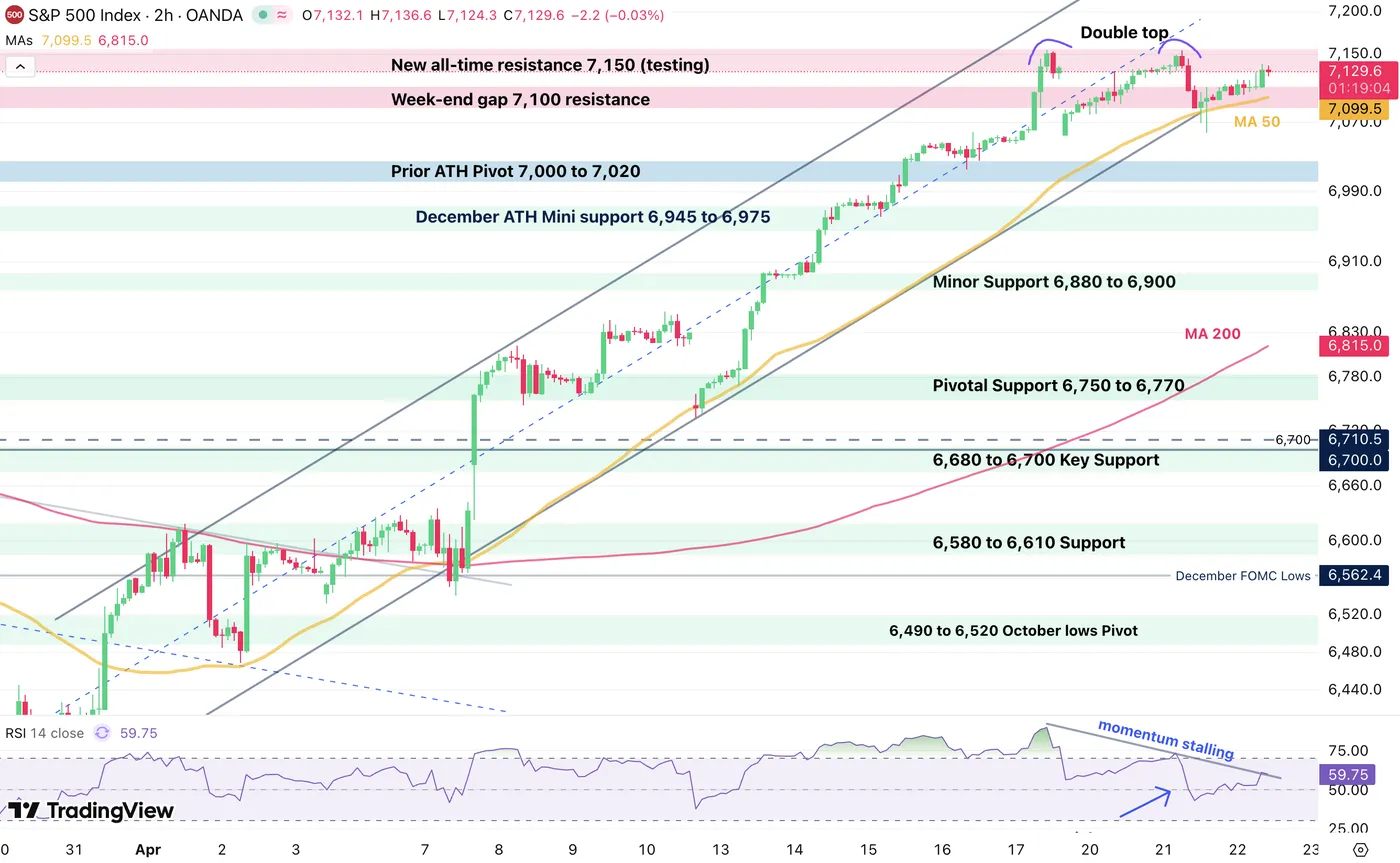
S&P 500 (CFD) 2H Chart – April 22, 2026 – Source: TradingView
The S&P 500 is attempting an extension to retest its all-time highs, but the momentum is not coinciding with a proper bullish price action.
The daily highs are at 7,138 and those will have to be surpassed in order to properly undo the Double top formation.
S&P 500 technical levels of interest:
Resistance Levels
- Daily highs 7,138
- New all-time resistance 7,150
- Next key potential resistance 7,200
Support Levels
- 7,100 psychological level and 2H 50-period MA
- Prior ATH Pivot 7,000 to 7,020
- December ATH Mini support 6,945 to 6,975
- Minor Support 6,880 to 6,900
- Pivotal Support 6,750 to 6,770
- 6,680 to 6,700 Key Support
- 6,300 psychological level (War lows)
Keep track of WTI Crude and the latest headlines throughout the week to stay ahead of the curve, with investors still confused about US-Iran negotiations.
Safe Trades!
Natural Gas Wave Analysis
Natural Gas: ⬆️ Buy
- Natural Gas reversed from support area
- Likely to rise to resistance level 3.080
Natural Gas recently reversed from the support area between the strong support level 2.675 (which stopped the previous sharp downward impulse from the start of December) and the lower daily Bollinger Band.
The upward reversal from this support zone started the active short-term correction ii.
Given the strength of the support level 2.675, Natural Gas can be expected to rise to the next resistance level 3.080 (top of the previous correction ii).
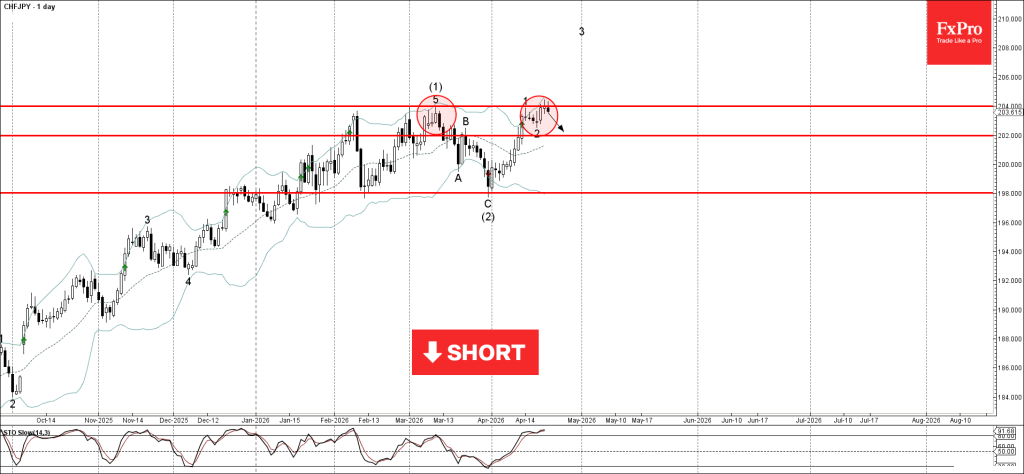
CHFJPY Wave Analysis
CHFJPY: ⬇️ Sell
- CHFJPY reversed from resistance zone
- Likely to fall to support level 202.00
CHFJPY currency pair recently reversed from the resistance zone between the strong resistance level 204.00 (which stopped wave () in March) and the upper daily Bollinger Band.
The downward reversal from this resistance zone stopped the previous minor impulse wave 3, which belongs to the intermediate impulse wave (3).
Given the strength of the resistance level 204.00, CHFJPY can be expected to fall to the next support level 202.00 (low of the previous correction 2).
Eco Data 4/23/26
| GMT | Ccy | Events | Act | Cons | Prev | Rev |
|---|---|---|---|---|---|---|
| 23:00 | AUD | Manufacturing PMI Apr P | 51 | 49.8 | ||
| 23:00 | AUD | Services PMI Apr P | 50.3 | 46.3 | ||
| 00:30 | JPY | Manufacturing PMI Apr P | 54.9 | 51.2 | 51.6 | |
| 00:30 | JPY | Services PMI Apr P | 51.2 | 53.4 | ||
| 06:00 | GBP | Public Sector Net Borrowing (GBP) Mar | 12.6B | 10.3B | 14.3B | 12.8B |
| 07:15 | EUR | France Manufacturing PMI Apr P | 52.8 | 49.5 | 50 | |
| 07:15 | EUR | France Services PMI Apr P | 46.5 | 48.5 | 48.8 | |
| 07:30 | EUR | Germany Manufacturing PMI Apr P | 51.2 | 51.3 | 52.2 | |
| 07:30 | EUR | Germany Services PMI Apr P | 46.9 | 50.4 | 50.9 | |
| 08:00 | EUR | Eurozone Manufacturing PMI Apr P | 52.2 | 50.7 | 51.6 | |
| 08:00 | EUR | Eurozone Services PMI Apr P | 47.4 | 49.8 | 50.2 | |
| 08:30 | GBP | Manufacturing PMI Apr P | 53.6 | 50.2 | 51 | |
| 08:30 | GBP | Services PMI Apr P | 52 | 50 | 50.5 | |
| 12:30 | CAD | Industrial Product Price M/M Mar | 2.40% | 1.80% | 0.40% | 0.60% |
| 12:30 | CAD | Raw Material Price Index Mar | 12.00% | 9.50% | 0.60% | |
| 12:30 | USD | Initial Jobless Claims (Apr 17) | 214K | 210K | 207K | 208K |
| 13:45 | USD | Manufacturing PMI Apr P | 54 | 52.5 | 52.3 | |
| 13:45 | USD | Services PMI Apr P | 51.3 | 50.1 | 49.8 | |
| 14:30 | USD | Natural Gas Storage (Apr 17) | 103B | 96B | 59B |
| 23:00 | AUD |
| Manufacturing PMI Apr P | |
| Actual | 51 |
| Consensus | |
| Previous | 49.8 |
| 23:00 | AUD |
| Services PMI Apr P | |
| Actual | 50.3 |
| Consensus | |
| Previous | 46.3 |
| 00:30 | JPY |
| Manufacturing PMI Apr P | |
| Actual | 54.9 |
| Consensus | 51.2 |
| Previous | 51.6 |
| 00:30 | JPY |
| Services PMI Apr P | |
| Actual | 51.2 |
| Consensus | |
| Previous | 53.4 |
| 06:00 | GBP |
| Public Sector Net Borrowing (GBP) Mar | |
| Actual | 12.6B |
| Consensus | 10.3B |
| Previous | 14.3B |
| Revised | 12.8B |
| 07:15 | EUR |
| France Manufacturing PMI Apr P | |
| Actual | 52.8 |
| Consensus | 49.5 |
| Previous | 50 |
| 07:15 | EUR |
| France Services PMI Apr P | |
| Actual | 46.5 |
| Consensus | 48.5 |
| Previous | 48.8 |
| 07:30 | EUR |
| Germany Manufacturing PMI Apr P | |
| Actual | 51.2 |
| Consensus | 51.3 |
| Previous | 52.2 |
| 07:30 | EUR |
| Germany Services PMI Apr P | |
| Actual | 46.9 |
| Consensus | 50.4 |
| Previous | 50.9 |
| 08:00 | EUR |
| Eurozone Manufacturing PMI Apr P | |
| Actual | 52.2 |
| Consensus | 50.7 |
| Previous | 51.6 |
| 08:00 | EUR |
| Eurozone Services PMI Apr P | |
| Actual | 47.4 |
| Consensus | 49.8 |
| Previous | 50.2 |
| 08:30 | GBP |
| Manufacturing PMI Apr P | |
| Actual | 53.6 |
| Consensus | 50.2 |
| Previous | 51 |
| 08:30 | GBP |
| Services PMI Apr P | |
| Actual | 52 |
| Consensus | 50 |
| Previous | 50.5 |
| 12:30 | CAD |
| Industrial Product Price M/M Mar | |
| Actual | 2.40% |
| Consensus | 1.80% |
| Previous | 0.40% |
| Revised | 0.60% |
| 12:30 | CAD |
| Raw Material Price Index Mar | |
| Actual | 12.00% |
| Consensus | 9.50% |
| Previous | 0.60% |
| 12:30 | USD |
| Initial Jobless Claims (Apr 17) | |
| Actual | 214K |
| Consensus | 210K |
| Previous | 207K |
| Revised | 208K |
| 13:45 | USD |
| Manufacturing PMI Apr P | |
| Actual | 54 |
| Consensus | 52.5 |
| Previous | 52.3 |
| 13:45 | USD |
| Services PMI Apr P | |
| Actual | 51.3 |
| Consensus | 50.1 |
| Previous | 49.8 |
| 14:30 | USD |
| Natural Gas Storage (Apr 17) | |
| Actual | 103B |
| Consensus | 96B |
| Previous | 59B |
Sunset Market Commentary
Markets
ECB chief economist Lane pitched the idea of expanding the supply of euro assets in a keynote speech today, one of our long-term views. He argues that the existence of a benchmark safe asset that serves as the anchor for asset pricing is a foundational element of any autonomous monetary system. Such an asset should be highly liquid and rise in relative value during stress episodes. The current EMU financial structure lacks such safe asset given that the stock of German Bunds is too small relatively to the size of the euro area or the global financial system. Lane says that common bonds backed by the combined fiscal capacity of the EU member states are capable of providing safe asset services, but the current stock of such bonds is too small at the moment even as it exploded from around €80bn outstanding before the Covid-pandemic to currently over €700bn. There’s sufficient room to expand it further though with the 2024 EU competitiveness report by Mario Draghi estimating the annual cross-border mutual funding need at €750bn. This includes European-wide public goods, but common policy imperatives such as the urgent funding of Ukraine also warrant joint borrowing. Lane floats other options as well like the recently proposed “blue bond/red bond” reform. Under this approach, each member country would ring-fence a dedicated revenue stream (a certain amount of indirect tax revenues, for example) that could be used to service commonly issued bonds. In turn, the proceeds from issuing blue bonds would be deployed to purchase a given amount of the national bonds of each participating Member State. This would result in a larger stock of common bonds (blue bonds) and a lower stock of national bonds (red bonds). Another proposal envisages that financial intermediaries (whether public or private) could bundle a portfolio of national bonds and issue tranched securities, with the senior slice constituting a highly safe asset.
Turning to today’s market moves, the stalemate persists after US president Trump announced an extension to the cease-fire last week. He believes talks are possible as soon as Friday. Visibility is extremely low though with Iran calling the US naval blockade the same as a bombardment and thus an infringement of the cease-fire. Brent crude grinds back above the $100/b mark as the headline roulette keeps spinning with EUR/USD moving further away from the 1.18 resistance mark. Stock markets are treading water with core bond yield curves flattening marginally.
News & Views
Belgian consumer confidence decline for a third consecutive month in April. At -9 (from -6), it hit the lowest level since April 2025. On a macro level, fears of unemployment are growing with the unemployment sub-index rising from -3 to 6. On a personal level; households turned more negative about their capacity to save (18 from 22) and on their overall financial situation (-5 from -3), with both subindices also touching lowest levels since April last year. Expectations concerning the general economic situation in Belgium have improved slightly compared with last month (subindex at -43 from -45) though sentiment remains pessimistic in a broader perspective (e.g. was -25 in February before the start of the conflict in the Middle East).
• The Central Bank of Turkey (CBRT) kept its policy rate unchanged at 37.5%. The CBRT also kept its overnight borrowing and lending rates unchanged at 35.5% and 40% respectively. As the central bank recently didn’t hold one-week repo auctions, the overnight rate gained importance in determining money market rates. It was the second consecutive month that the CBRT kept its policy stable after easing the policy rate from 46% to 37% over the July 2025 - Jan 2026 period. Turkish inflation eased to 1.94% M/M and 30.87% Y/Y in March to be compared with a level of 42.1 % at the start of 2025. The CBTR assesses that while the underlying trend of inflation still declined in March, leading indicators suggest a slight increase in the underlying trend in April. Geopolitical developments and resulting uncertainties are keeping energy prices elevated and are a source of volatility. Even as the recent indictors point to a slowdown in activity, the central bank indicates that potential second-round effects of recent developments on the inflation outlook will be of importance and that the committee remains highly attentive to upside inflation risks. The reaction of the Turkish lira to the rate decision was limited. At EUR/TRY 52.7; the Turkish currency still trades near historic low levels reached over the previous week.
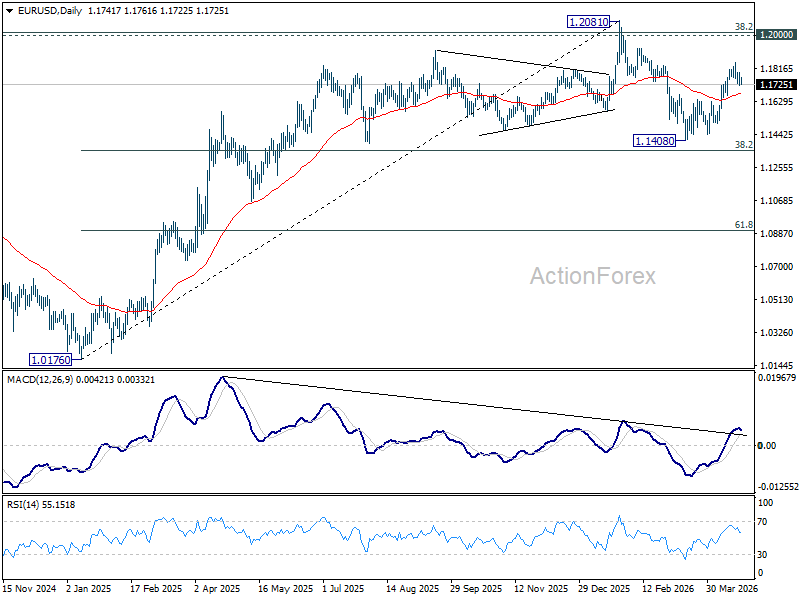
EUR/USD Mid-Day Outlook
Daily Pivots: (S1) 1.1708; (P) 1.1750; (R1) 1.1785; More….
Intraday bias stays neutral in EUR/USD and more consolidations could be seen below 1.1848. With 1.1662 support intact, further rally is in favor. On the upside, sustained trading above 61.8% retracement of 1.2081 to 1.1408 at 1.1824 will pave the way to retest 1.2081 high. However, firm break of 1.1662 support will bring deeper decline back towards 1.1408 low instead.
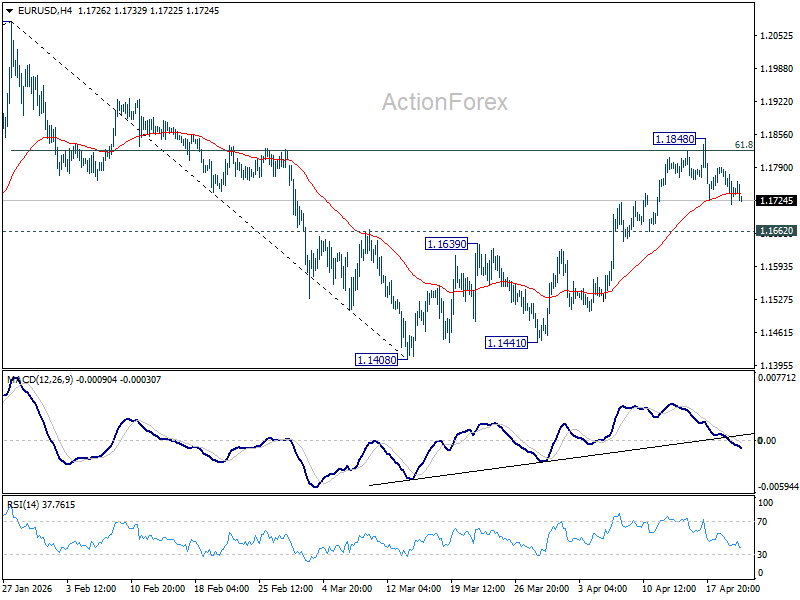
In the bigger picture, the strong support from 38.2% retracement of 1.0176 to 1.2081 at 1.1353 suggests that the pullback from 1.2081 is more likely a corrective move. Strong support was also found in 55 W EMA (now at 1.1507). Focus is back on 1.2 key cluster resistance level. Decisive break there will carry long term bullish implications. Nevertheless, break of 1.1408 support will revive the case of medium term bearish trend reversal.
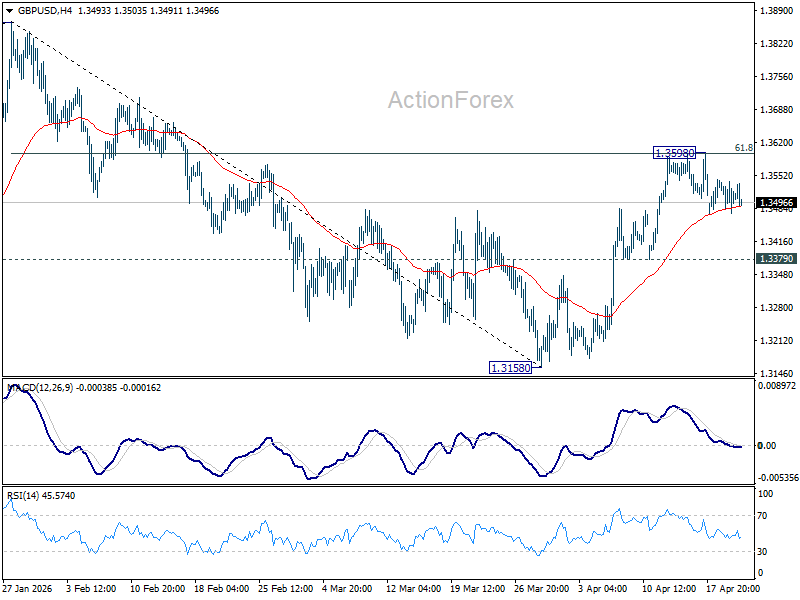
GBP/USD Mid-Day Outlook
Daily Pivots: (S1) 1.3475; (P) 1.3508; (R1) 1.3542; More...
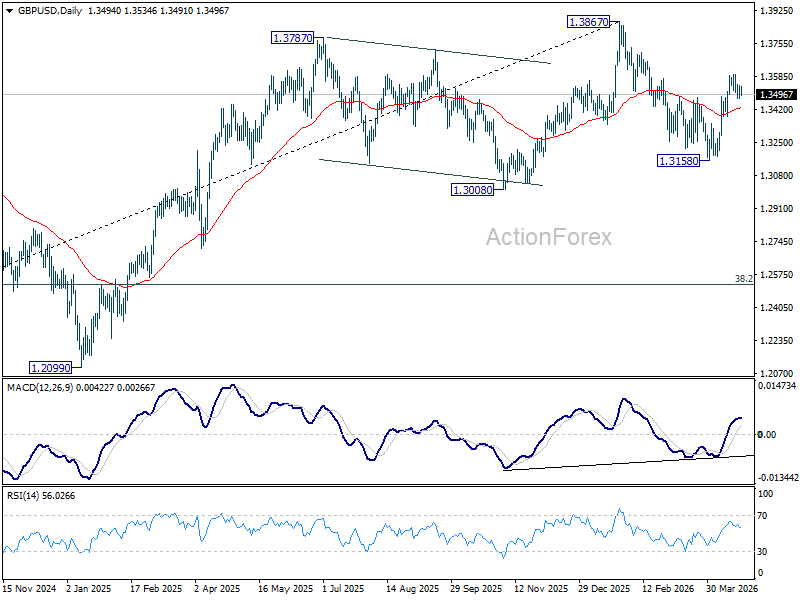
Intraday bias in GBP/USD remains neutral and more consolidations could be seen below 1.3598. With 1.3379 support intact, further rise is favor. On the upside, sustained break of 61.8% retracement of 1.3867 to 1.3158 at 1.3596 will pave the way to retest 1.3867 high. However, firm break of 1.3379 will bring deeper fall back to 1.3158 low instead.
In the bigger picture, current development suggests that price actions from 1.3867 are merely a corrective pattern within the broader up trend from 1.0351 (2022 low). With 1.3008 support intact, medium term bullishness is maintained and break of 1.3867 is back in favor for a later stage, towards 1.4248 key resistance (2021 high).
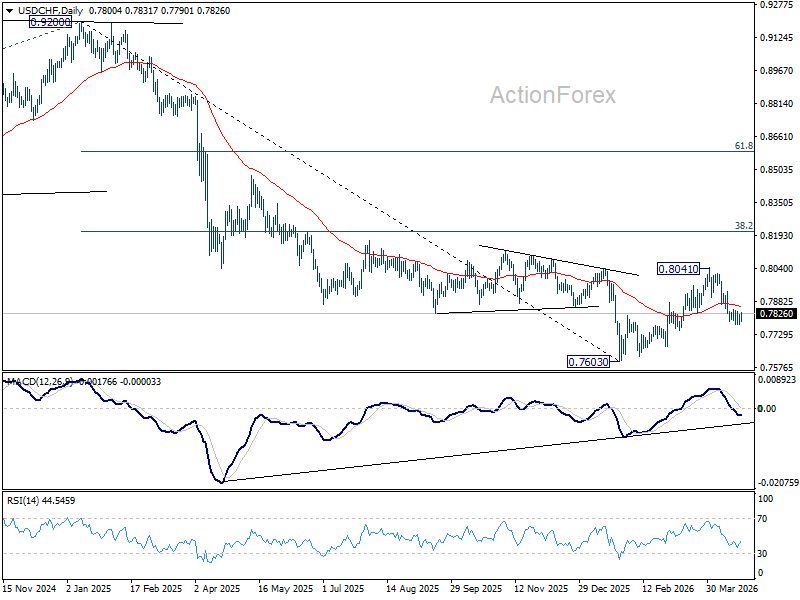
USD/CHF Mid-Day Outlook
Daily Pivots: (S1) 0.7782; (P) 0.7805; (R1) 0.7830; More….
Intraday bias in USD/CHF remains neutral as consolidations continue above 0.7774. Stronger recovery might be seen but upside should be limited below 0.7933 resistance to bring another fall. Sustained break of 61.8% retracement of 0.7603 to 0.8041 at 0.7770 will resume the decline from 0.8041 to retest 0.7603 low.
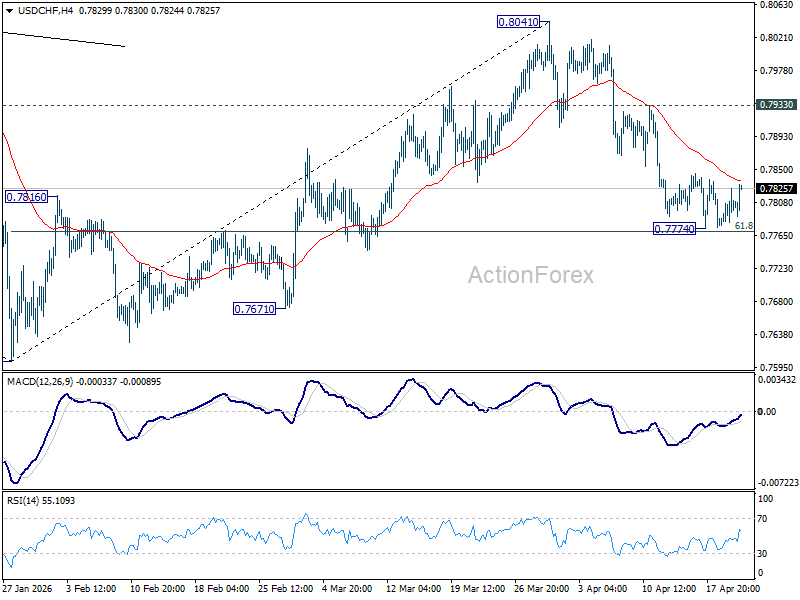
In the bigger picture, rebound from 0.7603 medium term bottom is seen as correcting the fall from 0.9200 only. Rejection by 55 W EMA (now at 0.8059) will affirm this bearish case, and setup down trend resumption to 100% projection of 1.0146 (2022 high) to 0.8332 from 0.9200 at 0.7382 at a later stage. Though, sustained break of 55 W EMA will suggest that it's probably correcting the larger scale down trend from 1.0146 (2022 high).