Sample Category Title
UK CPI Hits 3.3% as Fuel Costs Drive Inflation Higher, Pipeline Pressures Build
UK inflation rose in March, with CPI rising from 3.0% yoy to 3.3% yoy, in line with expectations. On a monthly basis, prices increased 0.7% mom, slightly above forecasts of 0.6% mom, reflecting renewed upward pressure largely driven by energy-related components.
The composition of inflation shows a mixed picture. Core CPI eased slightly from 3.2% yoy to 3.1% yoy, suggesting that underlying price pressures are not accelerating yet. However, goods inflation picked up from 1.6% to 2.1%, while services inflation rose from 4.3% to 4.5%, indicating that domestic price pressures remain firm.
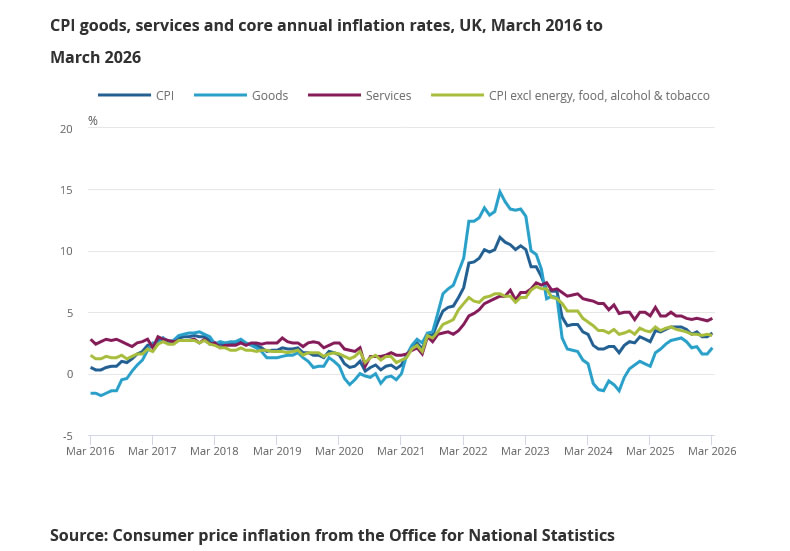
Energy played a central role in the latest increase. Motor fuels made the largest upward contribution to CPI, while clothing provided a partial offset. This highlights the growing impact of higher fuel costs on headline inflation, even as some consumer categories soften.
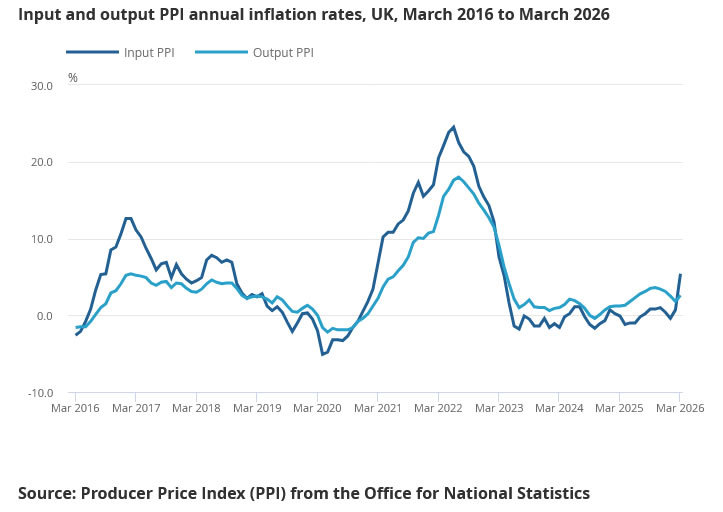
Upstream price pressures are building more clearly. PPI input prices surged 4.4% mom and 5.4% yoy, with crude oil prices rising over 58% yoy. Metals and other raw materials also contributed, reinforcing the risk that cost pressures could feed further into consumer prices in coming months.
| Data | M/M | Y/Y |
|---|---|---|
| CPI | +0.7% | 3.3% |
| Core CPI | 3.1% | |
| CPI Goods | 2.1% | |
| CPI Services | 4.5% | |
| PPI Input | 4.4% | 5.4% |
| PPI Output | 0.9% | 2.6% |
| Import Price Index | 4.2% | |
| Crude Oil Input Prices | 58.3% | |
| Metals & Materials Input | 3.5% |
Mixed Reaction to Extended Ceasefire
The ceasefire in the Middle East has been extended, yes, despite Donald Trump’s early threats that it was ‘unlikely’ to be extended and that he would step up his aggressive stance in case of no deal. That is yet another proof that the US could be losing control in the region, and it’s important to look past the noise that’s injected in the markets by tweets or even official announcements, because they seem to carry an increasingly lighter weight.
US futures are higher this morning following a retreat in yesterday’s session, while European equity futures are pointing to a lower start and the Asian equity complex is trading with little conviction on worries that this conflict is prolonging dangerously, the situation around the Strait of Hormuz remains highly uncertain, the US has put itself in a very difficult position that it can no longer easily justify politically or geopolitically, and no one knows what’s next.
What we know is that energy reserves are tightening. It is said that Europeans may be left with only a few weeks (roughly 6 weeks) of oil and energy reserves, after which we might see disruptions hitting the shore – beyond just prices – we could see energy scarcity, mass flight cancellations and so on.
Despite elevated risks, energy prices are showing a relatively muted reaction to the ceasefire extension—one that Iran reportedly did not request. US crude, which jumped more than 5% and tested key technical resistance, is slightly lower this morning, with WTI trading just below $93 per barrel. The tightening supply narrative is increasingly being counterbalanced by demand destruction, limiting the upside during rallies. From a technical perspective, the $94 level—around the 38.2% Fibonacci retracement of the year-to-date move—could act as a key pivot between consolidation and a continuation of the rebound. Above that, the $100 level should serve as a strong psychological resistance. In short, oil price volatility is likely to persist, with prices remaining elevated versus pre-conflict levels, but with limited scope for a sustained upside as higher prices weigh on demand.
Recent developments support this view, with European refineries reportedly cutting demand in response to higher prices.
In contrast, US consumption appears more resilient. Latest data showed a strong rebound in US retail sales. While part of the increase reflects higher energy prices and is not inflation-adjusted, gains were broad-based across categories including furniture, electronics and general merchandise. This aligns with recent bank commentary suggesting that US consumer spending remains relatively robust—for now.
As a result, US 2-year yields moved higher yesterday, reaching around 3.80%, as the data reduced the urgency for near-term rate cuts amid expectations of rising inflation. Comments from Kevin Warsh, Fed chair candidate, also drew attention. He emphasized his independence from political influence saying he will not be a ‘puppet sock’ to the White House and suggested that rate cuts may be preferable to balance sheet expansion, while also expressing a willingness to work with the US Treasury to reduce the balance sheet. However, the timing of such efforts remains challenging given ongoing uncertainty in global demand for US Treasuries!
The US Dollar, which initially strengthened during the early stages of the Iran conflict, has since lost momentum and returned toward pre-conflict levels. The EURUSD rebounded ahead of a key technical resistance, keeping the pair in the Trump-inauguration-to-date positive trend, while the USDJPY hovers just below the 160 level, with intervention risks limiting further upside.
Elsewhere, data showed that producer inflation in South Korea reached a three-year high amid rising energy costs, while the Kospi edged lower from recent highs.
In equities, the technology sector continues to regain attention as a relatively defensive growth play, supported by resilient AI demand despite Middle East tensions and energy crisis. This narrative remains in focus ahead of earnings season. Korean memory chipmakers, in particular, are benefiting from strong pricing power due to supply shortages, which should help protect margins despite rising costs.
In the US, Tesla is set to report earnings after the bell. Consensus expectations point to roughly 13–17% revenue growth compared to a year earlier, thanks to an easier comparison base following a weaker period last year due to Elon Musk’s political mess. However, the key debate around Tesla is no longer about short-term delivery numbers or car sales altogether, but whether Tesla can continue to position itself as an AI-driven growth story rather than an automaker falling out of grace. Challenges remain significant: deliveries have already missed expectations, pricing pressure, fading EV subsidies and an aging lineup are weighing on margins, and heavy capex—expected to exceed $20bn this year—raises concerns about cash flow and execution. Competition from China is also intensifying, with BYD announcing rapid charging advancements that highlight the pace of innovation in the sector. Their cars will reportedly charge from 10 to 98% in 6 minutes, and charging to 35% will take up to 1 minute only!
Against this backdrop, the bar has shifted. Markets are likely to focus less on quarterly figures and more on Elon Musk’s narrative around robotaxis, AI and future growth engines to justify valuation levels. Its PE ratio stands at 320 today.
Trump Extends Ceasefire
In focus today
In Sweden, March labour market statistics is set to be published. Our forecast is that the unemployment rate will remain unchanged from February at 8.4%, seasonally adjusted, although LSF data is very volatile. The labour market has shown a positive trend recently, reflecting stronger economic activity last year.
In the UK, CPI inflation for March is released. The UK has been on a continuous disinflationary path since last fall. Now we can expect an inflation surge, which will weigh on consumers. The Bank of England (BoE) will look closely for second-round effects, but with the cooling labour market in mind, the recession risk is probably more imminent than the inflation risk. We expect the BoE on hold for the foreseeable future.
In Denmark, the April consumer confidence indicator will be released. In March, consumer confidence dropped to -13.8, influenced by the ongoing US-Iran conflict and its impact on energy prices. With significant uncertainty and no resolution in sight at the time of the survey, we expect the indicator to decline further in April. As the survey directly addresses price expectations, consumer insights will be particularly important.
In Japan, April PMIs are released overnight. Consumers have largely been shielded from higher oil prices through gasoline subsidies, which should keep the service sector strong. In manufacturing, the new orders index corrected lower to 51.3 in March but remains above 50. At large, we think all the pieces of the puzzle are in place for the BoJ to hike again. However, the probability of an April rate hike has been priced out recently, and we have not seen much push-back from Governor Ueda. We expect the next hike in June or alternatively July, much dependent on the state of the energy market by then.
Economic and market news
What happened yesterday
In the Middle East conflict, Trump extended the ceasefire indefinitely just before its expiry after Iran refused further negotiations due to unreasonable US demands. This marks a U-turn in tone, as Trump had earlier ruled out an extension and hinted at military action. With Iran reportedly not requesting the ceasefire and the Strait of Hormuz issue still unresolved, Iran appears to hold the upper hand at present. Following the news, Brent crude held above USD98/bbl.
In Germany, the ZEW index in April fell more than expected. The assessment of the current situation declined to the same level as in January, which was slightly more than expected, while expectations took an unexpectedly large plunge to the lowest level since 2022. The data paints a bleak picture of the German growth outlook, which is a dovish signal for the ECB, although their communication clearly shows that the Governing Council is more concerned with curbing upside inflation risks compared to downside growth pressures.
In the UK, the latest labour market report provided mixed signals. The report includes March data on payrolls but February data on the rest, making it largely outdated. March payrolls revealed a loss of 11K jobs and thus payrolls are once again pointing down. February was also revised lower. On the other hand, unemployment nosedived to 4.9% (prior: 5.2%, cons: 5.2%). Additionally, the trend for lower wage growth was not as strong as expected. Cost effects on wages will thus be worth keeping an eye on going forward.
In the US, March retail sales surprised to the topside, with the core control group measure (excluding autos, gas, building materials, and food services) rising 0.7% (prior: 0.6%, cons: 0.2%). While higher gasoline prices naturally lifted nominal headline sales, the stronger-than-expected growth in the core measure suggests consumer demand remained resilient during the initial weeks of the war, despite sentiment indicators trending lower.
ADP's weekly private sector employment estimates also turned surprisingly sharply higher, as the 4-week average reached 55k in the week ending 4 April, which is the highest reading since ADP started publishing the weekly estimates last fall. While - all else equal - this could indicate a strong April Jobs Report, it is worth noting that the correlation to Non-Farm Payrolls is far from perfect.
Also in the US, Fed chief nominee Warsh testified before the Senate Banking Committee, calling for "regime change" at the Fed, including a new inflation framework, gradual balance sheet reduction, and an overhaul of forward guidance - largely in line with previous remarks. Warsh criticised the Fed's handling of inflation post-Covid-19 and emphasised the importance of monetary policy independence despite political pressure. Senator Tillis stated Warsh's confirmation would be delayed until the Department of Justice investigation into Powell concludes, adding uncertainty to the timing.
Equities: Risk assets had a poor day yesterday, with near-term dynamics in the hands of the Iran war. Oil jumped and briefly touched above USD100/barrel to settle around USD98barrel. The market dynamics gave flashback to the playbook we saw earlier in this war, being the Energy sector the only performing one with the rest of the sectors in negative territory. Global equities ended 0.7% lower, with S&P500 and Nasdaq around 0.6% lower. Russell 2000 ended 1% lower. Overnight Asian equities are mixed, while futures are up in the US, and lower in Europe.
FI and FX: Global yields rose across tenors yesterday as markets were eyeing the initial deadline for the ceasefire Wednesday evening in Washington until Trump extended the ceasefire indefinitely just before its expiry after Iran refused further negotiations, citing unreasonable US demands. Following the news, Brent crude held above USD98/bbl. EUR/USD edged lower yesterday amid solid US macro data, Kevin Warsh's remarks at the Senate and a setback in ceasefire talks. EUR/DKK traded slightly below the recent 7.4735 top yesterday as the upwards pressure eased slightly. EUR/GBP ended the day below 0.87 as the UK jobs report and political jitters failed to trigger a meaningful move. Gilts underperformed peers as political jitters came back in focus with prediction markets having ramped up bets that PM Starmer will be out before 2027 to around 70%.
EUR/AUD Daily Outlook
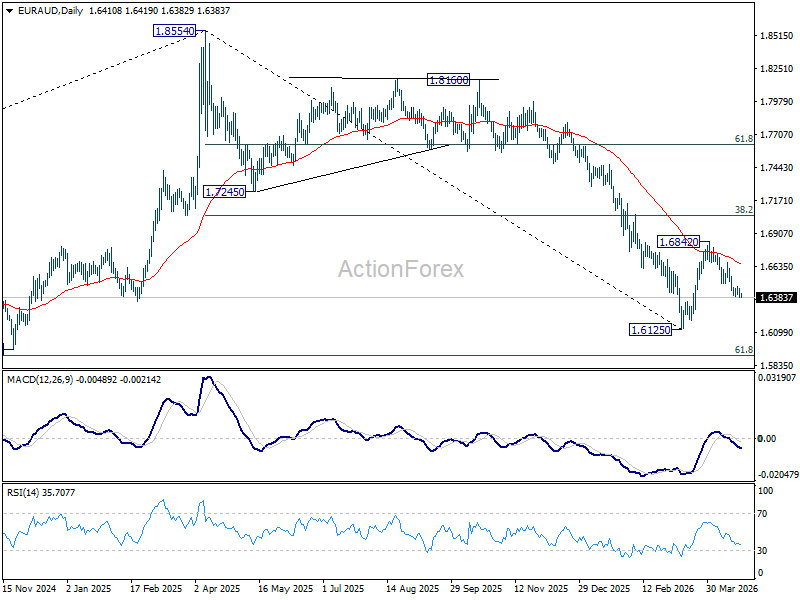
Daily Pivots: (S1) 1.6383; (P) 1.6422; (R1) 1.6459; More...
Intraday bias in EUR/AUD stays on the downside as fall from 1.6842 is extending. Deeper decline should be seen to retest 1.6125 low. Firm break there will resume whole down trend from 1.8554 to 1.5913 fibonacci level next. On the upside, above 1.6477 minor resistance will turn intraday bias neutral first.
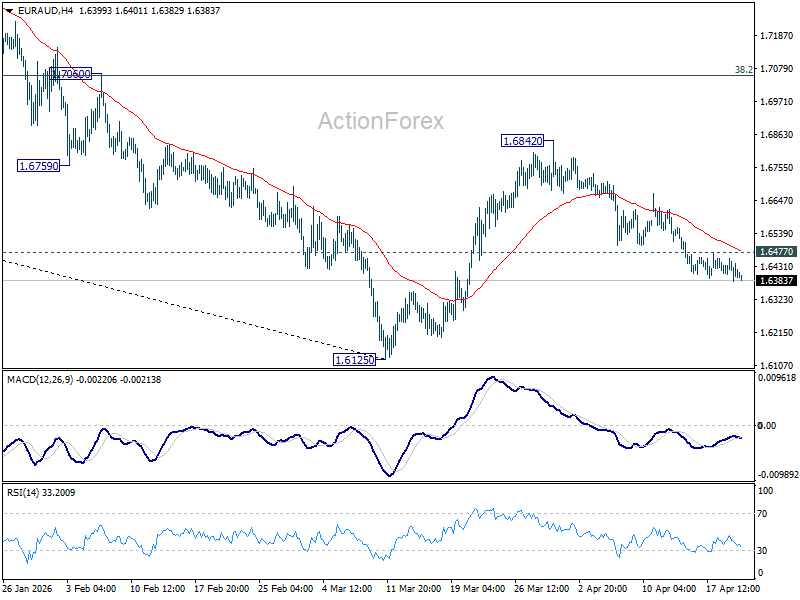
In the bigger picture, fall from 1.8554 (2025 high) is in progress and deeper decline should be seen to 61.8% retracement of 1.4281 to 1.8554 at 1.5913, which is slightly below 1.5963 structural support. Decisive break there will pave the way back to 1.4281 (2022 low). For now, risk will stay on the downside as long as 55 W EMA (now at 1.7131) holds, even in case of strong rebound.
Oil Near $100 as Ceasefire Extension Prolongs Uncertainty Indefinitely
The ceasefire has been extended—but so has the uncertainty. Markets initially braced for escalation after US–Iran talks were cancelled, but sentiment quickly stabilized when US President Donald Trump announced an indefinite extension of the ceasefire. The move removed immediate downside risks, but did not resolve the underlying conflict.
Oil is reflecting that middle ground. Brent is pressing near the $100 mark but has not broken through decisively. That suggests traders are factoring in ongoing disruption in the Strait of Hormuz without committing to a full escalation scenario. Equities are echoing the same message. Asian markets, with the exception of Hong Kong, are largely treading water.
There are a few important points to note about the current situation. Firstly, the extension is not unconditional. Trump made clear the pause depends on Iran submitting a “unified proposal”. This conditional framework means the risk of escalation has not disappeared—it has simply been deferred.
Secondly, a central uncertainty is whether and when talks will resume. While the ceasefire extension buys time, it does not guarantee progress. Any next step depends on teh "fractured" Iran leadership presenting a coherent negotiating position—something that remains far from certain.
Since the death of Supreme Leader Ayatollah Ali Khamenei in late February, decision-making authority has become fragmented. A collective leadership structure has emerged, but divisions between pragmatists and hardliners appear to be slowing the formation of a unified stance.
This fragmentation has direct implications for diplomacy. While Iran’s civilian leadership may signal openness to talks, the IRGC continues to operate independently, particularly in the Strait of Hormuz. This disconnect makes it difficult for external parties to interpret Iran’s true negotiating position.
For markets, the implications are clear. The ceasefire has reduced immediate risks, but it has also extended the period of uncertainty. Traders are not unwinding positions, but they are also not adding new exposure, waiting instead for confirmation of the next move.
Until then, the dominant theme remains unchanged: no escalation, but no clarity. And in that environment, markets are likely to stay cautious, reactive, and highly sensitive to headlines.
In the currency markets, Kiwi remains the strongest one for the week so far, followed by Loonie, and then Swiss Franc. Yen is the worst, followed by Euro, and then Dollar. Sterling and Aussie are positioning in the middle of the pack.
In Asia, at the time of writing, Nikkei is up 0.18%. Hong Kong HSI is down -1.33%. China Shanghai SSE is up 0.29%. Singapore Strait Times is down -0.45%. Japan 10-year JGB yield is up 0.016 at 2.402. Overnight, DOW fell -0.59%. S&P 500 fell -0.63%. NASDAQ fell -0.59%. 10-year yield rose 0.04 to 4.29.
Gold and Silver Recover as US Extends Iran Ceasefire, But Technical Weakness Emerges
Ceasefire relief helped stabilize Gold and Silver—but technical cracks are forming. The next move depends on whether support levels hold. Read More.
Japan's Exports Rise 11.7% in March, Trade Surplus Misses
Japan posted another solid month for exports, led by semiconductors and China demand. But the trade surplus still missed expectations as imports jumped on energy costs and a weaker Yen. Read More.
Australia Westpac Leading Index Turns Negative, Signals Below-Trend Growth Ahead.
Australia’s growth signal has turned negative. The Westpac Leading Index now points to below-trend growth, but rising energy costs and inflation risks keep RBA rate hikes firmly on the table. Read More.
EUR/AUD Daily Outlook
Daily Pivots: (S1) 1.6383; (P) 1.6422; (R1) 1.6459; More...
Intraday bias in EUR/AUD stays on the downside as fall from 1.6842 is extending. Deeper decline should be seen to retest 1.6125 low. Firm break there will resume whole down trend from 1.8554 to 1.5913 fibonacci level next. On the upside, above 1.6477 minor resistance will turn intraday bias neutral first.
In the bigger picture, fall from 1.8554 (2025 high) is in progress and deeper decline should be seen to 61.8% retracement of 1.4281 to 1.8554 at 1.5913, which is slightly below 1.5963 structural support. Decisive break there will pave the way back to 1.4281 (2022 low). For now, risk will stay on the downside as long as 55 W EMA (now at 1.7131) holds, even in case of strong rebound.
Gold and Silver Recover as US Extends Iran Ceasefire, But Technical Weakness Emerges
Gold and Silver stabilized after the US extended the Iran ceasefire, cushioning markets from immediate escalation fears and preventing a deeper selloff. The move offset earlier weakness triggered by the cancellation of JD Vance’s planned diplomatic trip. However, technical developments suggest both metals are becoming increasingly vulnerable to a near-term bearish reversal, with selling likely to accelerate if key support levels give way.
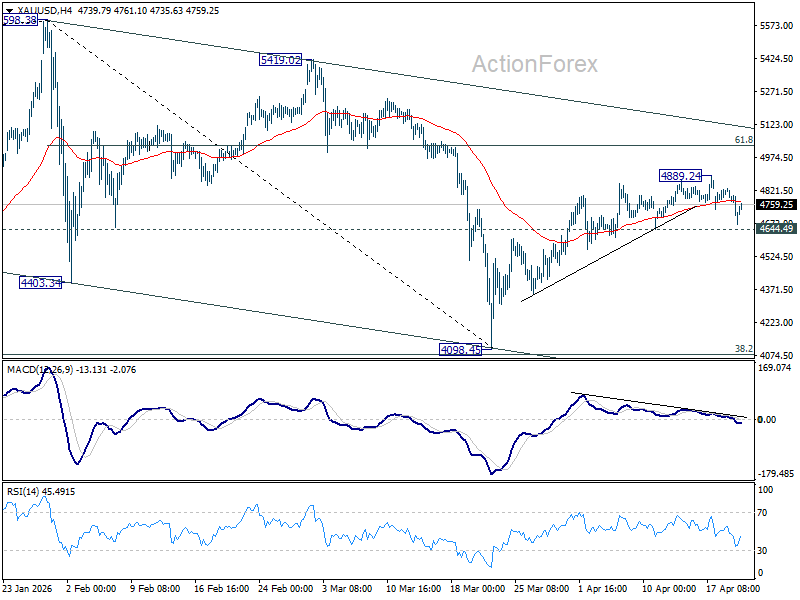
Technically, Gold is showing clearer signs of exhaustion. Bearish divergence on 4H MACD highlights fading momentum, even as price attempts to extend higher. While a squeeze toward 4,889.24 cannot be ruled out, strong resistance near 61.8% retracement of 5,598.38 to 4,098.45 at 5,025.40 is likely to cap gains.
On the downside, break of 4,644.49 support would confirm that the rebound from 4,098.45 has completed, opening the door for a deeper move back toward that low.
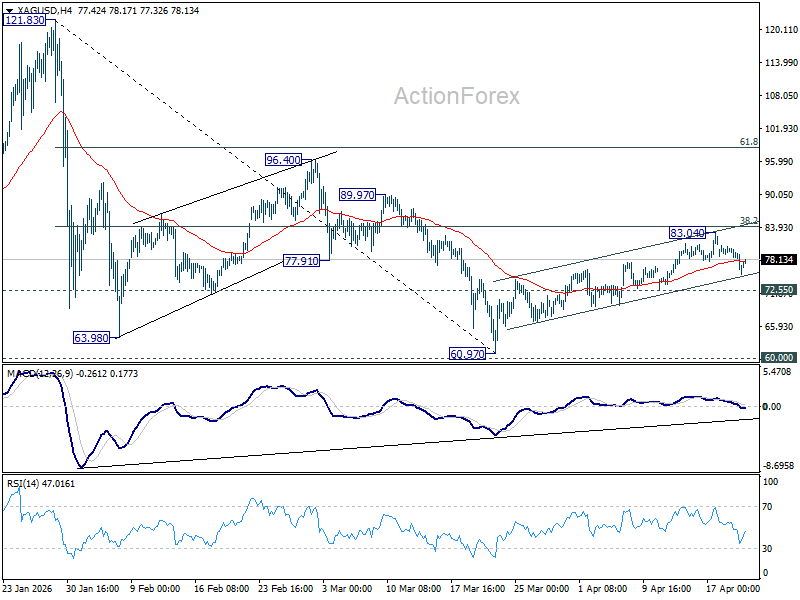
Silver, while still relatively resilient, is showing early signs of fatigue too. The metal remains within the near term rising channel, but momentum indicators are weakening. Resistance at 38.2% retracement of 121.83 to 60.97 at 84.21 is likely to limit further gains, at least on first attempt.
On the downside, a break below 72.55 would signal that the rebound from 60.97 has run its course, and bring further fall back toward this low.
Australia Westpac Leading Index Signals Below-Trend Growth Ahead, RBA Still Expected to Hike
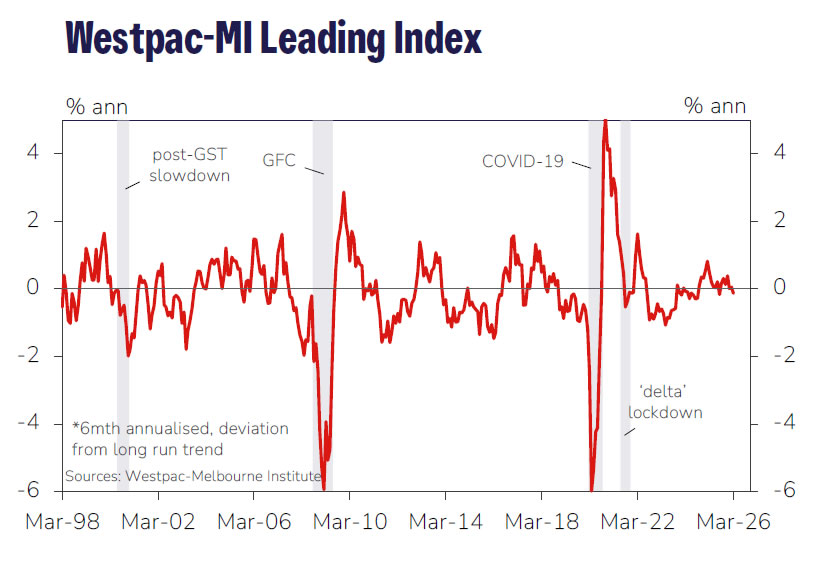
Australia’s Westpac Leading Index slipped from 0.05% to -0.13% in March, signaling a shift to below-trend growth for the remainder of 2026. The reading marks the first negative signal since August last year, indicating that momentum is softening, though not yet deteriorating sharply.
The weakness reflects a combination of domestic and external pressures. Consumer expectations have fallen sharply, equity markets declined in March, and the yield curve has flattened as short-term rates moved higher. According to Westpac, around 60% of the recent drag can be linked to the Middle East conflict, which has weighed on sentiment and driven higher fuel costs.
Despite the softer growth outlook, RBA's policy focus remains firmly on inflation. Rising energy prices are expected to push underlying inflation higher, increasing the risk of elevated inflation expectations. As a result, the RBA is still expected by Westpac to raise rates by 25bps at its May meeting, with further tightening likely as policymakers prioritize price stability over modest growth concerns.
Japan’s Exports Rise 11.7% in March, Trade Surplus Misses
Japan’s trade balance recorded a surplus of JPY667.0B in March, falling short of expectations despite a solid rebound from February’s JPY44.3B. The miss came as a sharp rise in imports offset another month of strong export growth, highlighting the growing impact of higher energy costs and Yen weakness.
Exports rose 11.7% yoy, marking a seventh consecutive month of expansion and beating forecasts. The strength was led by robust demand for semiconductors and electronic components, with shipments to China surging 17.7%. In contrast, export growth to the US was more moderate at 3.4%, reflecting ongoing trade frictions and tariff uncertainty.
However, imports rose 10.9% yoy, significantly above expectations of 7.1%. The increase was largely driven by elevated energy prices and the weaker Yen, which has inflated the cost of raw material and fuel purchases.
| Indicator | Actual (YoY) | Forecast | Previous (Feb) |
| Trade Balance | JPY667.0 B | JPY1,106.0 B | JPY44.3 B |
| Exports | +11.7% | +11.0% | +4.0% |
| Imports | +10.9% | +7.1% | +10.3% |
Gold Stabilizes, Market Prepares For Next Decisive Move
Key Highlights
- Gold started a fresh increase above the $4,700 zone.
- A key contracting triangle is forming with resistance at $4,900 on the 4-hour chart.
- WTI Crude Oil tested $83.00 and recently recovered some losses.
- EUR/USD failed to stay above 1.1820 and corrected gains.
Gold Price Technical Analysis
Gold reclaimed the $4,550 pivot level and started a fresh increase against the US Dollar. The price cleared the $4,620 and $4,700 resistance levels.
The 4-hour chart of XAU/USD indicates that the price even surpassed the $4,800 resistance zone and the 100 Simple Moving Average (red, 4 hours). Finally, the bears appeared near the $4,890 zone. The price trimmed some gains and traded below $4,800.
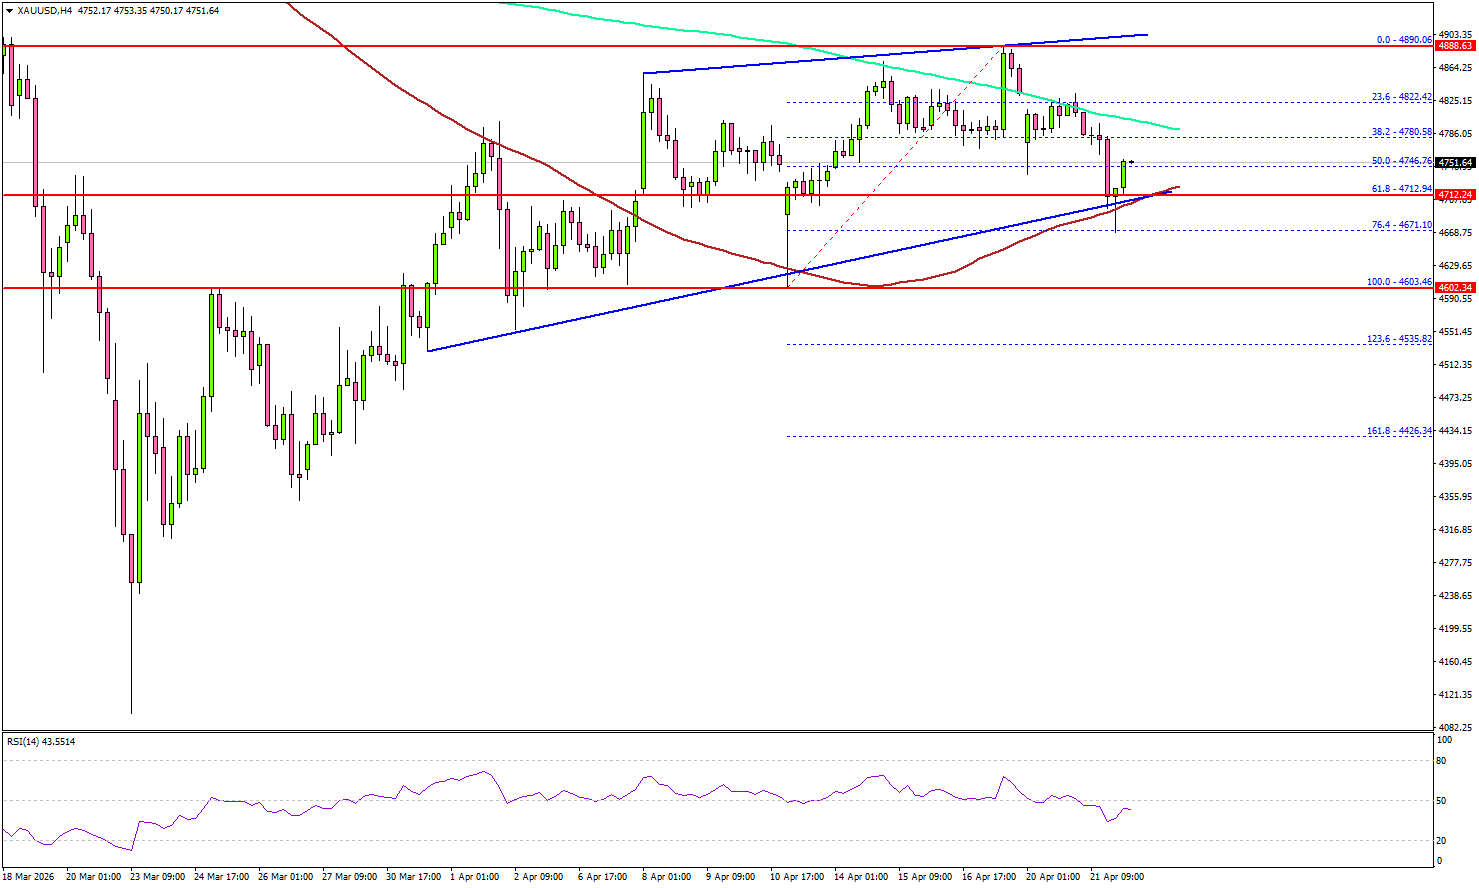
There was a move below the 200 Simple Moving Average (green, 4 hours). If there is another decline, Gold might find bids near the $4,740 level. The first major support sits at $4,710 and the 100 Simple Moving Average (red, 4 hours).
The next support could be $4,600, below which the price might slide to $4,550. The main support sits at $4,425. Any more losses might call for a test of $4,200 or even $4,120 in the coming days.
On the upside, immediate resistance is $4,820. The next major resistance sits near $4,880. The main resistance could be near the trend line at $4,900. There is also a key contracting triangle forming with resistance at $4,900.
A clear move above $4,900 could open the doors for more upside. In the stated case, the bulls could aim for a move toward $5,000 or even $5,200.
Looking at WTI Crude Oil, the price declined further toward $83.00 before the bulls stepped in and protected more losses.
Economic Releases to Watch Today
- UK Consumer Price Index for March 2026 (YoY) – Forecast +3.3%, versus +3.0% previous.
- UK Core Consumer Price Index for March 2026 (YoY) – Forecast +3.2%, versus +3.2% previous.
Warsh’s Forward Guidance and a Still Resilient Consumer
So here are two things to consider today…
First on Kevin Warsh’s Fed Chair hearing, there were a few things he said today that we will no doubt come back to over the coming weeks (and really months once he finally gets confirmed). But there is one thing that really stood out. He has been on record saying he dislikes the idea of forward guidance—and he said it again today. We have some sympathy for that, but mostly because we think forward guidance has been overused. When used sparingly, it can be quite powerful. As we all appreciate, that has not been the case with the Fed over recent years.
But here’s the thing. Isn’t he using forward guidance right now? He continues to highlight that AI will allow the Fed to cut rates, as it will usher in disinflation. Leaving aside that, we think the timing on that impact is longer than his comments seem to suggest, the simple act of saying you’re going to cut for “x” reason is in fact forward guidance. We’ll have more to say about Warsh in the coming weeks and months.
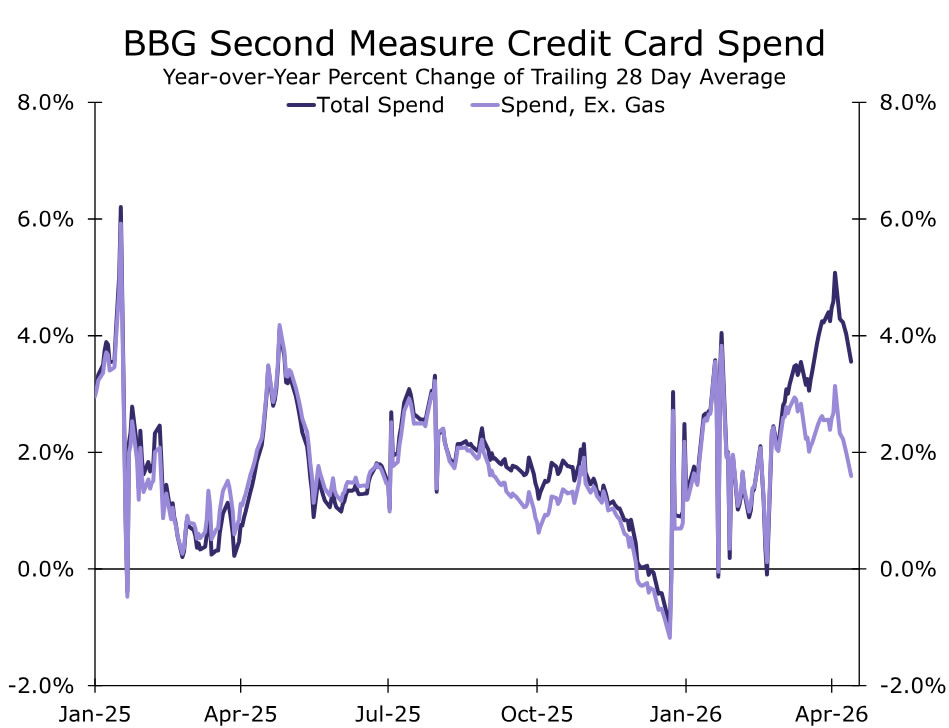
Okay now on the consumer. Where does the consumer stand at the moment? We have data through March and, at the moment, the consumer is hanging in there just fine in the wake of the Iran conflict. Gas prices are higher, inflation fatigue is real, and sentiment has softened as inflation expectations moved up following the conflict. And yet with all of that, the hard data continues to point to resilient consumer spending, at least for the moment.
Control retail sales (ex gas, autos, and building materials) have been sturdy through March, and keep in mind, too, with core goods prices close to flat in March, that nominal strength is NOT an inflation story.
The consumer is still spending, and this is partially due to larger tax refunds offsetting the initial hit from higher gasoline prices. Right now refunds are up over $40 billion versus last year, which is a 17% increase over the prior year (and pretty darn close to our forecast of about 18%). And the total number of refunds sent is up 3 million MORE versus the same time last year. So it would be hard to ignore this reality, especially as it relates to the state of spending today.
And remember too, the refund story was an important part of our narrative that growth would look solid this year prior to the war. Right now fiscal is still a tailwind. And credit card spending through mid-April (chart below) suggests a still sturdy pace of spending. Just keep in mind, the longer this war endures and energy prices remain elevated, the more fiscal becomes a shock absorber.