

Sample Category Title
EUR/JPY Daily Outlook
Daily Pivots: (S1) 186.60; (P) 186.95; (R1) 187.57; More...
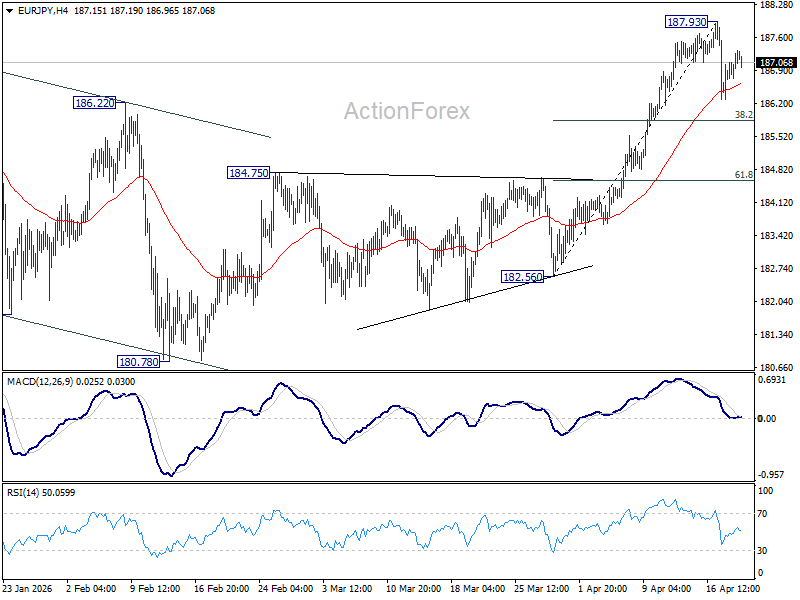
Intraday bias in EUR/JPY remains neutral and more consolidations could be seen below 187.93 short term top. Another fall might be seen to 38.2% retracement of 182.56 to 187.93 at 185.87. On the upside, though, break of 187.93 will resume larger up trend.
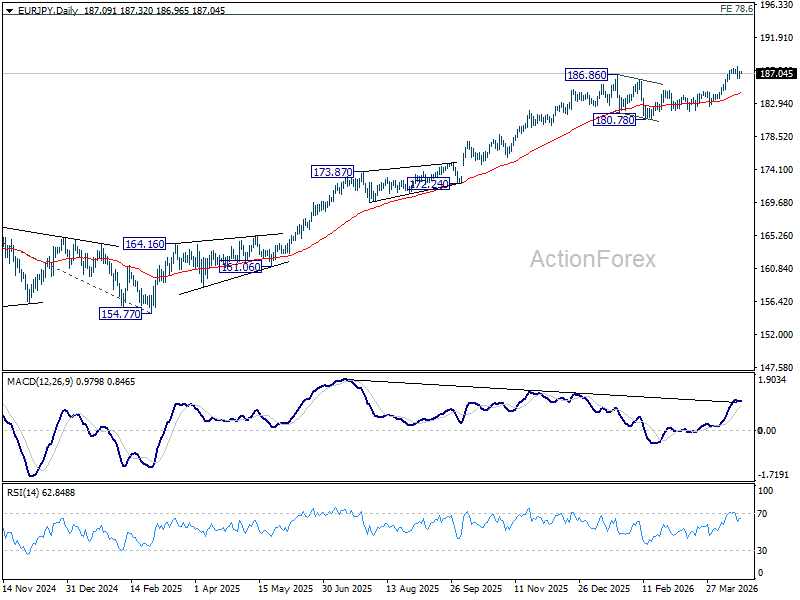
In the bigger picture, up trend from 114.42 (2020 low) is in progress Next target is 78.6% projection of 124.37 (2022 low) to 175.41 (2025 high) from 154.77 at 194.88 next. For now, medium term outlook will stay bullish as long as 180.78 support holds, even in case of deeper pullback.
EUR/GBP Daily Outlook
Daily Pivots: (S1) 0.8693; (P) 0.8710; (R1) 0.8719; More…
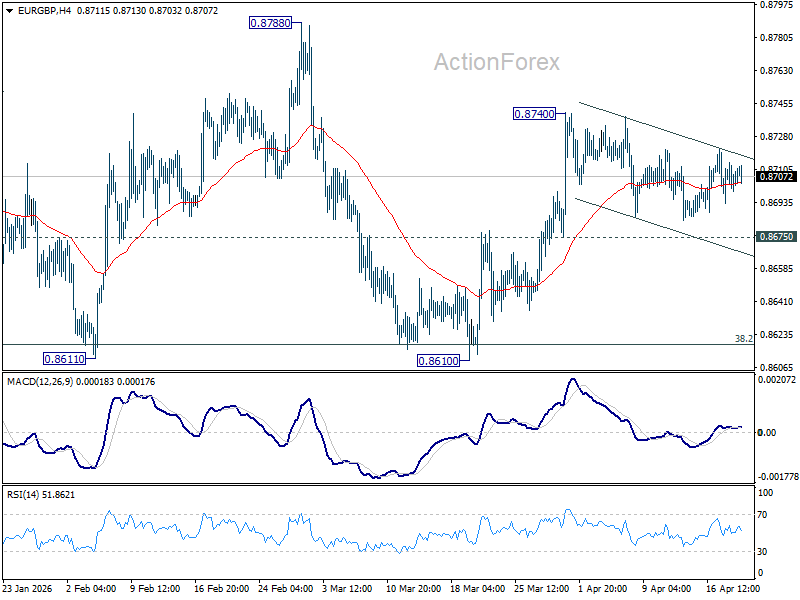
EUR/GBP is still extending the consolidation pattern form 0.8740 and intraday bias remains neutral. As long as 0.8675 support holds, further rise remains mildly in favor. On the upside, break of 0.8740 will resume the rally from 0.8610 to 0.8788 resistance. However, firm break of 0.8675 will turn bias back to the downside for retesting 0.8610 low instead.
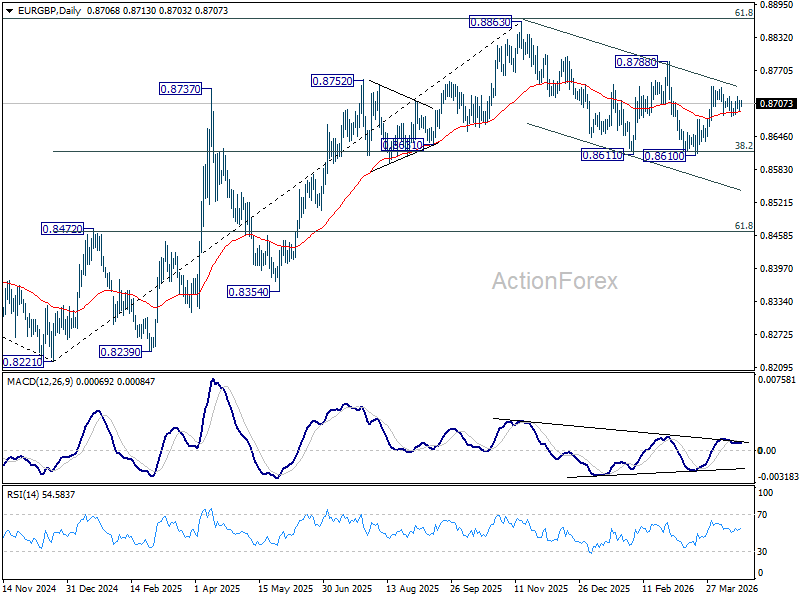
In the bigger picture, strong support was seen again from 38.2% retracement of 0.8821 to 0.8863 at 0.8618. Break of 0.8788 resistance will argue that larger rise from 0.8221 might be ready to resume through 0.8863 (2025 high). Nevertheless, sustained trading below 0.8618 should confirm bearish reversal, and bring deeper fall to 61.8% retracement at 0.8466 at least.
EUR/AUD Daily Outlook
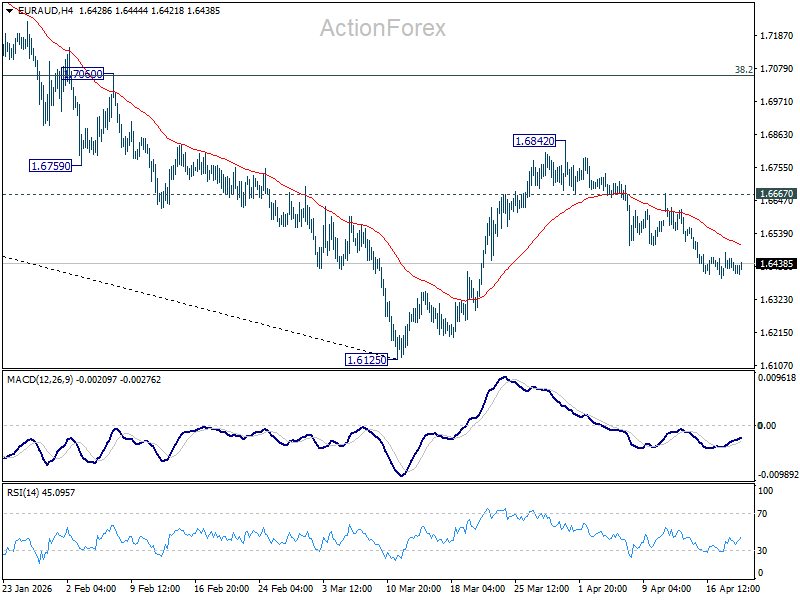
Daily Pivots: (S1) 1.6394; (P) 1.6440; (R1) 1.6467; More...
Despite loss of downward momentum, further fall is still expected in EUR/AUD with 1.6667 resistance intact. Decline from 1.6842 should target a retest on 1.6125 low. Firm break there will resume whole down trend from 1.8554 to 1.5913 fibonacci level next. However, break of 1.6667 will turn bias back to the upside for 1.6842 resistance instead.
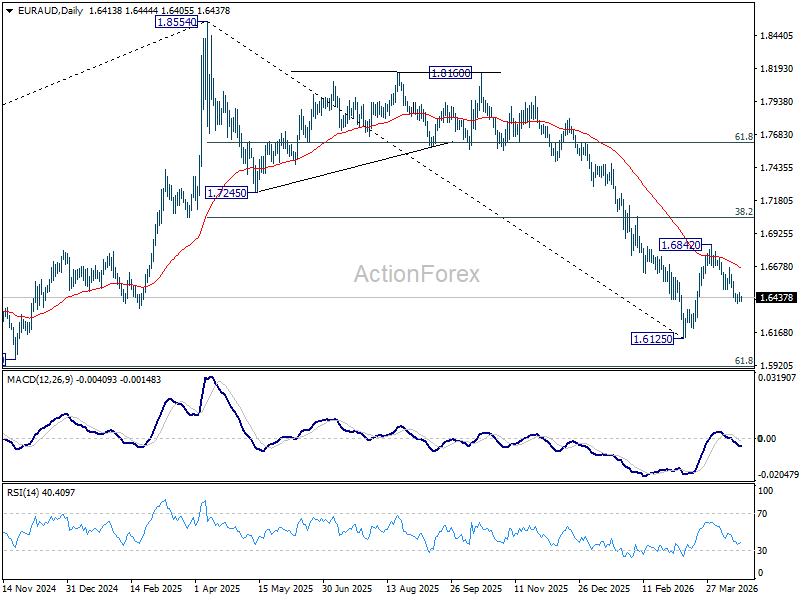
In the bigger picture, fall from 1.8554 (2025 high) is in progress and deeper decline should be seen to 61.8% retracement of 1.4281 to 1.8554 at 1.5913, which is slightly below 1.5963 structural support. Decisive break there will pave the way back to 1.4281 (2022 low). For now, risk will stay on the downside as long as 55 W EMA (now at 1.7131) holds, even in case of strong rebound.
EUR/CHF Daily Outlook
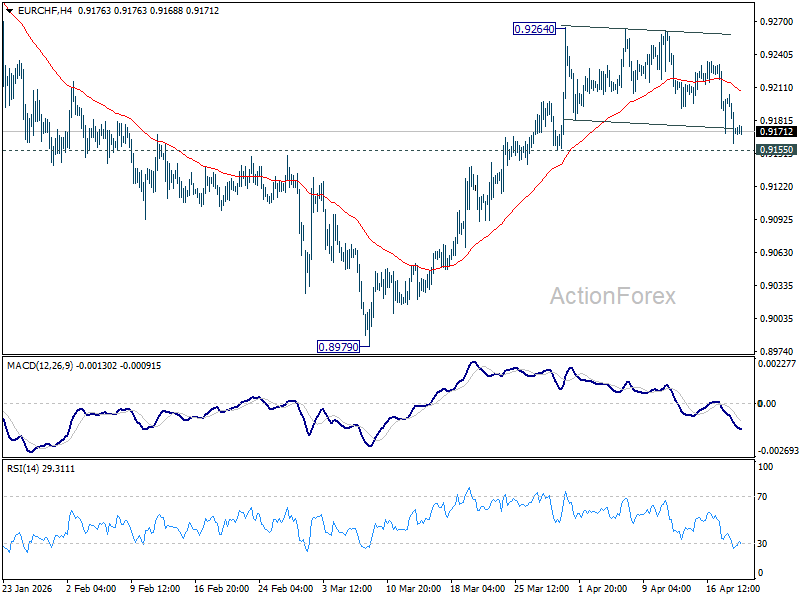
Daily Pivots: (S1) 0.9156; (P) 0.9183; (R1) 0.9202; More....
EUR/CHF is still holding inside range of 0.9155/9264. Intraday bias remains neutral and further rise is in favor. Firm break of 0.9264 will resume the rise from 0.8979 to 0.9394 resistance next. However, break of 0.9155 will turn bias back to the downside for deeper pullback.
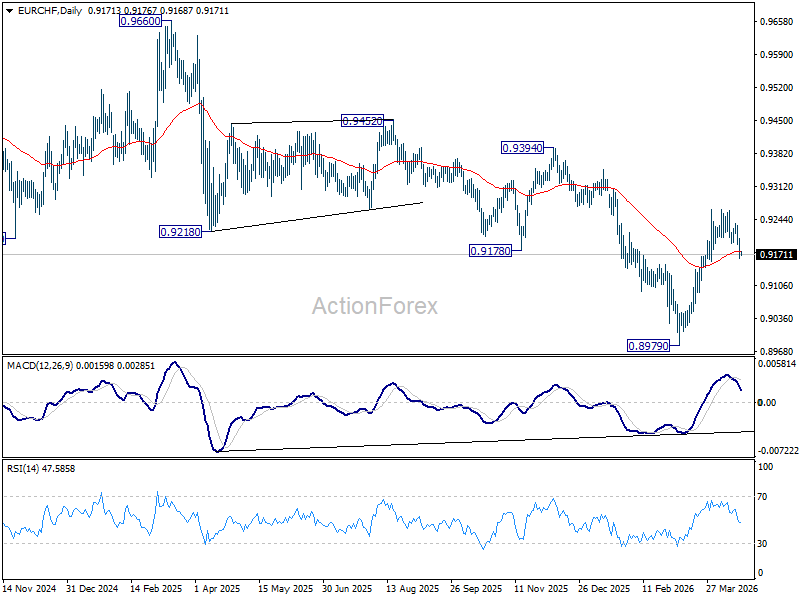
In the bigger picture, considering bullish convergence condition in W MACD, a medium term bottom should be in place at 0.8979. Sustained trading above 55 W EMA (now at 0.9280) will add more credence to this case. Further break of 0.9394 resistance will pave the way to 0.9660 resistance next. However rejection by the 55 W EMA will set up another fall through 0.8979 low at a later stage.
USD/CAD Daily Outlook
Daily Pivots: (S1) 1.3616; (P) 1.3664; (R1) 1.3693; More...
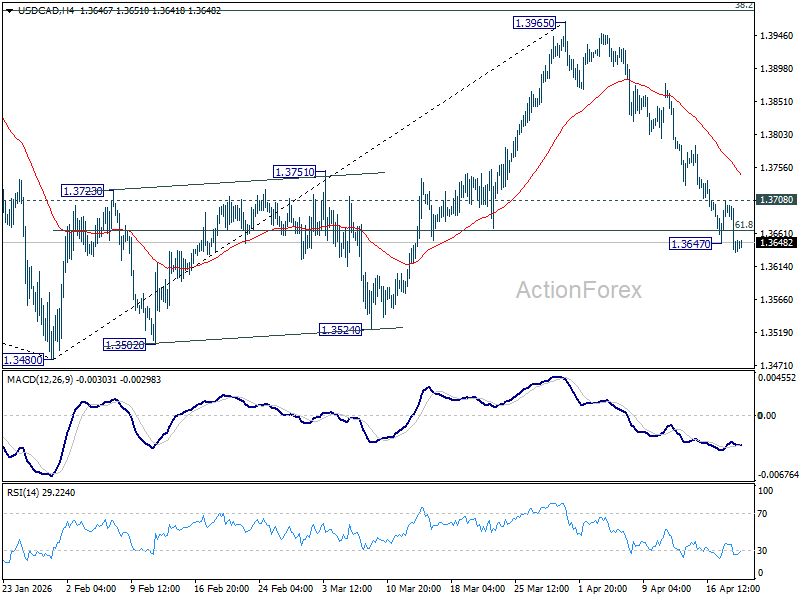
USD/CAD's fall from 1.3965 resumed after brief consolidations and intraday bias is back on the downside. Sustained trading below 61.8% retracement of 1.3480 to 1.3965 at 1.3665 will pave the way to retest 1.3480 low. On the upside, above 1.3708 minor resistance will turn intraday bias neutral again first.
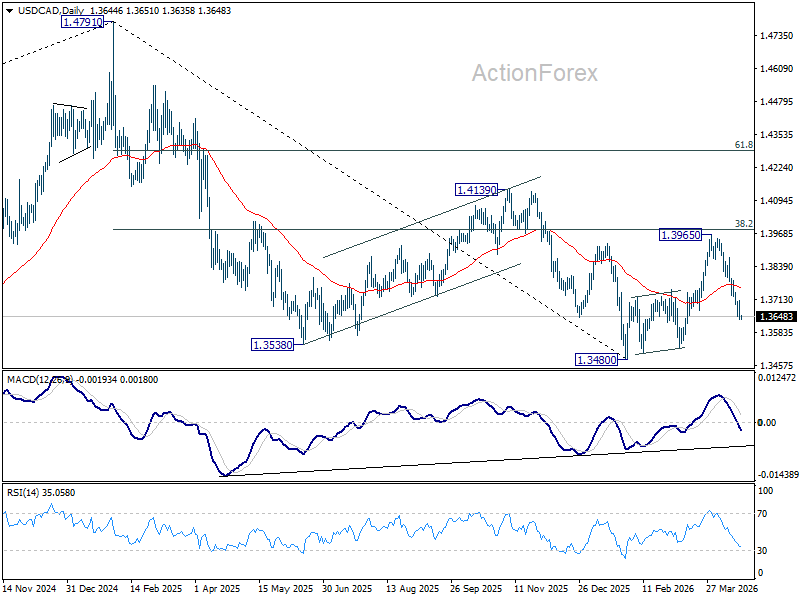
In the bigger picture, price actions from 1.4791 are seen as a corrective pattern to the whole up trend from 1.2005 (2021 low). Deeper fall could be seen, as the pattern extends, to 61.8% retracement of 1.2005 to 1.4791 at 1.3069. However, decisive break of 38.2% retracement of 1.4791 to 1.3480 at 1.3981 will argue that the correction has completed with three waves down to 1.3480 already. Further break of 1.4139 will confirm and bring retest of 1.4791 high.
AUD/USD Daily Report
Daily Pivots: (S1) 0.7136; (P) 0.7159; (R1) 0.7200; More...
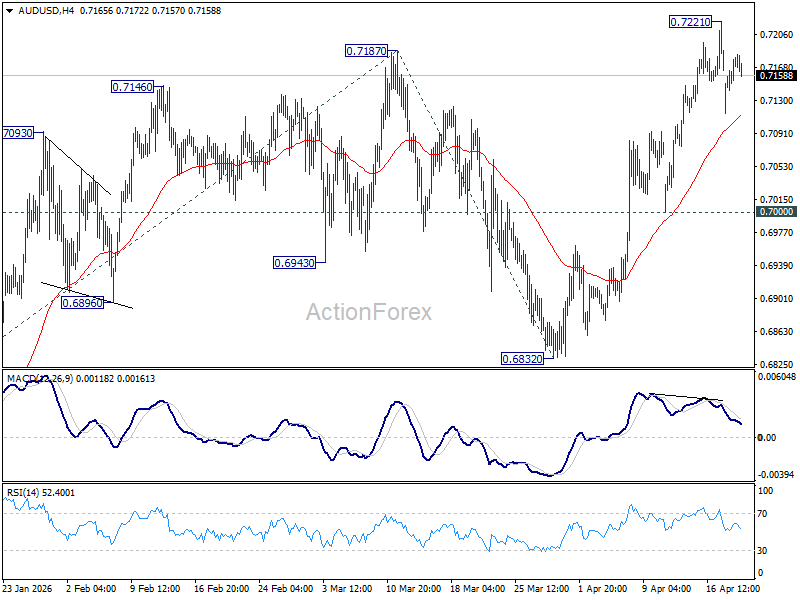
Intraday bias in AUD/USD remains neutral for consolidations below 0.7221. Downside should be contained above 0.7000 support. On the upside, above 0.7221 will extend the larger up trend to 61.8% projection of 0.6420 to 0.7187 from 0.6832 at 0.7306. However, break of 0.7000 will bring deeper fall back to 0.6832 support instead.
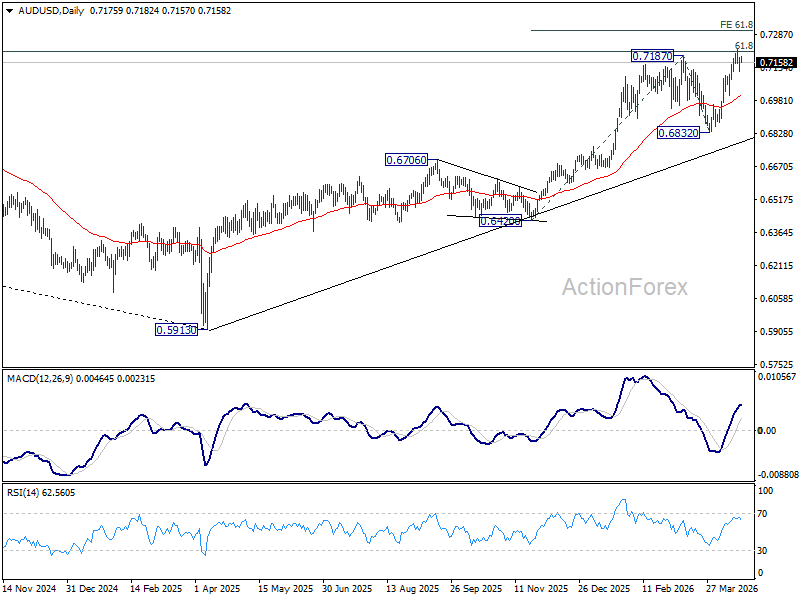
In the bigger picture, rise from 0.5913 (2024 low) is still in progress. Decisive break of 61.8% retracement of 0.8006 to 0.5913 at 0.7206 will solidify the case that it's already reversing the down trend from 0.8006 (2021 high). Further rally should then be seen to retest 0.8006. For now, outlook will remain bullish as long as 0.6832 support holds, in case of pullback.
USD/JPY Daily Outlook
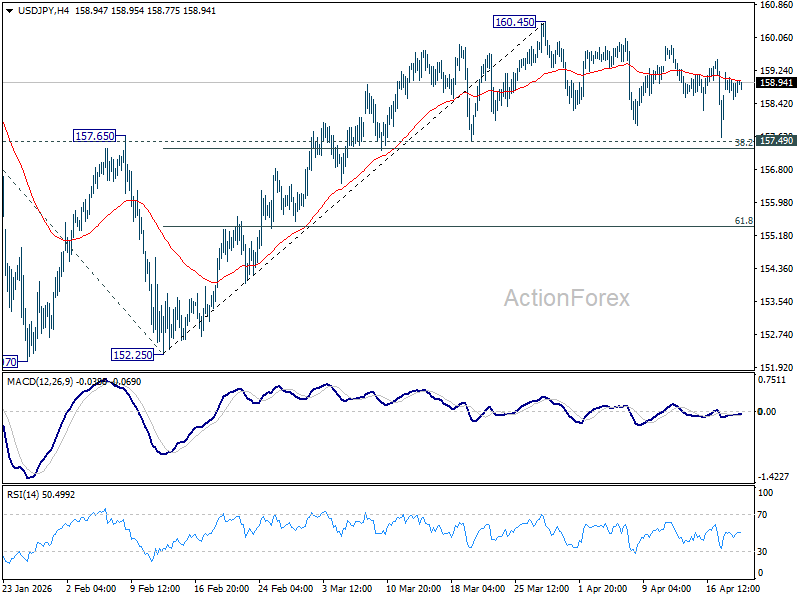
Daily Pivots: (S1) 158.51; (P) 158.86; (R1) 159.16; More...
USD/JPY is extending consolidation pattern from 160.45 and intraday bias remains neutral. Further rise is expected with 157.49 cluster support (38.2% retracement of 152.25 to 160.45 at 157.31) intact. On the upside break of 160.45 will target a retest on 161.94 high. However, firm break of 157.31/49 will bring deeper fall back to 61.8% retracement at 155.38 next.
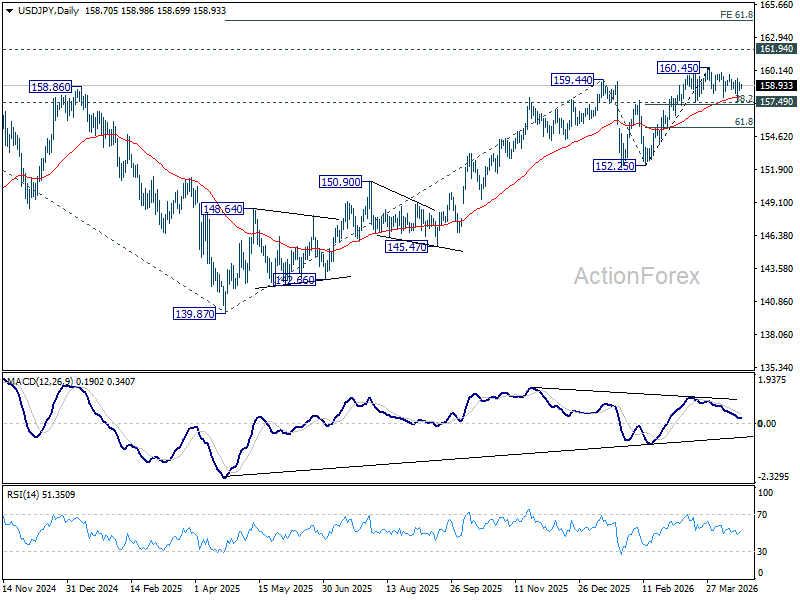
In the bigger picture, outlook is unchanged that corrective pattern from 161.94 (2024 high) should have completed with three waves at 139.87. Larger up trend from 102.58 (2021 low) could be ready to resume through 161.94. This will remain the favored case as long as 55 W EMA (now at 153.80) holds. Firm break of 161.94 will pave the way to 61.8% projection of 102.58 to 161.94 from 139.87 at 176.75.
USD/CHF Daily Outlook
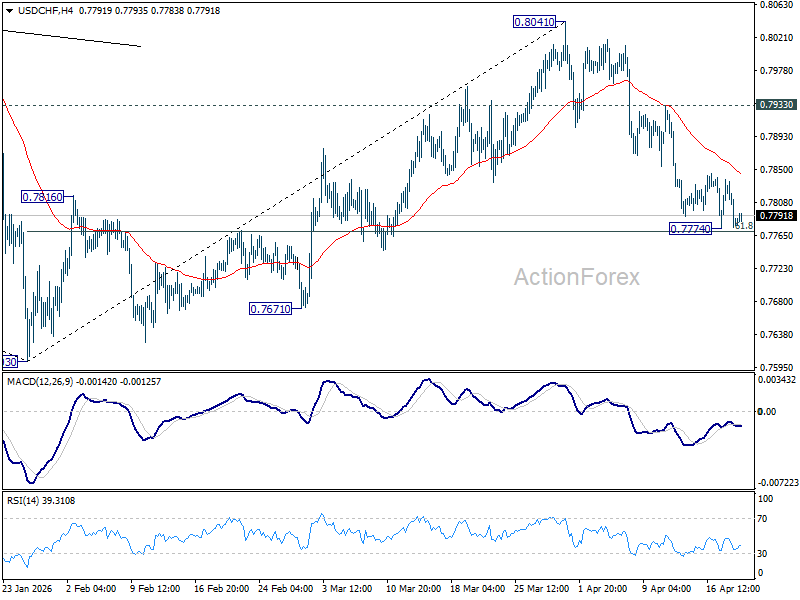
Daily Pivots: (S1) 0.7759; (P) 0.7800; (R1) 0.7824; More….
USD/CHF is still bounded in range above 0.7774 and intraday bias stays neutral at this point. Upside of recovery should be limited below 0.7933 resistance to bring another fall. Sustained break of 61.8% retracement of 0.7603 to 0.8041 at 0.7770 will resume the decline from 0.8041 to retest 0.7603 low.
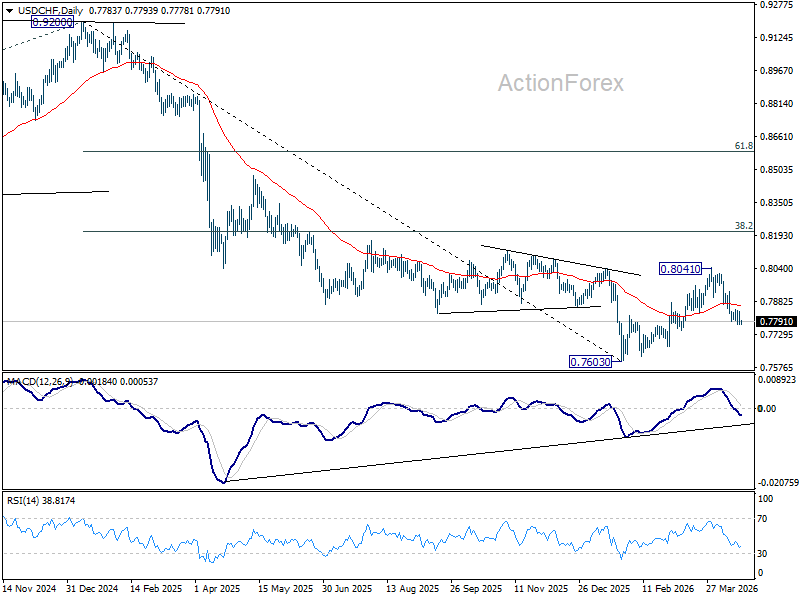
In the bigger picture, rebound from 0.7603 medium term bottom is seen as correcting the fall from 0.9200 only. Rejection by 55 W EMA (now at 0.8059) will affirm this bearish case, and setup down trend resumption to 100% projection of 1.0146 (2022 high) to 0.8332 from 0.9200 at 0.7382 at a later stage. Though, sustained break of 55 W EMA will suggest that it's probably correcting the larger scale down trend from 1.0146 (2022 high).
EUR/USD Daily Outlook
Daily Pivots: (S1) 1.1746; (P) 1.1768; (R1) 1.1809; More….
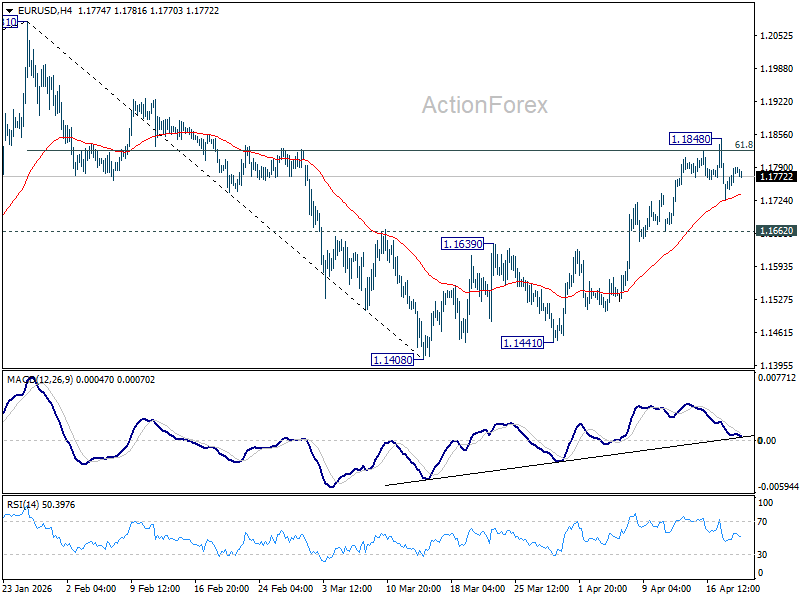
Intraday bias in EUR/USD remains neutral as consolidations continue below 1.1848. Further rally is in favor as long as 1.1662 support holds. On the upside, sustained trading above 61.8% retracement of 1.2081 to 1.1408 at 1.1824 will pave the way to retest 1.2081 high. However, firm break of 1.1662 support will bring deeper decline back towards 1.1408 low instead.
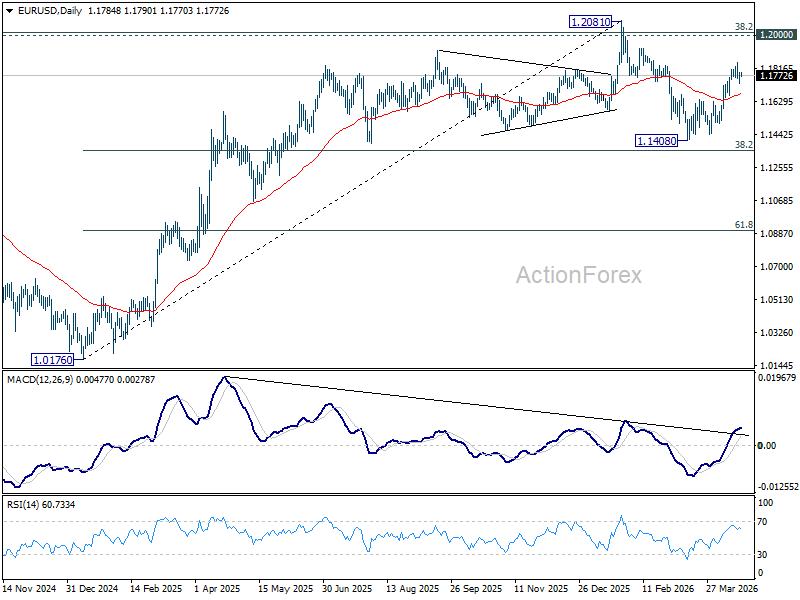
In the bigger picture, the strong support from 38.2% retracement of 1.0176 to 1.2081 at 1.1353 suggests that the pullback from 1.2081 is more likely a corrective move. Strong support was also found in 55 W EMA (now at 1.1507). Focus is back on 1.2 key cluster resistance level. Decisive break there will carry long term bullish implications. Nevertheless, break of 1.1408 support will revive the case of medium term bearish trend reversal.
AUD/USD and NZD/USD Flash Early Signs of Bullish Recovery
AUD/USD is attempting a fresh increase from 0.7115. NZD/USD is consolidating and could aim for a move above 0.5930 in the short term.
Important Takeaways for AUD/USD and NZD/USD Analysis Today
- The Aussie Dollar remained supported above 0.7100 and recovered losses against the US Dollar.
- There is a rising channel forming with resistance at 0.7200 on the hourly chart of AUD/USD at FXOpen.
- NZD/USD is consolidating gains above 0.5900 and 0.5890.
- There is a bullish trend line forming with support at 0.5890 on the hourly chart of NZD/USD at FXOpen.
AUD/USD Technical Analysis
On the hourly chart of AUD/USD at FXOpen, the pair formed a base above 0.7100. The Aussie Dollar started a decent increase above 0.7150 against the US Dollar to enter a short-term positive zone.
The bulls even pushed the pair above the 50% Fib retracement level of the downward move from the 0.7221 swing high to the 0.7114 low and the 50-hour simple moving average. The AUD/USD chart indicates that the pair could struggle to clear the 61.8% Fib retracement at 0.7180.
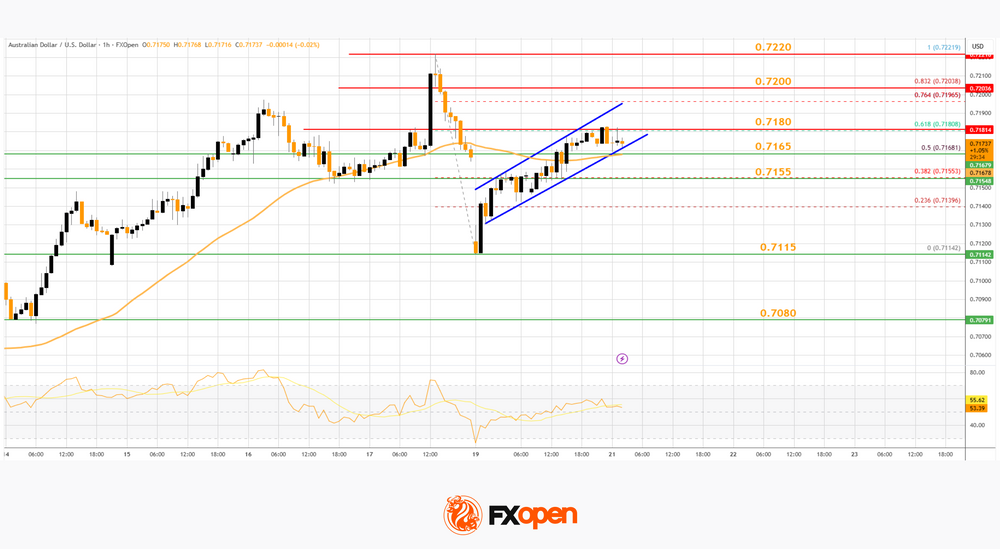
The first major hurdle for the bulls could be 0.7200. There is also a rising channel forming with resistance at 0.7200. An upside break above 0.7200 might send the pair further higher. The next major target might be 0.7220.
Any more gains could clear the path for a move toward 0.7300. If there is no close above 0.7200, the pair might start a fresh decline. Immediate bid zone could be near 0.7165 and the 50-hour simple moving average.
The next area of interest is 0.7155. If there is a downside break below 0.7155, the pair could extend its decline toward 0.7115. Any more losses might signal a move toward 0.7080.
NZD/USD Technical Analysis
On the hourly chart of NZD/USD on FXOpen, the pair also followed AUD/USD. The New Zealand Dollar failed to stay above 0.5920 and corrected gains against the US Dollar.
The pair dipped below 0.5900 and the 50-hour simple moving average. A low was formed at 0.5848, and the pair is now attempting to recover losses. There was a move above the 50% Fib retracement level of the downward move from the 0.5928 swing high to the 0.5848 low.
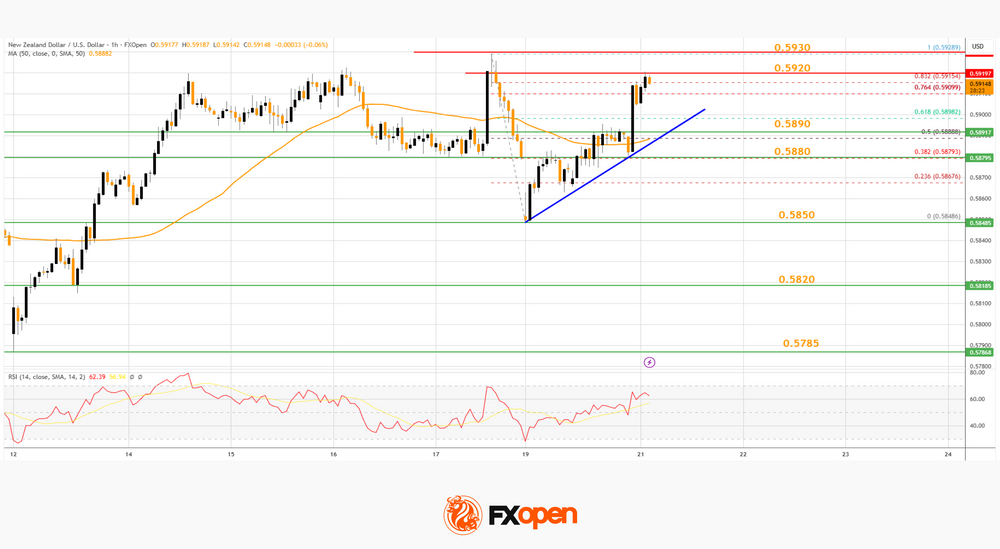
Besides, there is a bullish trend line forming with support at 0.5890. The NZD/USD chart suggests that the RSI is above 50, signaling a short-term positive bias. On the upside, the pair is facing resistance near 0.5920.
The next major hurdle for buyers could be near 0.5930. A clear move above 0.5930 might even push the pair toward 0.5950. Any more gains might clear the path for a move toward the 0.6000 pivot zone in the coming sessions.
On the downside, there is support forming near 0.5890 and the 50-hour simple moving average. If there is a downside break below 0.5890, the pair might slide toward 0.5850. Any more losses could lead NZD/USD into a bearish zone to 0.5820.
Trade over 50 forex markets 24 hours a day with FXOpen. Take advantage of low commissions, deep liquidity, and spreads from 0.0 pips (additional fees may apply). Open your FXOpen account now or learn more about trading forex with FXOpen.
This article represents the opinion of the Companies operating under the FXOpen brand only. It is not to be construed as an offer, solicitation, or recommendation with respect to products and services provided by the Companies operating under the FXOpen brand, nor is it to be considered financial advice.