Sample Category Title
Another Week, Another Gap Down for EURUSD
- The escalation of the conflict in the Middle East has boosted demand for the US dollar.
- Washington and Tehran may be strengthening their positions ahead of negotiations.
The US dollar opened the week with a 0.2% gap upwards, driven by increased demand for safe-haven assets. EURUSD has opened with a downward gap for the second five-day period in a row due to signs of an escalating conflict in the Middle East. First, talks between the US and Iran broke down; now, reports suggest a second round may not take place. No sooner had Tehran announced the opening of the Strait of Hormuz to commercial vessels than the Americans seized one of its tankers. However, it should be noted that the initial fear is being washed out of the market rather quickly. It seems that major players are discerning positive dynamics amidst this chaos.
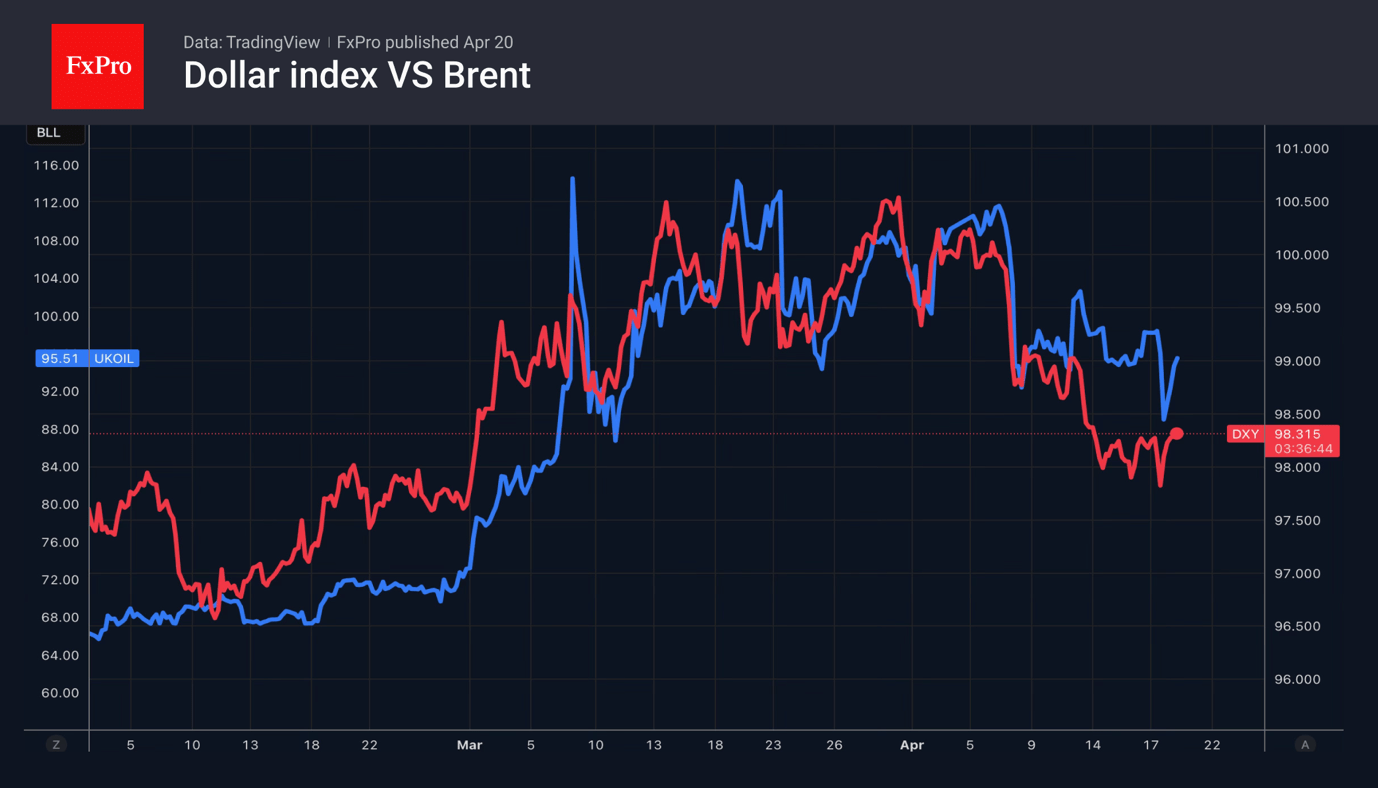
On Tuesday, 21 April, the ceasefire expires. Donald Trump is threatening further air strikes if Iran does not agree to a deal. Investors realise they have gone too far in their desire to jump onto the last carriage of the EURUSD train heading north. The markets, like the US president, have been mistaking wishful thinking for reality. It is time to shed these illusions. An escalation of the conflict in the Middle East risks triggering a renewed rally in oil and the USD index.
The longer the Strait of Hormuz remains blocked, the worse the consequences for the global economy will be. The threat of soaring consumer prices is becoming increasingly real. According to FOMC member Christopher Waller, if inflationary risks outweigh the risks of unemployment, the Fed will have to keep rates at their current level even if the labour market continues to cool. If one of the central bank’s key ‘doves’ says so, the others may start to consider tightening monetary policy. This would support the US dollar.
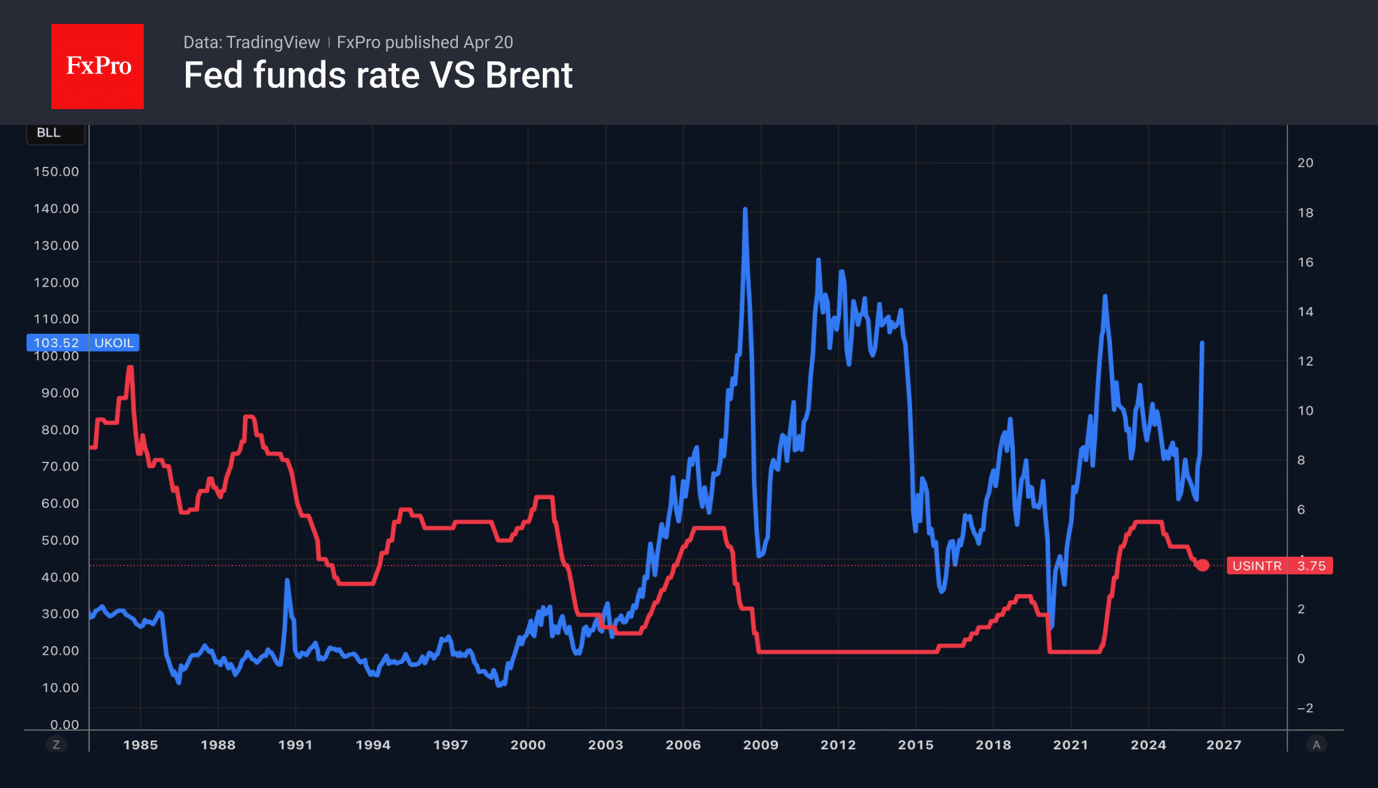
Signs of stagflation may emerge in the economic calendar. Data on business activity in the eurozone, the UK and the US could signal accelerating inflation and slowing economic growth. This would put central banks in an extremely difficult position. Given the ECB’s reluctance to raise its key rate in April, this could provide an opportunity for the bears to launch a counterattack on EURUSD.
The strengthening of the US dollar has caused gold to retreat on fears of accelerating inflation, which will force central banks, led by the Fed, to tighten monetary policy. However, traders are in no hurry to force the issue. The aggressive rhetoric from Washington and Tehran may be nothing more than a desire to strengthen their own positions ahead of the negotiations.
Oil Prices Boost Canadian Inflation in March
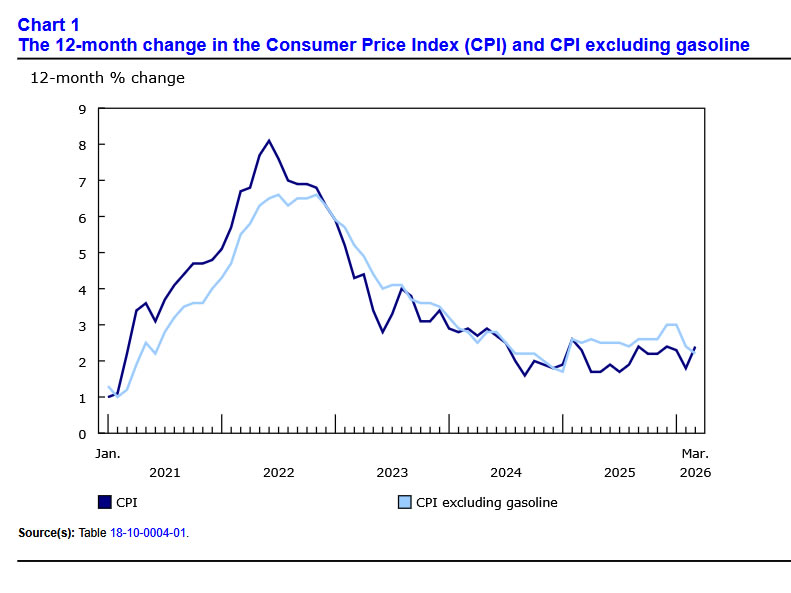
Headline CPI inflation jumped up to 2.4% year-on-year (y/y) in March, slightly less than consensus expectations. Higher energy prices were a big part of the story, with inflation ex-energy up a more modest 2.2% y/y.
Prices at the pump soared 21% in March – the largest increase on record. Energy prices as a whole were 3.9% higher versus a year ago, an about face from being down 9.3% y/y in February. But energy prices a year ago still included the consumer carbon levy, which was removed in April 2025. So the impact of energy on inflation is set to get much larger in next month's data.
Inflation for other key consumer essentials picked up. Grocery inflation picked up again to 4.4% y/y in March, up from 4.1% in February. Shelter inflation also picked up slightly, rising 1.7% y/y, up from 1.5% y/y in February. Despite this, overall services inflation cooled further to 2.5% y/y.
The Bank of Canada has focused on broader "underlying inflation" recently, but the official core inflation metrics (median and trim), cooled slightly in March to 2.3% y/y. Zeroing in on trends over the past three months, trim and median inflation continued to run well below the Bank of Canada's 2% target.
Key Implications
As expected, higher oil prices boosted Canadian inflation in March. Oil prices have fallen in recent days but remain nearly 40% higher than a year ago. That means energy prices are likely to keep headline inflation elevated for some time. April's inflation reading is likely to head much higher as the dampening effect of the removal of the consumer carbon levy falls out of the year-on-year inflation calculation.
Given a generally soft economic backdrop in Canada, we expect the effect on core prices should be more modest. Core inflation is expected to stay reasonably close to the 2% target on a year-on-year basis this year. The Bank of Canada is widely expected to leave its key policy rate unchanged at 2.25% at next week's announcement. We will be listening closely for the Bank's assessment of the impact of the spike in oil prices on Canada's economy.
EUR/USD Mid-Day Outlook
Daily Pivots: (S1) 1.1733; (P) 1.1792; (R1) 1.1823; More….
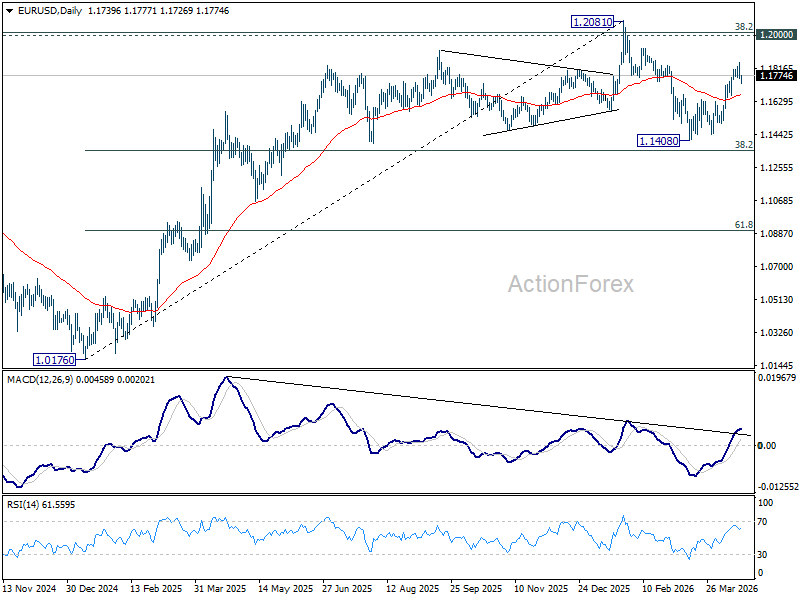
EUR/USD is still extending consolidations below 1.1848 and intraday bias remains neutral. Further rally is in favor as long as 1.1662 support holds. On the upside, sustained trading above 61.8% retracement of 1.2081 to 1.1408 at 1.1824 will pave the way to retest 1.2081 high. However, firm break of 1.1662 support will bring deeper decline back towards 1.1408 low instead.
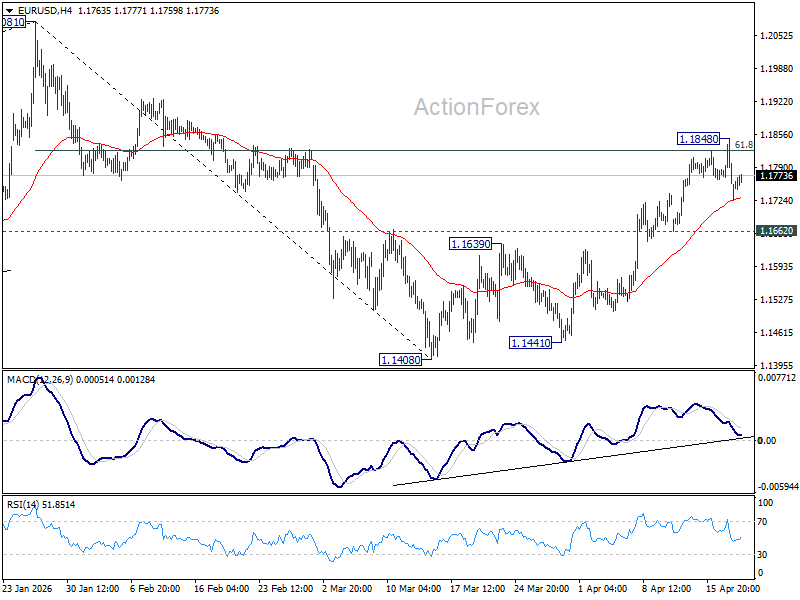
In the bigger picture, the strong support from 38.2% retracement of 1.0176 to 1.2081 at 1.1353 suggests that the pullback from 1.2081 is more likely a corrective move. Strong support was also found in 55 W EMA (now at 1.1507). Focus is back on 1.2 key cluster resistance level. Decisive break there will carry long term bullish implications. Nevertheless, break of 1.1408 support will revive the case of medium term bearish trend reversal.
GBP/USD Mid-Day Outlook
Daily Pivots: (S1) 1.3480; (P) 1.3540; (R1) 1.3575; More...
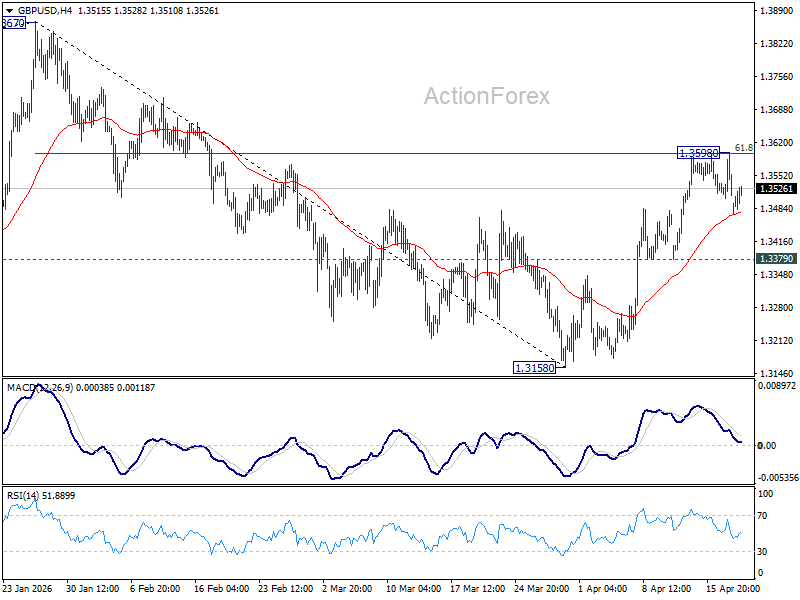
GBP/USD is still extending consolidations below 1.3598 and intraday bias remains neutral. Further rise is in favor as long as 1.3379 support holds. Sustained break of 61.8% retracement of 1.3867 to 1.3158 at 1.3596 will pave the way to retest 1.3867 high. However, firm break of 1.3379 will bring deeper fall back to 1.3158 low instead.
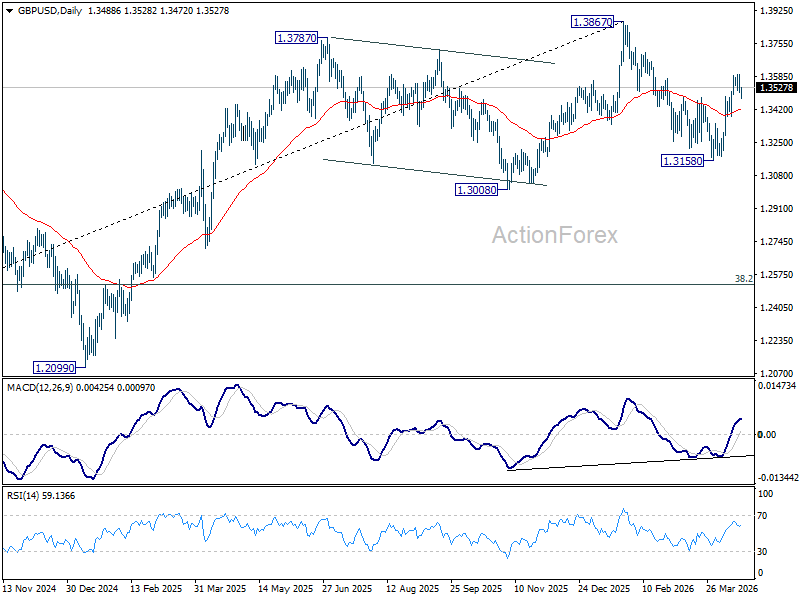
In the bigger picture, current development suggests that price actions from 1.3867 are merely a corrective pattern within the broader up trend from 1.0351 (2022 low). With 1.3008 support intact, medium term bullishness is maintained and break of 1.3867 is back in favor for a later stage, towards 1.4248 key resistance (2021 high).
USD/JPY Mid-Day Outlook
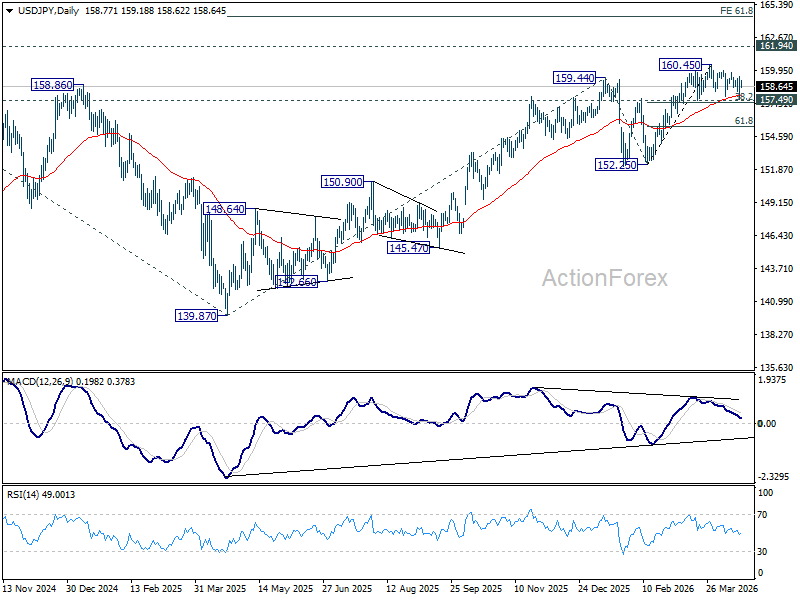
Daily Pivots: (S1) 157.63; (P) 158.58; (R1) 159.56; More...
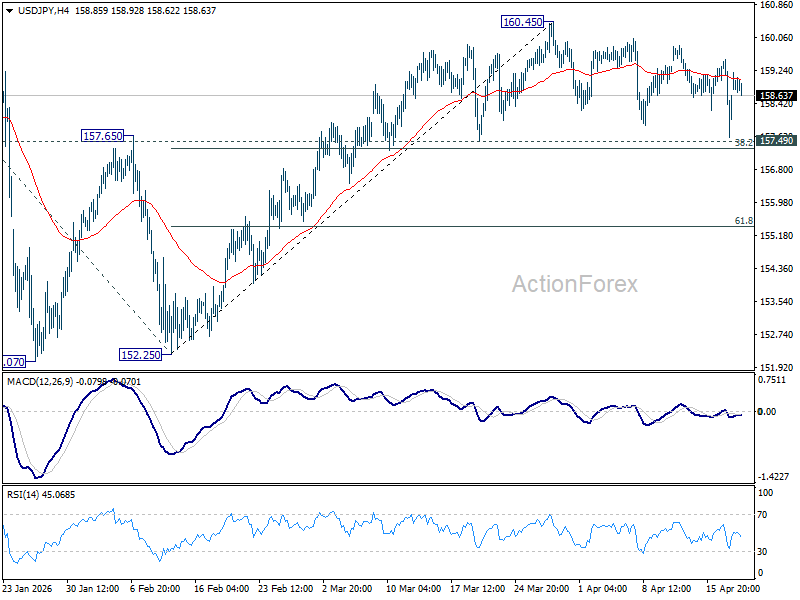
Intraday bias in USD/JPY remains neutral at this point, as consolidations continue below 160.45 short term top. Further rise is expected with 157.49 cluster support (38.2% retracement of 152.25 to 160.45 at 157.31) intact. On the upside break of 160.45 will target a retest on 161.94 high. However, firm break of 157.31/49 will bring deeper fall back to 61.8% retracement at 155.38 next.
In the bigger picture, outlook is unchanged that corrective pattern from 161.94 (2024 high) should have completed with three waves at 139.87. Larger up trend from 102.58 (2021 low) could be ready to resume through 161.94. This will remain the favored case as long as 55 W EMA (now at 153.80) holds. Firm break of 161.94 will pave the way to 61.8% projection of 102.58 to 161.94 from 139.87 at 176.75.
USD/CHF Mid-Day Outlook
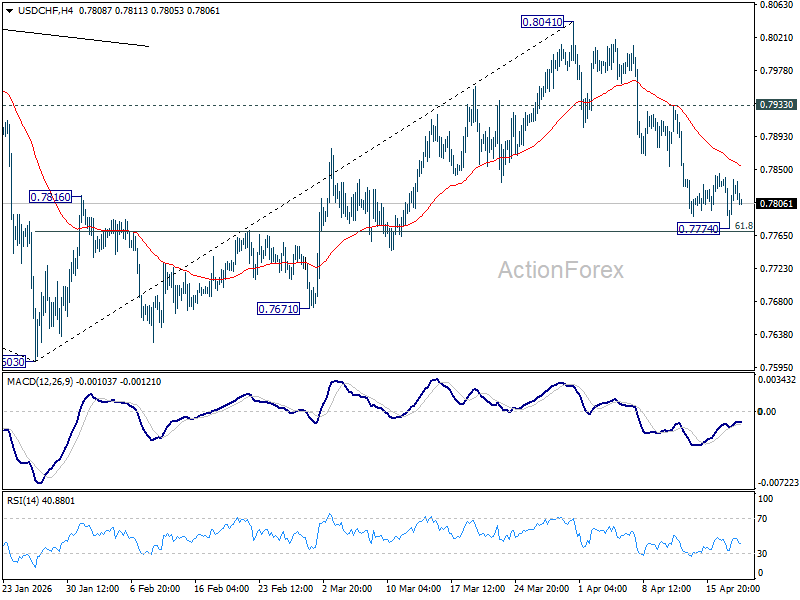
Daily Pivots: (S1) 0.7780; (P) 0.7811; (R1) 0.7847; More….
USD/CHF is staying consolidations above 0.7774 temporary low and intraday bias remains neutral. Upside of recovery should be limited below 0.7933 resistance to bring another fall. Sustained break of 61.8% retracement of 0.7603 to 0.8041 at 0.7770 will resume the decline from 0.8041 to retest 0.7603 low.
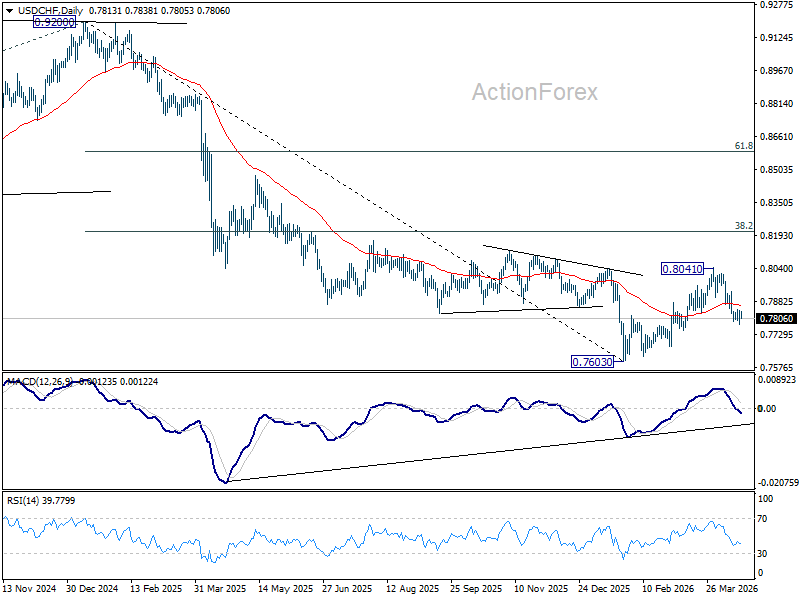
In the bigger picture, rebound from 0.7603 medium term bottom is seen as correcting the fall from 0.9200 only. Rejection by 55 W EMA (now at 0.8059) will affirm this bearish case, and setup down trend resumption to 100% projection of 1.0146 (2022 high) to 0.8332 from 0.9200 at 0.7382 at a later stage. Though, sustained break of 55 W EMA will suggest that it's probably correcting the larger scale down trend from 1.0146 (2022 high).
Markets on Hold Pending US–Iran Talks, Warsh Fed Chair Hearing Next Catalyst
Markets are broadly steady today as traders hold back from taking directional positions, waiting for clarity on whether a second round of US–Iran talks will take place in Islamabad before the April 22 ceasefire deadline. Despite rising geopolitical tension, price action across assets suggests a clear lack of conviction.
The ceasefire is visibly fraying, with multiple escalations in recent days, yet markets are not reacting decisively. The key reason is simple: there is still no confirmation on whether talks will proceed. Until there is a definitive “go” or “no-go” signal, the situation remains unresolved from a trading perspective.
This leaves markets stuck in a holding pattern. Dollar strength seen earlier on geopolitical headlines has faded without follow-through, reflecting hesitation rather than conviction. Traders are unwilling to chase moves that could quickly reverse depending on diplomatic developments.
Equities tell a similar story. Major European indices are trading lower and US futures are in the red, but losses remain limited. The absence of aggressive selling suggests that investors are adjusting to rising risks, rather than pricing in a full escalation scenario.
Oil remains the clearest signal—and it is not confirming escalation. Prices jumped as the “peace trade” receded, but remain below the critical $100 level. As long as that threshold holds, markets are reluctant to shift into full risk-off positioning.
In currency markets, positioning reflects caution rather than conviction. Swiss Franc leads gains, followed by Dollar, while risk-sensitive currencies like Aussie and Kiwi lag. The distribution suggests a mild defensive bias, but not a full shift into risk aversion.
While geopolitics dominates the immediate outlook, a second catalyst is approaching from the policy side. Kevin Warsh is set to appear before the Senate Banking Committee on April 21 for his nomination hearing to become the next Federal Reserve Chair, succeeding Jerome Powell when his term ends on May 15. The timing is tight, and the process is far from straightforward.
Warsh is widely seen as a credible candidate with deep ties to financial markets and the Republican establishment. However, his confirmation path is complicated by political dynamics that go beyond standard nomination procedures. The Senate Banking Committee remains narrowly divided, meaning even a single Republican defection could derail the process.
The most immediate obstacle is Thom Tillis, who has publicly stated he will block any Federal Reserve nominations until the Department of Justice investigation into Powell is dropped. In a 13–11 committee split, Tillis effectively holds a deciding vote. Without his support, Warsh’s nomination may not even reach the full Senate floor.
On the other side, Democrats led by Elizabeth Warren have called for a delay in the hearing, arguing it is inappropriate to confirm a successor while the sitting Chair is under active investigation. Combined with earlier procedural delays, the risk is that the confirmation timeline slips dangerously close to Powell’s May 15 exit, raising the prospect of leadership uncertainty at the Fed—an issue that markets are not yet pricing, but cannot ignore for long.
For now, markets are waiting. Without confirmation on US–Iran talks, there is little incentive to commit. But if geopolitical signals remain inconclusive, attention may quickly shift toward policy uncertainty as the next driver.
Canada Inflation Jumps to 2.4% yoy in March, Gasoline Prices Up Record 21.2% mom
Canada inflation jumped to 2.4% in March as gasoline prices surged a record 21.2% on the month. The spike highlights how energy shocks are pushing headline inflation higher—even as underlying pressures remain more contained. Read More.
NZD/USD Eyes CPI as RBNZ Assess Pre-Shock Inflation Pressures
NZ CPI may show cooling inflation—but the real question is whether it was already sticky before the oil shock. With core inflation in focus, the data could shift RBNZ rate expectations and drive the next move in NZD/USD. Read More.
China Holds LPR Steady for 11th Month, Signals Stability Amid Global Risks
China kept its benchmark lending rates unchanged for an 11th straight month, reinforcing a cautious stance as policymakers balance growth support against rising global risks. With the PBoC signaling a “moderately loose” policy bias but prioritizing currency stability, markets are watching how Beijing navigates geopolitical and trade tensions. Read More.
New Zealand Posts NZD 698M Trade Surplus as China, Australia Drive Export Growth
New Zealand’s trade surplus held at NZD 698M in March as exports climbed on strong demand from China and Australia, but a faster surge in imports signals rising domestic demand and cost pressures. Read More.
Gold Drops as Ceasefire Cracks, But Oil Says Markets Aren’t Pricing War Yet
Gold drops as US–Iran ceasefire cracks, but oil below $100 signals markets aren’t pricing war. Fading momentum leaves gold vulnerable to a deeper move toward the 4,000 level if tension turns into conflicts. Read More.
USD/CHF Mid-Day Outlook
Daily Pivots: (S1) 0.7780; (P) 0.7811; (R1) 0.7847; More….
USD/CHF is staying consolidations above 0.7774 temporary low and intraday bias remains neutral. Upside of recovery should be limited below 0.7933 resistance to bring another fall. Sustained break of 61.8% retracement of 0.7603 to 0.8041 at 0.7770 will resume the decline from 0.8041 to retest 0.7603 low.
In the bigger picture, rebound from 0.7603 medium term bottom is seen as correcting the fall from 0.9200 only. Rejection by 55 W EMA (now at 0.8059) will affirm this bearish case, and setup down trend resumption to 100% projection of 1.0146 (2022 high) to 0.8332 from 0.9200 at 0.7382 at a later stage. Though, sustained break of 55 W EMA will suggest that it's probably correcting the larger scale down trend from 1.0146 (2022 high).
Canada Inflation Jumps to 2.4% yoy in March, Gasoline Prices Up Record 21.2% mom
Canada’s inflation picked up in March as CPI rose from 1.8% yoy to 2.4% yoy, driven largely by a sharp rebound in energy prices, but missed expectation of 2.5% yoy. On a monthly basis, CPI increased 0.9% mom, also below expectation of 1.1% mom. Higher fuel costs linked to the Middle East conflict pushed headline inflation higher, offsetting softer underlying trends.
Energy was the dominant driver. Prices surged 13.1% mom on the month and swung from a -9.3% yoy decline in February to a 3.9% yoy increase. Gasoline led the move, rising 21.2% mom—the largest monthly increase on record—and 5.9% yoy, reflecting supply disruptions tied to geopolitical tensions. Fuel oil and other fuels also climbed sharply, up 26.1% yoy.
Despite the headline strength, underlying inflation pressures showed signs of easing. Excluding gasoline, CPI rose at a slower annual pace of 2.2% yoy compared with 2.4% yoy previously, suggesting that domestic price momentum remains contained for now. Even so, CPI common—a key core measure—accelerated from 2.4% yoy to 2.6% yoy, indicating that some underlying pressures are still building.
The data reinforces a familiar pattern: energy shocks are pushing headline inflation higher, while core trends remain more mixed. For the Bank of Canada, the key question will be whether these price increases begin to spill over into broader components. If second-round effects emerge, the current balance could shift quickly, complicating the policy outlook in the months ahead.
Crypto Market Has Taken a Step Back, While Remaining in an Uptrend
Market Overview
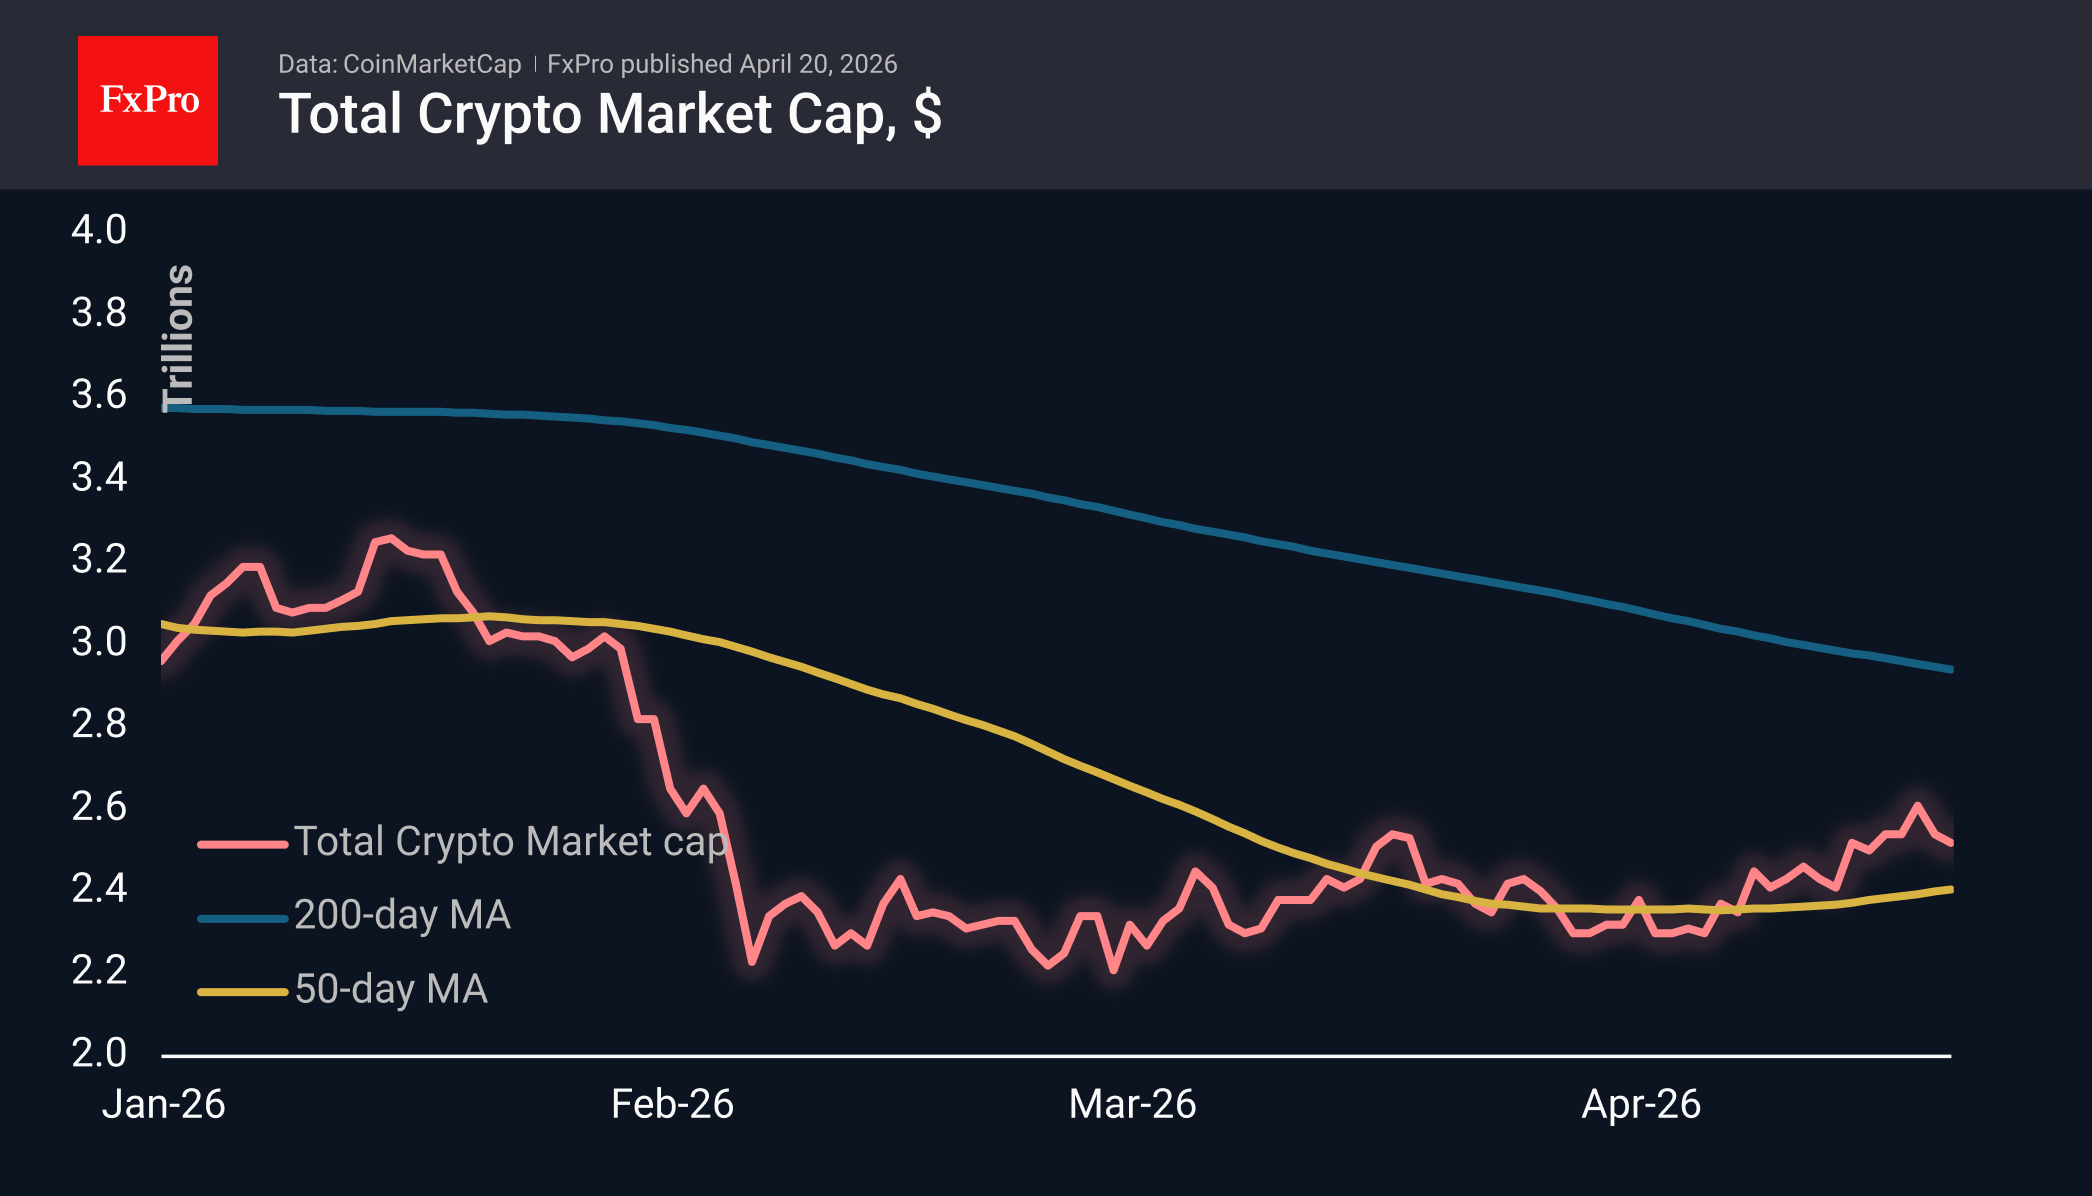
The cryptocurrency market capitalisation stands at $2.53T, down 0.81% over the past 24 hours but up 5% over the past week. The day’s top performers were SUSHI (+2.5%), IOTA (+2%) and NEAR (+2%). Among the underperformers were ZEC (−4.1%), ALGO (−2.5%) and ETH (−0.4%). The Fear and Greed Index rose to 29 points — its highest level since 28 January.
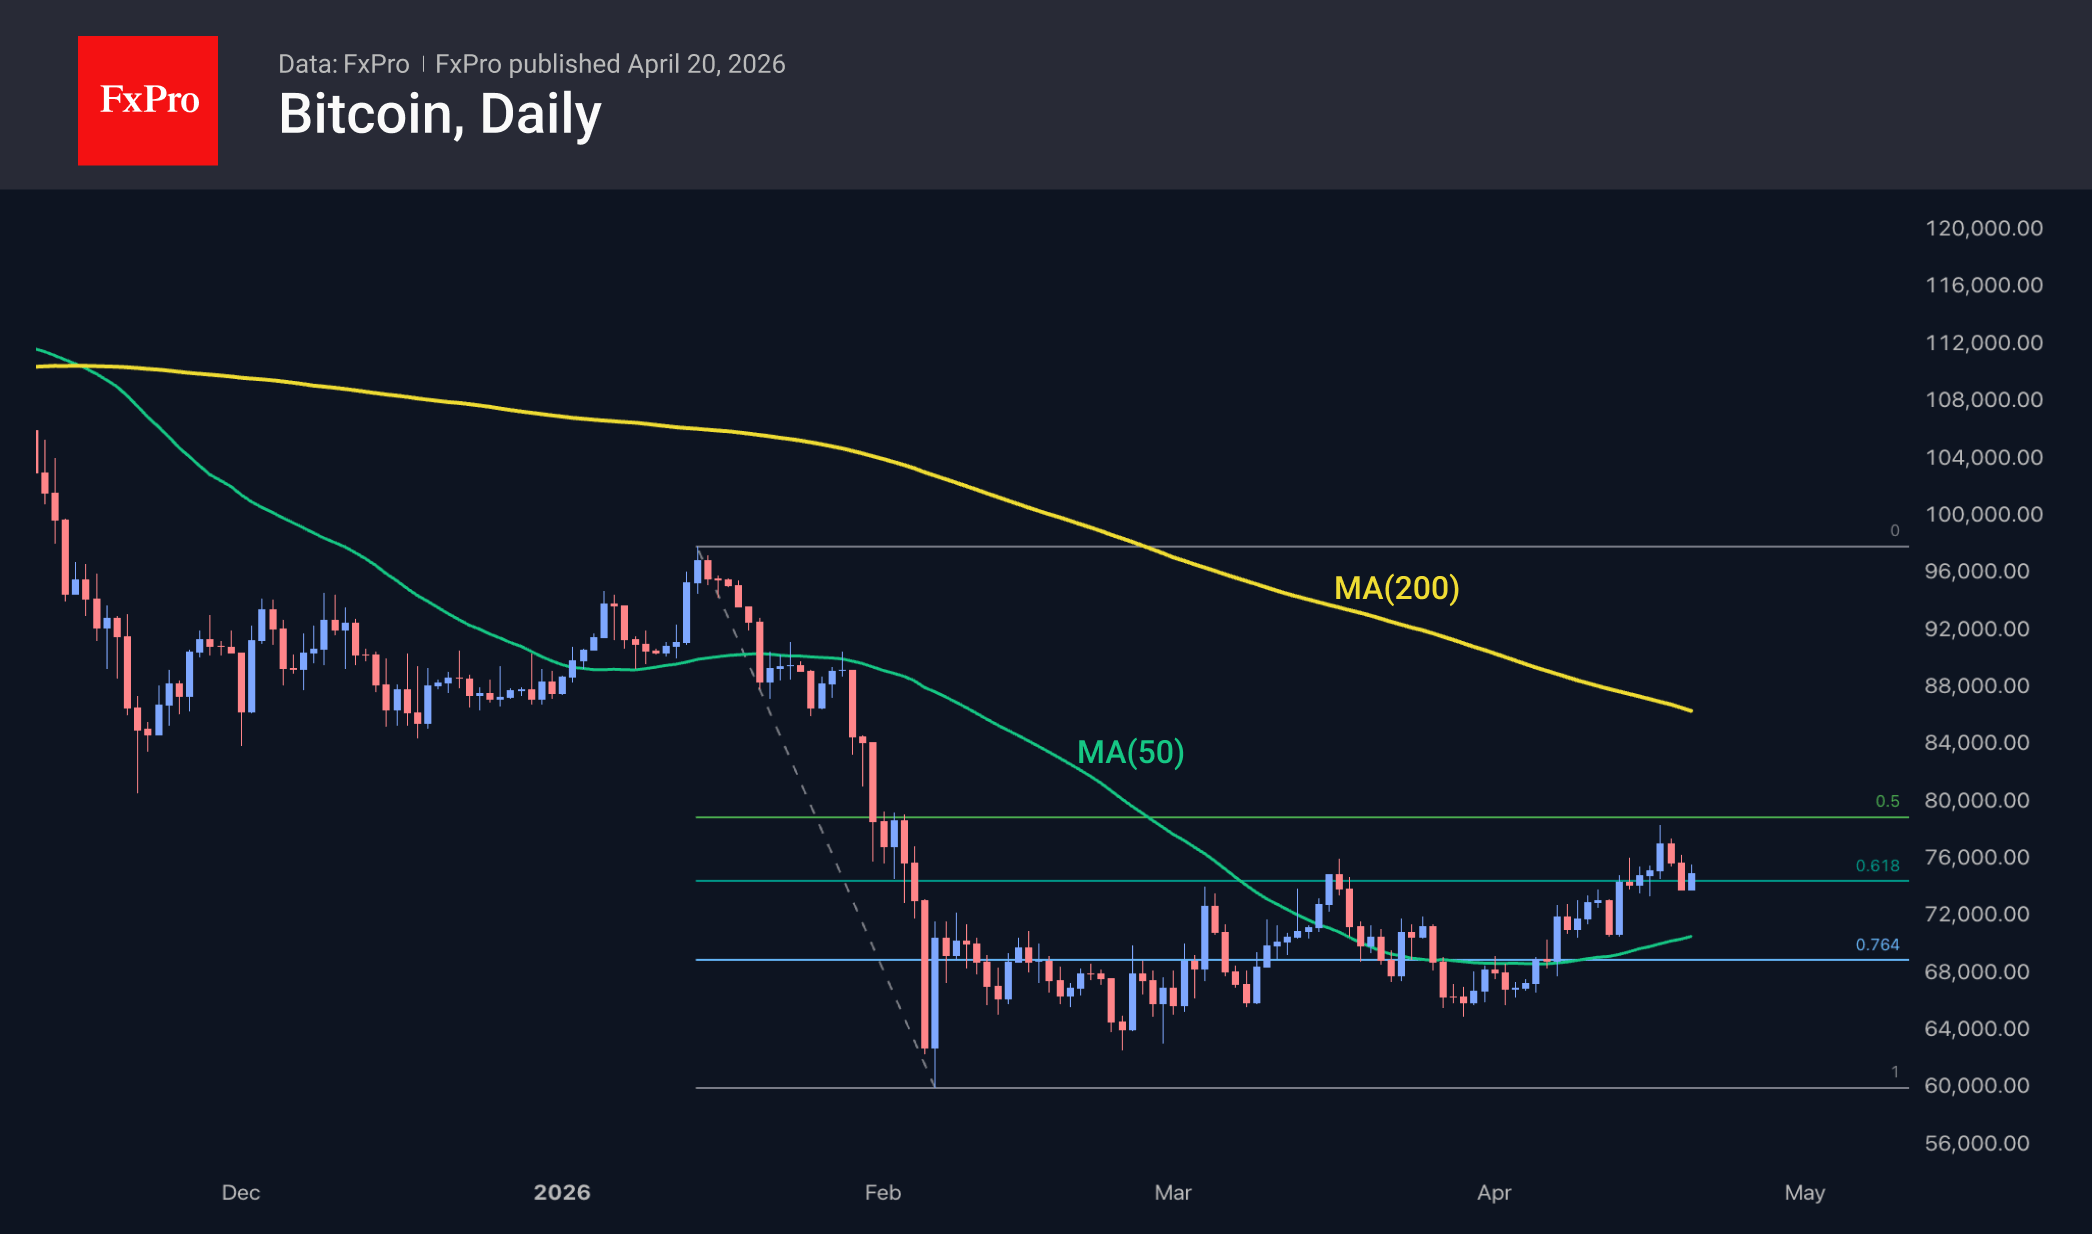
Bitcoin is trading just below $75K on Monday morning, having retreated from last week’s highs above $78K. For now, we view the current movement as a pullback within an uptrend, rather than a reversal back to a downtrend. The pressure on the leading cryptocurrency is linked to negative reactions in stock markets to news about Iran, which has reduced risk appetite. BTC has lagged significantly behind equities in recent days, building up potential but not yet rushing to realise it.
News Background
According to SoSoValue, net inflows into spot BTC ETFs rose to $996.4 million. Net weekly inflows into US spot Ethereum ETFs totalled $275.8 million.
According to Glassnode, positioning in the options market remains uncertain. Nexo confirms the contradiction: the rally is gaining momentum, but the derivatives market does not believe in it.
Bitcoin’s return above $75,000 is met with scepticism: funding rates on perpetual futures have remained in negative territory for around 46 consecutive days, notes Bloomberg. This is one of the longest periods of bearish sentiment in the history of derivatives, comparable only to the aftermath of the FTX crypto exchange collapse in late 2022.
Traders are actively building up short positions, betting against a breakout. This creates conditions under which a short squeeze becomes more likely should the upward momentum persist, notes K33 Research. A break above $76,000 could send BTC towards $85,000, suggests Kaiko.
According to TheEnergyMag, public mining companies sold a record 32,000 BTC in the first quarter amid a record-low hash rate. This is more than in the whole of 2025. The figure also exceeds the second-quarter 2022 data, when miners liquidated 20,000 BTC following the collapse of the Terra (LUNA) ecosystem.
As a result of the latest adjustment, Bitcoin’s mining difficulty fell by 2.43% to 135.59 T. According to Glassnode, the BTC network’s hash rate, smoothed by a 7-day moving average, has recovered from ~978 EH/s to ~992 EH/s since the start of the month.
XAU/USD: Gold Price Drops on Renewed Geopolitical Tensions and Stronger Dollar
Gold opened with gap-lower on Monday, hitting levels around $150 lower from Friday’s high, as sentiment changed again on escalation over the weekend that resulted in closure of Hormuz strait.
Fresh negative developments on the ground faded optimism and revived fears about inflation and other factors surrounding war environment, with higher dollar and oil prices.
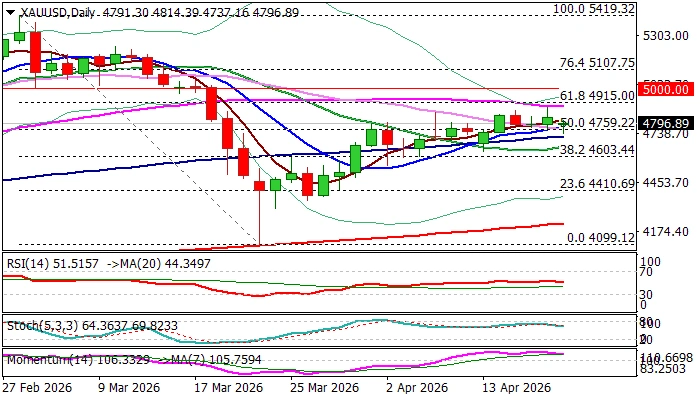
Technical picture, however, did not change significantly after Friday’s / today swings, as the price still holds above significant support at $4759 (broken Fibo 50% of $5419/$4099, reinforced by 10DMA), which marks the floor of near-term range (that extends into fifth consecutive session).
Near-term action is likely to remain in sideways mode while range boundaries ($4759 / $4891 -55DMA) hold, with conflicting indicators on daily chart (MAs in predominantly bullish configuration, countered by weaker momentum studies / price weighed by daily cloud).
Markets will be looking for a fresh catalyst from dynamics in geopolitical picture, with violation of current range boundaries to generate initial direction signals.
In the negative scenario, violation of $4759 pivot would weaken near-term structure and risk acceleration towards supports at $4700 (round-figure), $4663 (20DMA) and $4603 (broken Fibo 38.2%).
Conversely, break of $4891 and nearby $4915 (Fibo 61.8%) would unmask psychological $5000 barrier.
Res: 4871; 4891; 4915; 5000.
Sup: 4759; 4700; 4663; 4603.