

Sample Category Title
Oil Surges 6% as Sentiment Sours, Nikkei Rises. US-Iran Developments in Focus
- Geopolitical tensions between the US and Iran escalated over the weekend, causing market sentiment to dive.
- The US dollar reclaimed its footing, hitting a one-week high as the optimistic "peace deal" narrative crumbled.
- The immediate market direction hinges on diplomatic efforts ahead of Tuesday’s ceasefire deadline.
- The overall outlook anticipates the DXY to maintain a defensive posture.
Market sentiment took a dive this morning after weekend tensions between Iran and the US reared its head once more.
The ceasefire remains fragile and will be tested at the start of the week after the US seized an Iranian cargo ship and traffic through the Strait of Hormuz remained largely halted. President Donald Trump struck a cautiously optimistic tone, suggesting that Iran has committed to keeping the Strait of Hormuz open.
Despite the "completely open" announcement made on Friday, market sentiment was quickly dampened by reports of the Islamic Revolutionary Guard Corps (IRGC) targeting tankers within 24 hours of the statement. This immediate escalation serves as a grim reminder that while political agreements provide a temporary reprieve, the operational risks in the region remain elevated.
The impact from these developments saw oil prices rise more than 6% in early Monday trade. Gold on the other hand opened around $40 down from its Friday close before dropping to a daily low around the 4737 mark. The precious metal ground its way back toward the $4800/oz mark which seems to be the immediate hurdle to cross and gain acceptance above for a move higher.
All in all risk assets are lower, one of the few exceptions being Japan's Nikkei share average which rose on the day. The benchmark Nikkei 225 Index rose 0.60% to close at 58,824.89 compared with its record intraday level of 59,688.10 touched on Thursday. The broader Topix climbed 0.43% to 3,777.02.
Dollar Finds Support on Safe-Haven Bid
The US dollar reclaimed its footing on Monday, hitting a one-week high against a basket of major peers as the optimistic "peace deal" narrative began to crumble.
The catalyst for the greenback's resurgence stems from Tehran’s refusal to participate in a second round of negotiations, casting significant doubt on the longevity of the two-week ceasefire set to expire this Tuesday.
The shift in sentiment was felt across the G10 space, with high-beta and risk-sensitive currencies bearing the brunt of the move:
Euro (EUR/USD): The single currency slipped 0.05% to $1.1754, having earlier touched a weekly low of $1.1729.
Sterling (GBP/USD): Cable followed suit, trading 0.15% lower at $1.3497 as the broader "risk-off" mood took hold.
Aussie (AUD/USD): The most sensitive to shifts in global stability, the Australian dollar dropped 0.3% to $0.7145.
Currency Power Balance
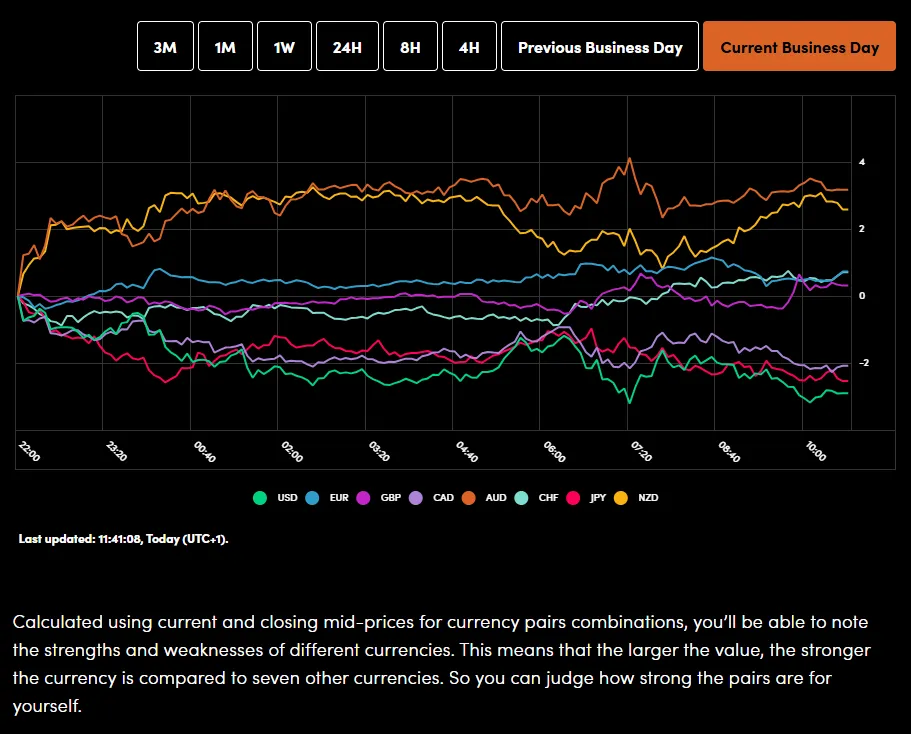
Source: OANDA Labs
European Open: Geopolitical risk roils markets
European equities began the week on a negative note, with the STOXX 50 down 1.3% and the STOXX 600 falling 0.9%.
Travel and leisure stocks fell sharply, with Ryanair tumbling 3.5% while energy outperformed, including Shell (2.5%).
US stock index futures inched lower while the CBOE Volatility Index .VIX, known as Wall Street's "fear gauge", gained after falling for the last eight sessions and was last up 2.25 points at 19.73, a one-week high.
Looking Ahead
The immediate market direction hinges on whether the diplomatic efforts in Pakistan yield a breakthrough or if the "tough talk" escalates ahead of tomorrow’s ceasefire deadline. The key barometer for progress will be the physical presence of Iranian negotiators. While the current "market mood music" remains anxious, there is a subtle undercurrent of hope for a resolution that could spark a relief rally in risk assets.
Tuesday’s Triple Threat: Warsh, Ceasefires, and Retail Sales Tomorrow stands as the pivotal session for the week, defined by three key catalysts:
- The Ceasefire Deadline: Expiration without a deal could reignite a sharp flight to safety.
- Kevin Warsh’s Confirmation: His Senate hearing for the Fed Chair role will be scrutinized. Expect a "split personality" approach: dovish on interest rates but hawkish on shrinking the Fed's balance sheet.
- US Retail Sales (March): Expected to remain resilient despite the energy tax on consumers, reinforcing the "higher for longer" narrative.
Chart of the Day - DXY
The US Dollar Index (DXY) is currently attempting to claw back recent losses, trading near the 98.24 handle after a sharp decline earlier this month. On the H4 chart, the index has found strong structural support around the 97.70 level, where a series of "BULL" signals and RSI divergence suggest a near-term bottom may be in place.
Key Levels to Watch:
- Resistance: Immediate upside pressure faces a stern test at 98.73 (red horizontal). A break above this could see the index rally toward the 99.21 (100-SMA) and 99.35 (200-SMA) confluence zone.
- Support: The 97.70 area remains the critical floor. A daily close below this pivot would invalidate the current recovery and open the door for a move toward the 97.00 psychological mark.
With the RSI (14) rising from oversold territory and currently at 48.65, momentum is shifting back to the bulls. However, until the DXY reclaims its moving averages, the broader bias remains neutral to bearish.
USD Index Four-Hour Chart, April 20, 2026
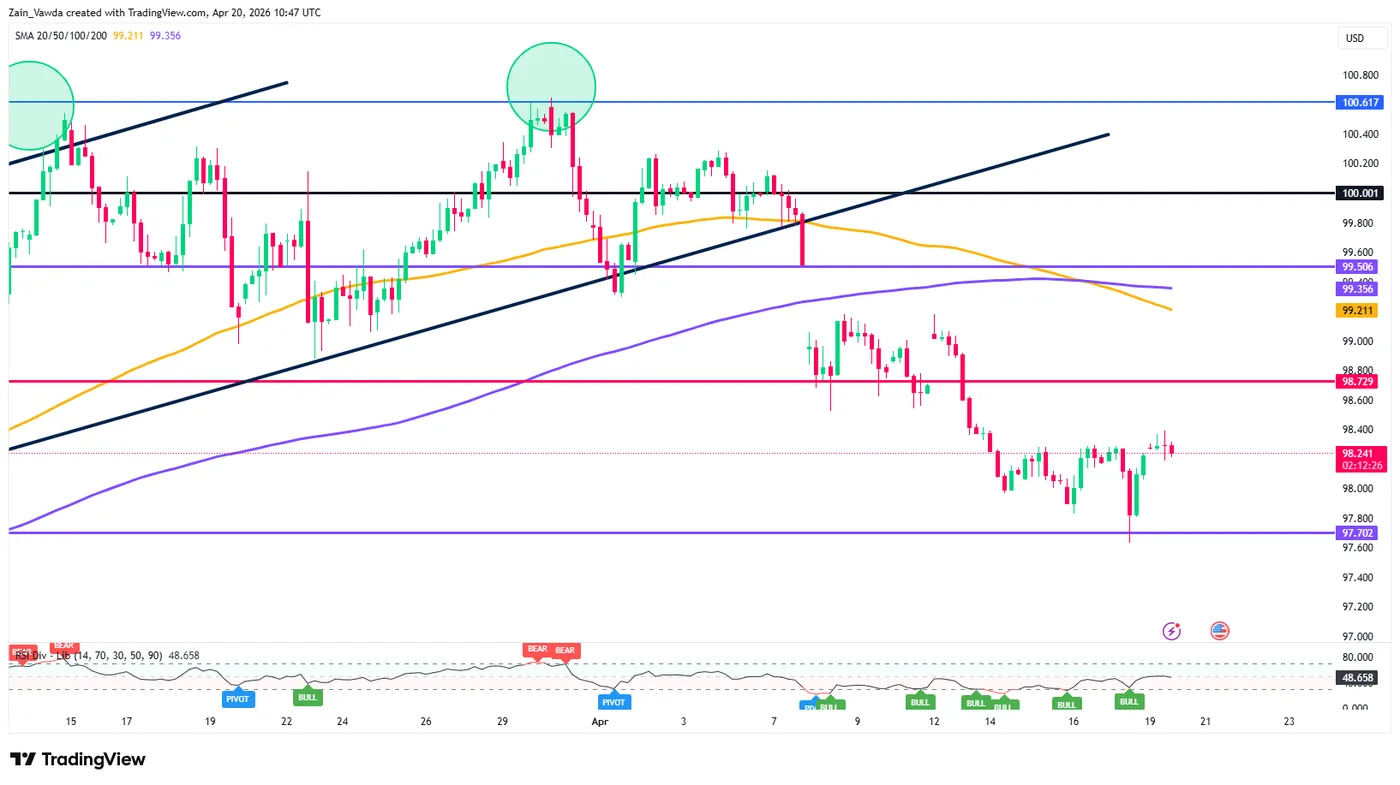
Source: TradingView.com (click to enlarge)
NZD/USD Eyes CPI as RBNZ Assess Pre-Shock Inflation Pressures
New Zealand inflation data will be a major focus in the upcoming Asian session. Q1 CPI may show modest cooling, but the real question is whether inflation was already sticky before the oil shock hit. With the Iran conflict only beginning to impact energy prices late in the quarter, Q1 data will offer a relatively clean read on underlying inflation dynamics before the full effect of recent supply shocks.
Forecasts are narrowly split. Headline CPI is expected to ease from 3.1% yoy to around 2.9–3.1% yoy, but that range masks uncertainty beneath the surface. Markets are less focused on the headline print and more on non-tradables inflation, which captures domestic price pressures tied to wages and services.
This is where the policy implications become more significant. The Reserve Bank of New Zealand has already shifted toward a more cautious, hawkish stance, signaling it will “look through” direct fuel price impacts but not tolerate "second-round effects". If underlying inflation is already proving sticky in Q1, it would raise the risk that the upcoming energy shock feeds more aggressively into broader pricing.
“Q1 is signal, Q2 is confirmation.” That framework is central to how markets are approaching this release. Q1 sets the baseline for underlying inflation, while Q2 will reveal how much of the energy-driven price pressure is transmitted through the economy. A firm Q1 print would therefore amplify concerns about inflation persistence rather than alleviate them.
If non-tradables inflation remains elevated, the RBNZ may be pushed closer to resuming tightening, potentially bringing forward expectations for a rate hike in Q3. Even without a headline surprise, underlying stickiness would be enough to shift the policy outlook.
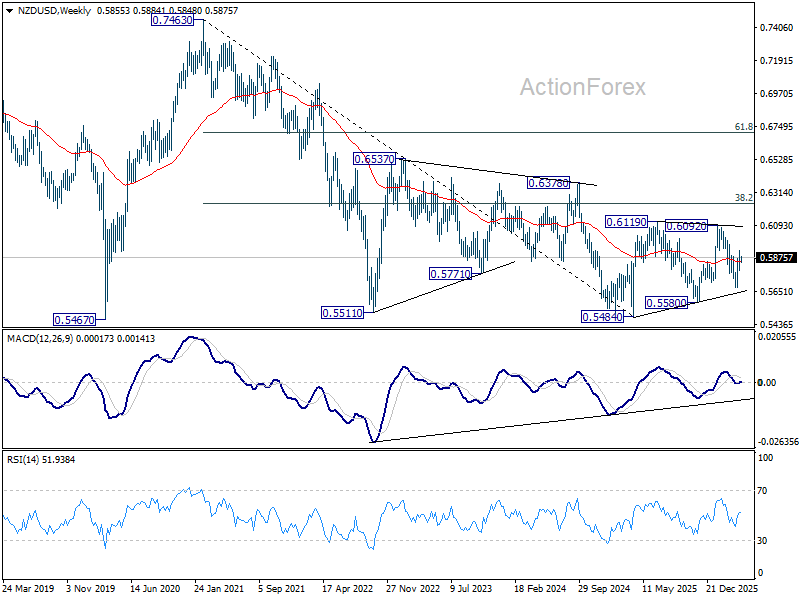
For NZD/USD, the rebound from 0.5678 suggests the prior decline from 0.6092 has completed in the near term. Yet, the broader structure remains one of consolidation (from 0.5484) within a larger downtrend. While gains may extend as long as 0.5793 holds, resistance at 0.6092–0.6119 is likely to cap upside.
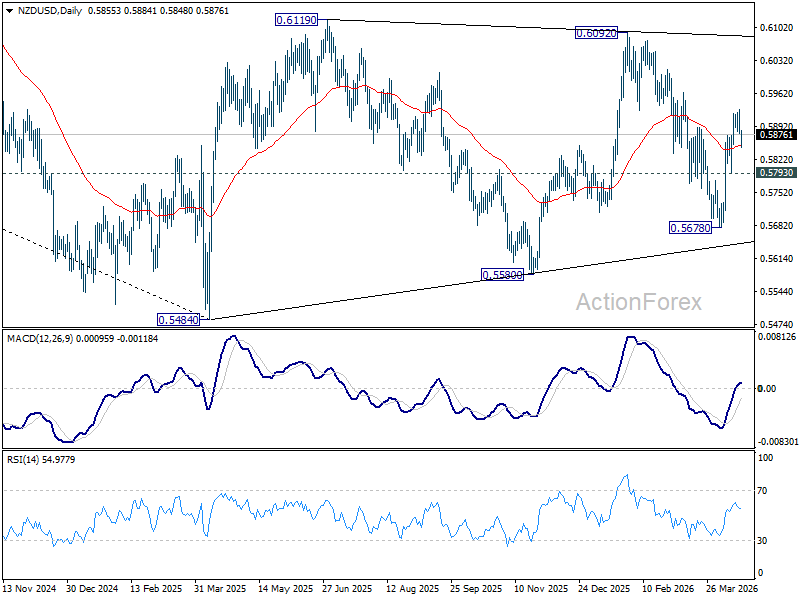
On the downside, break of 0.5793 will bring deeper fall to 0.5678 support first. Further break there will argue that the down trend from 0.7463 (2021 high) is ready to resume through 0.5484 (2025 low).
EUR/USD Starts the Week Higher, but the Outlook Remains Unstable
EUR/USD moved higher on Monday after a correction, trending towards 1.1759. Earlier, the US dollar had partially regained ground following last week's decline, supported by increased demand for safe-haven assets amid an escalation of the US-Iran conflict.
Donald Trump reported that the US Navy opened fire and detained an Iranian ship in the Gulf of Oman after it failed to comply with orders when leaving the Strait of Hormuz.
Tehran, in turn, abandoned plans to open the strait after Washington failed to lift the blockade of Iranian ports. Iran also signalled it would not participate in the second round of talks.
The protracted conflict is increasing risks to energy supplies, intensifying inflationary pressure, and reducing the likelihood of policy easing. Markets are revising their expectations, with the probability of a Fed rate cut diminishing this year.
The baseline scenario now assumes rates will remain unchanged in the coming months, likely through the end of 2026.
Technical Analysis
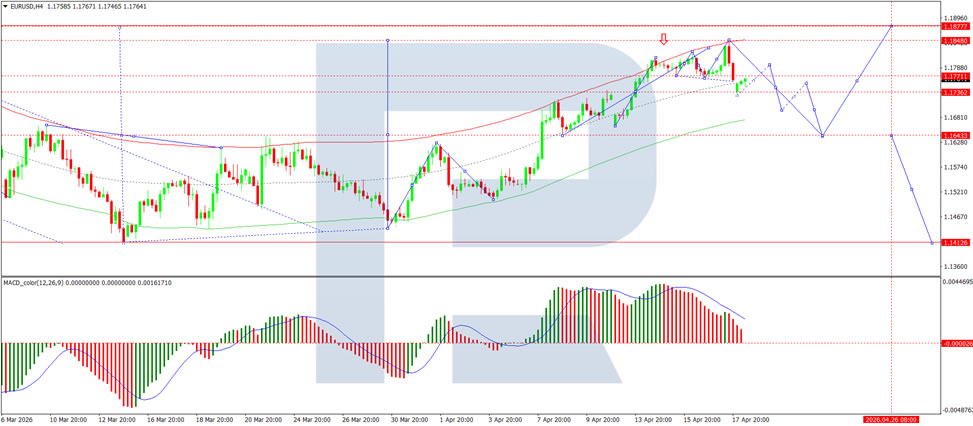
On the H4 chart of EUR/USD, the market is forming a consolidation range around the 1.1800 level, currently extending down to 1.1737. An upward wave to 1.1790 is likely. Subsequently, a downward wave to 1.1700 could develop. Technically, this scenario is confirmed by the MACD indicator, with its signal line above the zero level but pointing firmly downwards, reflecting continued bearish momentum with the potential for the downward trend to persist.
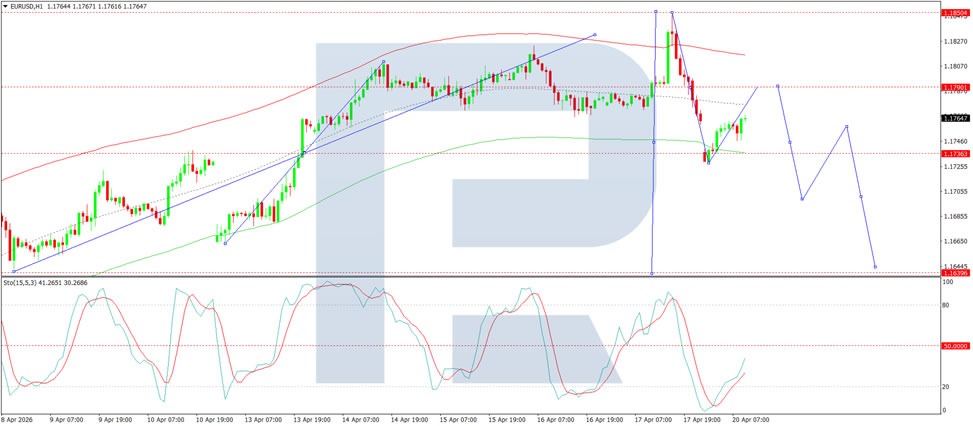
On the H1 chart, the market is forming the structure of the next upward wave to the 1.1790 level. After reaching this level, a correction to 1.1700 is likely, followed by a possible rise to 1.1745. Technically, this scenario is confirmed by the Stochastic oscillator, with its signal line below 50 and pointing firmly upwards towards 80.
Conclusion
EUR/USD has opened the week on a positive note, but the outlook remains fragile following renewed escalation in the US-Iran conflict. Trump's announcement of a naval incident in the Gulf of Oman and Tehran's withdrawal from planned talks and efforts to reopen the Strait of Hormuz have revived geopolitical risks. Energy supply concerns are intensifying inflationary pressures, pushing Fed rate cut expectations further out, with rates now expected to remain on hold through 2026. While technical indicators suggest a short-term bounce towards 1.1790, the broader bearish momentum appears intact, and any sustained euro strength would likely require a genuine de-escalation of the conflict.
DAX Uptrend at Risk from Fundamentals
March proved to be one of the weakest months for the German index in recent years, though conditions stabilised by mid-April. At present, the DAX (Germany 40 mini on FXOpen) is showing a solid recovery, trading around 24,650. The rebound has been largely driven by gains in Rheinmetall and Infineon, highlighting investor preference for defence and technology stocks amid the current geopolitical backdrop.
The index remains highly sensitive to developments around the Strait of Hormuz. Ongoing reports of blockades and resumptions in shipping continue to fuel uncertainty in energy markets, directly affecting costs for German industry. At the same time, ECB policy remains a limiting factor: the central bank has kept rates at 2.0%, and despite inflation concerns, markets are not pricing in easing before the summer.
Technical picture
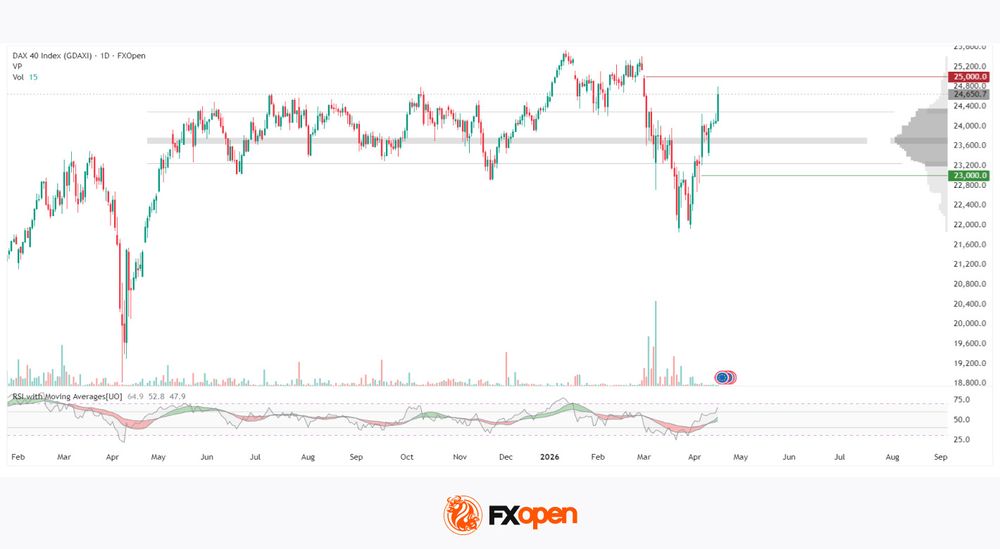
After reaching highs near 25,500 in January 2026, the index entered a sharp correction phase. A gap on 2 March signalled a shift in sentiment, prompting traders to close long positions. On 9 March, an extreme spike in vertical volume was recorded as the market attempted to break below 23,000. The index later tested strong support at 22,000, where heavy buying emerged and a base began to form.
Following the rebound, the price consolidated above the POC zone of 23,500–23,800, which has since turned into support. Volume levels have normalised after the March volatility, suggesting that panic selling has subsided. The RSI indicator confirms improving momentum, rising to 64.9 and holding above its moving averages, pointing to renewed bullish strength. The next key resistance for buyers stands at 25,000.
Summary
Holding above the POC zone has restored a bullish structure, returning control to buyers. The 23,000 level is now shaping up as a strong support area, while RSI with MA signals recovering demand. However, despite the current rebound, the broader fundamental backdrop remains mixed, with geopolitical risks and ECB policy expectations continuing to influence the index’s trajectory.
Trade global index CFDs with zero commission and tight spreads (additional fees may apply). Open your FXOpen account now or learn more about trading index CFDs with FXOpen.
This article represents the opinion of the Companies operating under the FXOpen brand only. It is not to be construed as an offer, solicitation, or recommendation with respect to products and services provided by the Companies operating under the FXOpen brand, nor is it to be considered financial advice.
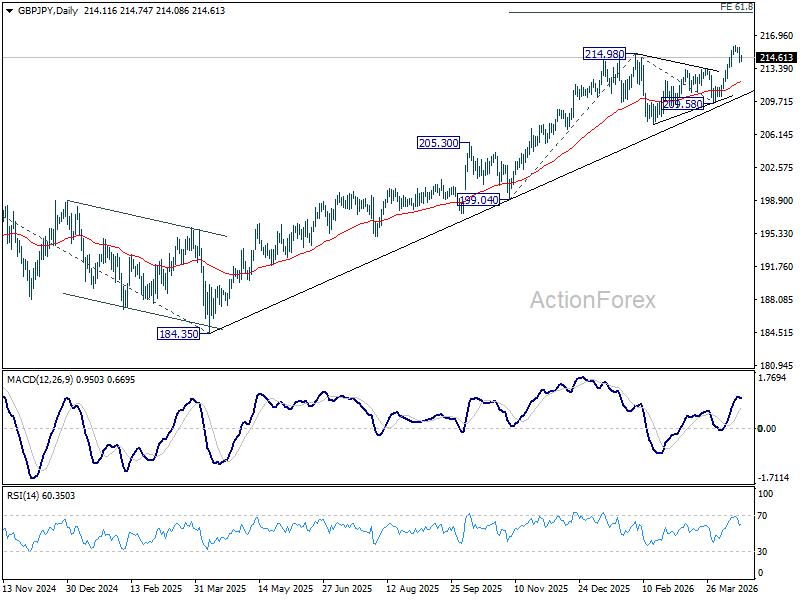
GBP/JPY Daily Outlook
Daily Pivots: (S1) 213.74; (P) 214.72; (R1) 215.43; More...
Intraday bias in GBP/JPY remains neutral for the moment, and more consolidations could be seen below 215.89. Further rise is expected as long as 213.29 resistance turned support holds. Firm break of 215.89 will resume larger up trend to 61.8% projection of 199.04 to 214.98 from 209.58 at 219.43.
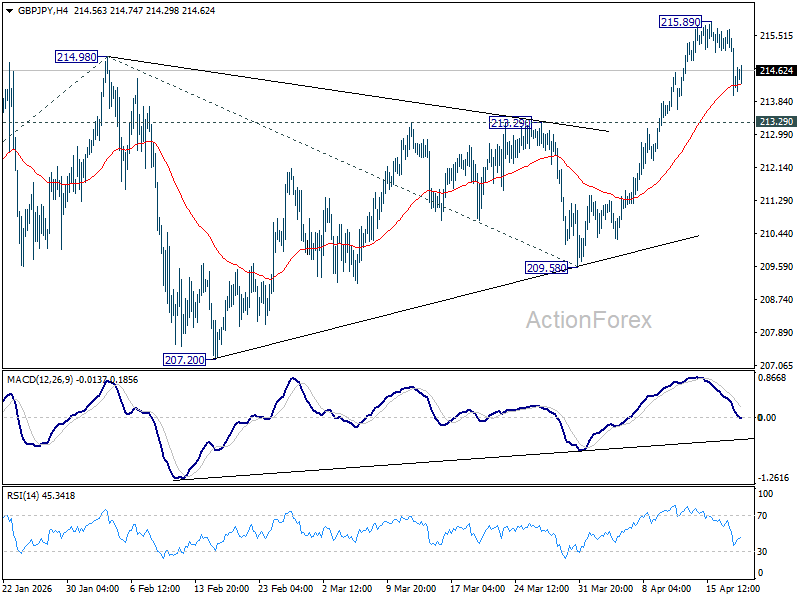
In the bigger picture, up trend from 123.94 (2020 low) is still in progress. Firm break of 214.98 will target 61.8% projection of 148.93 (2022 low) to 208.09 (2024 high) from 184.35 at 220.90. This will remain the favored case as long as 55 W EMA (now at 204.83) holds, even in case of another deep pullback.
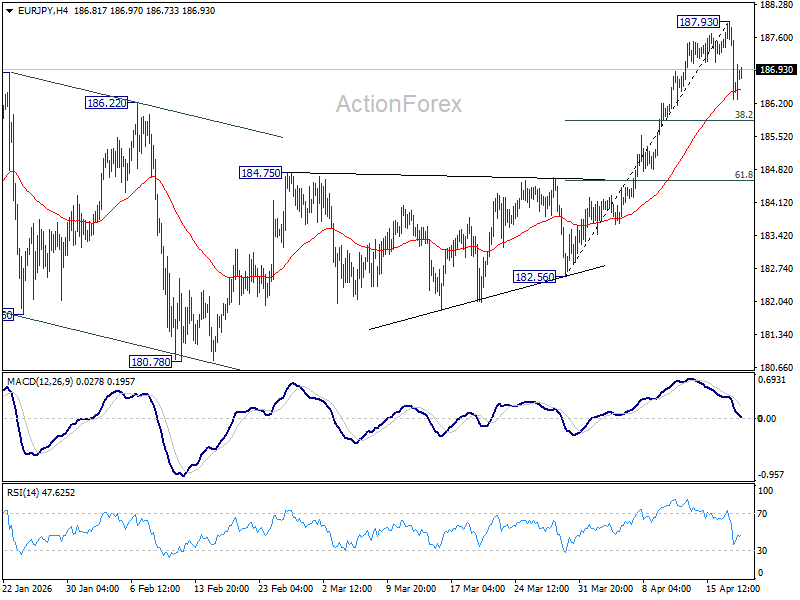
EUR/JPY Daily Outlook
Daily Pivots: (S1) 185.99; (P) 186.97; (R1) 187.63; More...
Intraday bias in EUR/JPY is turned neutral with current recovery. But more consolidations could be seen below 187.93 short term top. Another fall might be seen to 38.2% retracement of 182.56 to 187.93 at 185.87. On the upside, though, break of 187.93 will resume larger up trend.
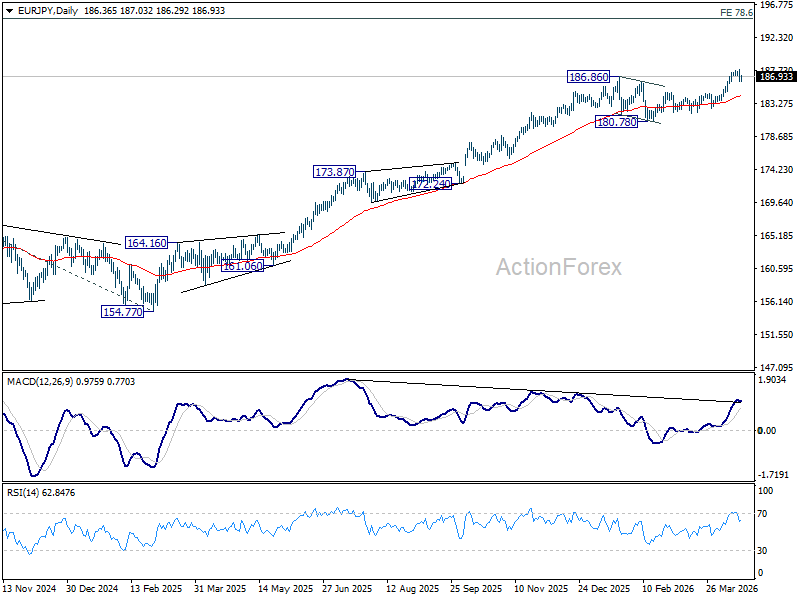
In the bigger picture, up trend from 114.42 (2020 low) is in progress Next target is 78.6% projection of 124.37 (2022 low) to 175.41 (2025 high) from 154.77 at 194.88 next. For now, medium term outlook will stay bullish as long as 180.78 support holds, even in case of deeper pullback.
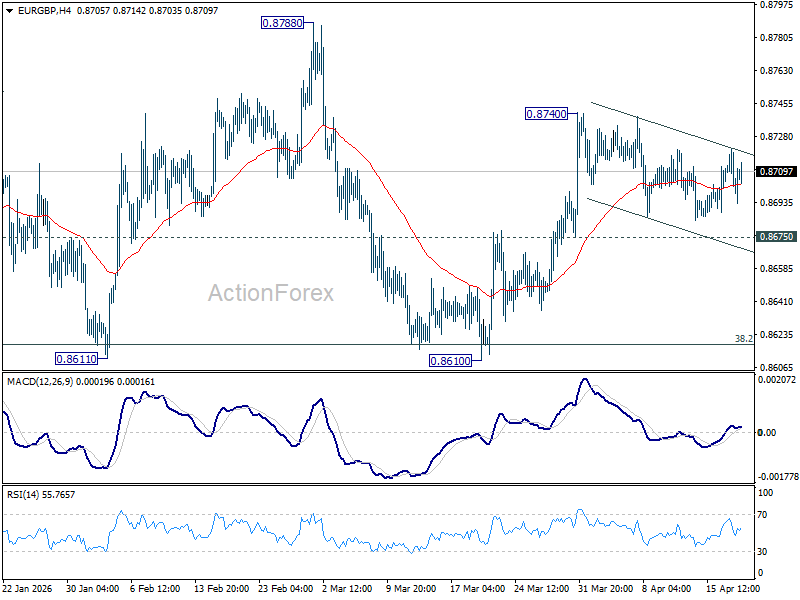
EUR/GBP Daily Outlook
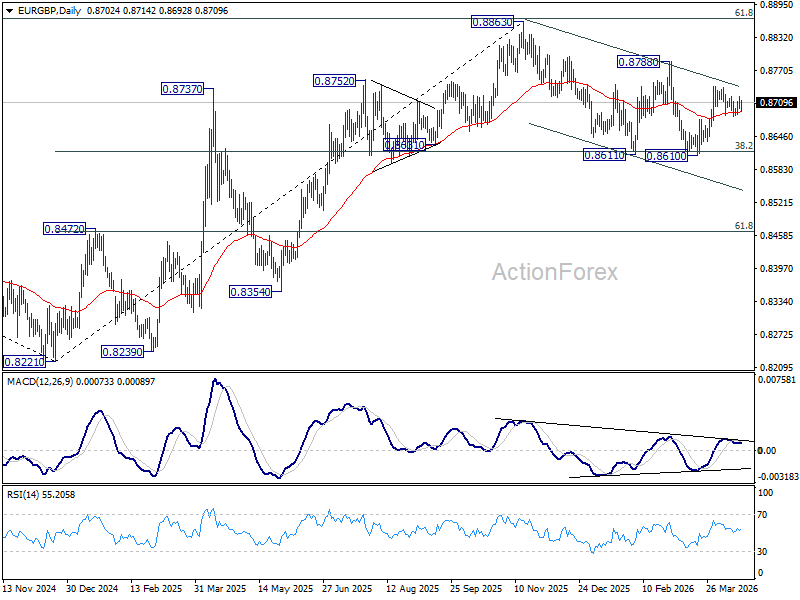
Daily Pivots: (S1) 0.8693; (P) 0.8710; (R1) 0.8719; More…
Intraday bias in EUR/GBP remains neutral and more consolidations could be seen below 0.8740. As long as 0.8675 support holds, further rise remains mildly in favor. On the upside, break of 0.8740 will resume the rally from 0.8610 to 0.8788 resistance. However, firm break of 0.8675 will turn bias back to the downside for retesting 0.8610 low instead.
In the bigger picture, strong support was seen again from 38.2% retracement of 0.8821 to 0.8863 at 0.8618. Break of 0.8788 resistance will argue that larger rise from 0.8221 might be ready to resume through 0.8863 (2025 high). Nevertheless, sustained trading below 0.8618 should confirm bearish reversal, and bring deeper fall to 61.8% retracement at 0.8466 at least.
EUR/AUD Daily Outlook
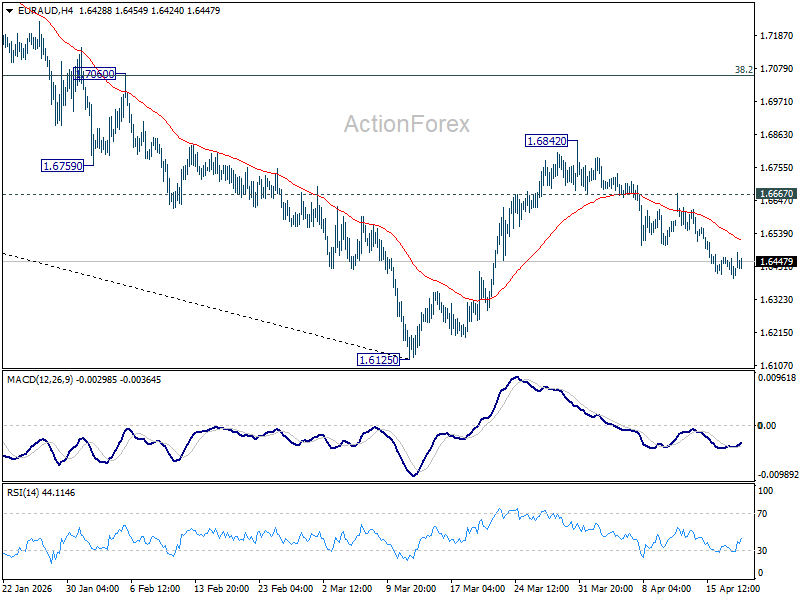
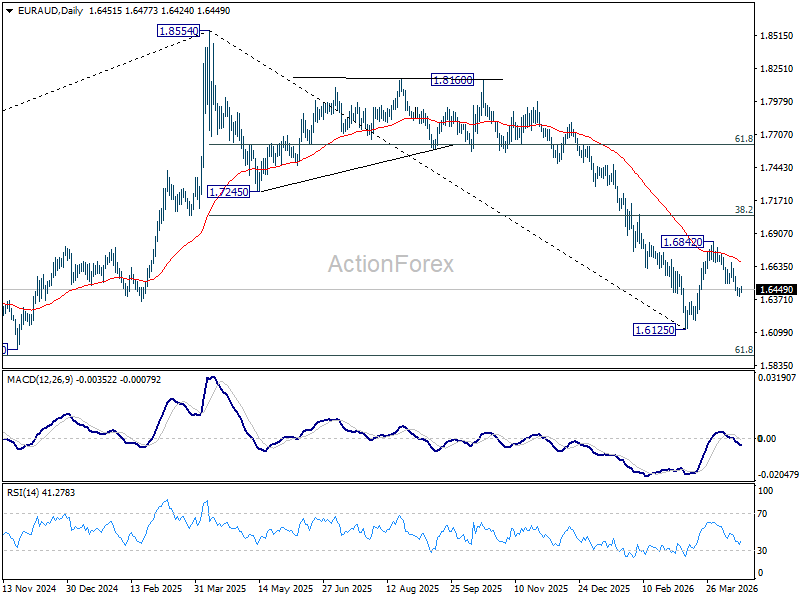
Daily Pivots: (S1) 1.6381; (P) 1.6423; (R1) 1.6452; More...
Further decline is expected in EUR/AUD as long as 1.6667 resistance holds. Deeper fall should be seen to retest 1.6125 low. Firm break there will resume whole down trend from 1.8554 to 1.5913 fibonacci level next. However, break of 1.6667 will turn bias back to the upside for 1.6842 resistance instead.
In the bigger picture, fall from 1.8554 (2025 high) is in progress and deeper decline should be seen to 61.8% retracement of 1.4281 to 1.8554 at 1.5913, which is slightly below 1.5963 structural support. Decisive break there will pave the way back to 1.4281 (2022 low). For now, risk will stay on the downside as long as 55 W EMA (now at 1.7131) holds, even in case of strong rebound.
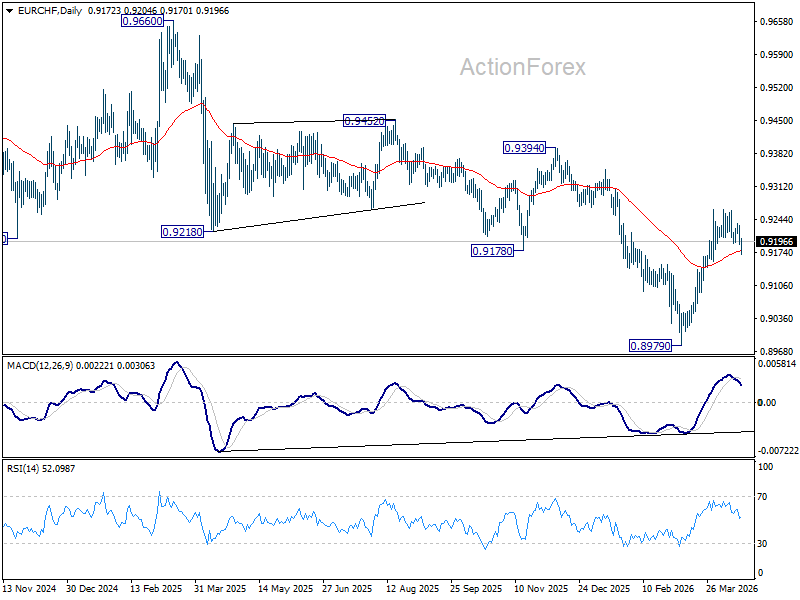
EUR/CHF Daily Outlook
Daily Pivots: (S1) 0.9180; (P) 0.9208; (R1) 0.9225; More....
Intraday bias sin EUR/CHF stays neutral and consolidations from 0.9264 could extend further. With 0.9155 support intact, further rally is still expected. Firm break of 0.9264 will resume the rise from 0.8979 to 0.9394 resistance next. However, break of 0.9155 will turn bias back to the downside for deeper pullback.
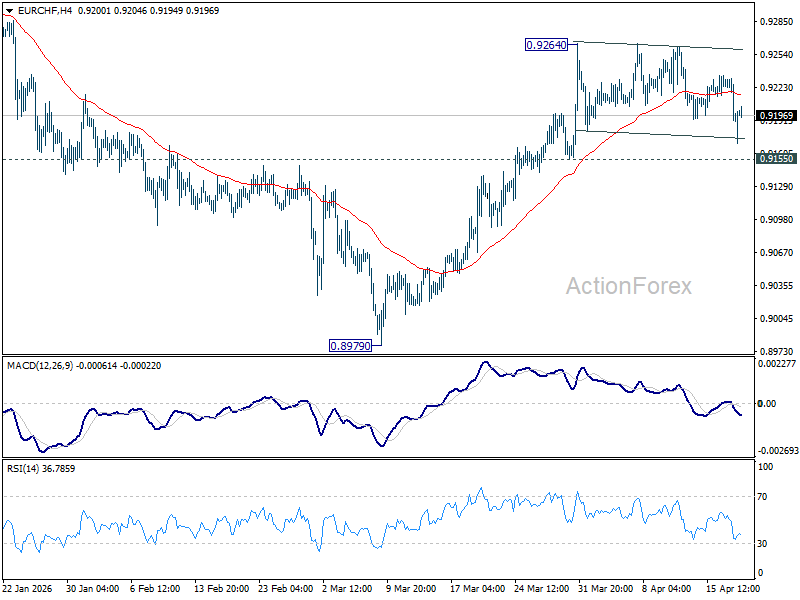
In the bigger picture, considering bullish convergence condition in W MACD, a medium term bottom should be in place at 0.8979. Sustained trading above 55 W EMA (now at 0.9280) will add more credence to this case. Further break of 0.9394 resistance will pave the way to 0.9660 resistance next. However rejection by the 55 W EMA will set up another fall through 0.8979 low at a later stage.
Gold Slips While WTI Crude Oil Eyes Fresh Upside
Gold price extended losses below $4,800 before the bulls appeared. WTI Crude oil prices are rising and could climb further higher toward $92.00.
Important Takeaways for Gold and WTI Crude Oil Prices Analysis Today
- Gold price failed to clear $4,900 and declined steadily against the US Dollar.
- There is a key bearish trend line forming with resistance at $4,815 on the hourly chart of gold at FXOpen.
- WTI Crude oil prices are moving higher above the $85.00 pivot zone.
- There is a connecting bearish trend line forming with resistance at $89.10 on the hourly chart of XTI/USD at FXOpen.
Gold Price Technical Analysis
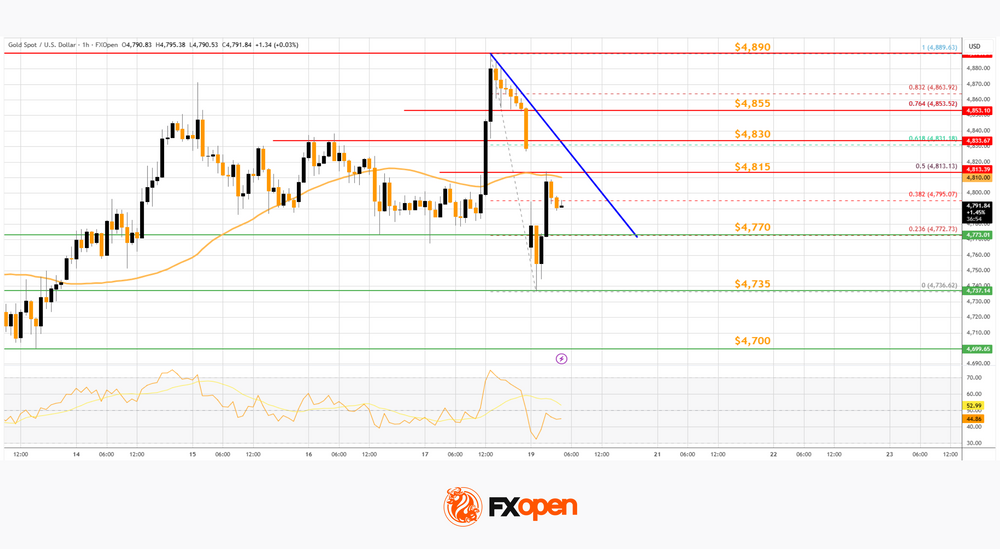
On the hourly chart of Gold at FXOpen, the price failed to settle above $4,900 and reacted to the downside, as discussed in the previous analysis. The price traded below $4,850 and $4,800 to enter a short-term bearish zone.
There was a sharp drop below $4,750. The price settled below the 50-hour simple moving average, and RSI dipped below 40. Finally, it tested the $4,700 zone. A low was formed at $4,699, and the price is now correcting some losses.
Immediate hurdle on the upside is $4,815 or the 50% Fib retracement level of the downward move from the $4,889 swing high to the $4,699 low. There is also a key bearish trend line forming with resistance at $4,815.
The first major barrier for the bulls could be $4,830 and the 61.8% Fib retracement. A close above $4,830 could initiate a recovery wave to $4,855. An upside break above $4,855 could send Gold price toward $4,890. Any more gains may perhaps set the pace for an increase toward $5,000.
If there is no fresh increase, the price could continue to move down. Initial support on the downside is near the $4,770 level. The first key area of interest might be $4,700. If there is a downside break below $4,700, the price might decline further. In the stated case, the price might drop to $4,500.
WTI Crude Oil Price Technical Analysis
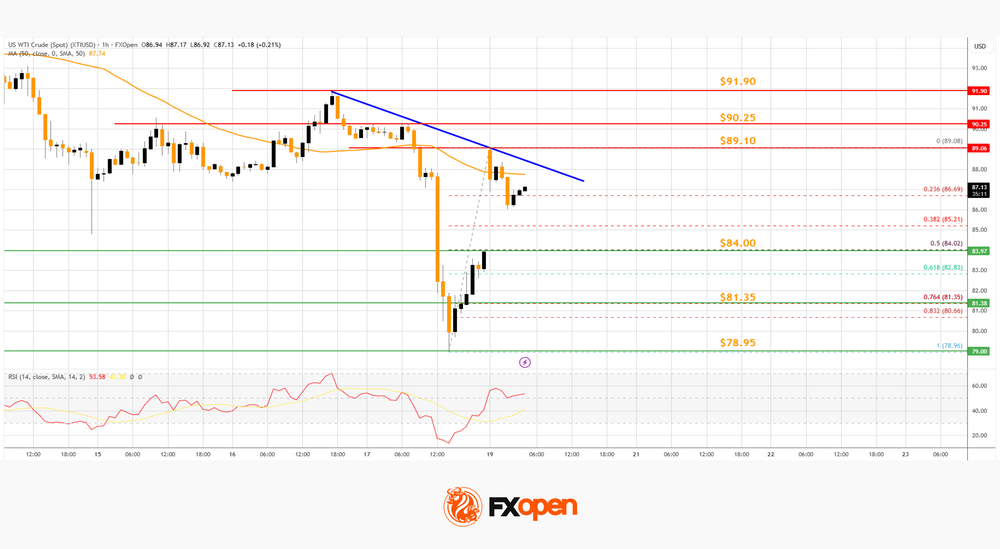
On the hourly chart of WTI Crude Oil at FXOpen, the price started a fresh increase from $79.00 against the US Dollar. The price gained bullish momentum after it broke $84.00.
There was a sustained upward movement above $84.50 and $85.00. The bulls pushed the price above the 50-hour simple moving average, and the RSI climbed toward 60. A high was formed near $89.08 before there was a minor pullback. The price declined below the 23.6% Fib retracement level of the upward move from the $78.96 swing low to the $89.08 high.
However, the bulls are active above $85.00. Immediate resistance is near a connecting bearish trend line at $89.10. If the price climbs further, it could face hurdles near $90.25.
The next major stop for the bulls might be $91.90. Any more gain might send the price toward $95.00. Conversely, the price might correct gains and test the 50% Fib retracement at $84.00. The next area of interest on the WTI crude oil chart could be $81.35.
If there is a downside break, the price might decline to $80.00. Any more losses may perhaps open the doors for a move toward $75.00.
Start trading commodity CFDs with tight spreads (additional fees may apply). Open your trading account now or learn more about trading commodity CFDs with FXOpen.
This article represents the opinion of the Companies operating under the FXOpen brand only. It is not to be construed as an offer, solicitation, or recommendation with respect to products and services provided by the Companies operating under the FXOpen brand, nor is it to be considered financial advice.